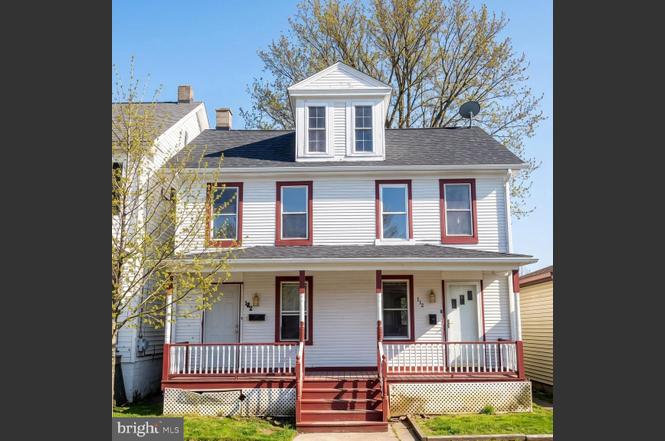
641-643 Pine St · Kulpmont, PA
Flood risk 1/10 · Minimal
- FEMA flood zone
- X (unshaded)
- Chance of flooding over 30 yrs
- 0.0%
- Est. flood insurance / yr
- $473 – $860
Fire risk 4/10 · Minor
- Est. fire insurance / yr
- $511 – $949
Heat risk 4/10 · Minor
- Hot days now (above 93°F)
- 7 days/yr
- Hot days in 30 yrs
- 16 days/yr
Wind risk 3/10 · Minor
- Chance of severe wind over 30 yrs
- 5.0%
Air-quality risk 2/10 · Minimal
- Unhealthy air days now
- 1 days/yr
- Unhealthy air days in 30 yrs
- 2 days/yr
Risk factors via First Street. Map © Google.
Why this score? — see what drove the D grade
The composite is a weighted blend of 9 inputs, each scored 0–100. Each bar is that input's sub-score; the figure is the points it added to the 100-point composite (weight × sub-score).
- Cash flow +12.9/30.0
- ARV discount +7.5/15.0
- Appreciation +6.4/10.0
- DSCR +3.9/10.0
- Livability +3.7/5.0
- Rent growth +2.5/5.0
- Condition / age +2.5/5.0
- 1% rule +2.3/10.0
- Schools +2.3/10.0
$175,000
🖨 Deal sheet (PDF) 📄 Offer letter ✓ Due diligence
Listing remarks
Investor-ready, fully remodeled duplex in the heart of Kulpmont with immediate, reliable cash flow - both units are already leased on annual terms. Set on a quiet residential street, the property offers the small-town appeal of Kulpmont: a slower pace, friendly neighbors, and classic neighborhood charm, with Mount Carmel and Shamokin just minutes away. Commuter-friendly location just off PA Route 61 for direct access to Shamokin, Sunbury, and surrounding communities. Quick links via PA Route 54 to I-80 and I-81, plus PA 901 toward I-81, make regional travel simple. Both units have been professionally updated. The larger unit features 4 bedrooms and 1 full bath. The second unit offers 1 bedr
Key facts
- 3 parking spots
- Built 1930
- Listed 39 days
Neighborhood map
What this means for you Summary
Snapshot
- This is a 4-bed/?-bath other listed at $175k.
Deal economics
- At list price, monthly cash flow is $-13 ($-154/yr) — negative.
- To cash-flow at today's rent, offer at most $173k (1.3% below list).
- To meet the 1% rule (rent ≥ 1% of price), the offer needs to be $128k (26.7% below list).
- Recommended offer: $128k (26.7% below list) — sets the bar for 1% rule.
Location & tenants
- Location reads 73/100 on livability (#581 in PA) — a middle-class / working-renter tenant base. Strengths: crime A+, cost of living A+, housing A+; Watch: employment C-, amenities F, commute F.
- Mount Carmel Area SD (town): math 20% / reading 37% proficiency, ranked #455 of 539 in PA (top 84%) — low school quality limits family demand, transient renter base, plan for 1-2y turnover.
- Zoned schools: Mount Carmel Area El Sch (math 18% / reading 40%, grade F, #1,146 of 1,518 statewide, top 76%, 790 students, 100% FRL); Mount Carmel Area Jh (math 13% / reading 30%, grade F, #429 of 512 statewide, top 84%, 263 students, 100% FRL); Mount Carmel Area Hs (math 57% / reading 75%, grade B, #62 of 437 statewide, top 14%, 493 students, 74% FRL) — zoned schools average 91% FRL vs 50% district-wide (42 pts higher); higher-poverty schools than district average — tighter screening recommended.
- Market conditions: 14 active listings in the ZIP; 81 units permitted in Northumberland County in 2024 (0 in 5+ unit buildings).
Forward outlook
- In year one you build about $6k of equity ($1k loan paydown + $5k appreciation (2.8% local appreciation)).
- Northumberland County population projected at -11% by 2050 — secular population decline; favor cash flow + early exit over multi-decade hold.
- At projected returns (2.8% appreciation + 3.0% rent growth), your $49k cash investment doubles in ~7 years — after that, you're playing with house money.
- By year 6, paydown + projected appreciation supports a ~$32k cash-out refi (75% LTV) — recoverable capital for the next deal without selling this one.
Negotiation context
- It's been on market 40 days — a 3% lower offer ($170k) is reasonable based on typical stale-listing flexibility.
- 3 sale attempts with the ask held roughly flat each time — persistent listings suggest the price (not the market) is what's stuck; bring a comps-based counter.
- Current owner paid $50k; list at $175k implies a 250% gain — meaningful room to come down on a strong offer.
Risks & watch-outs
- Watch-outs: built in 1930 — expect roof / HVAC / electrical / plumbing capex.
Questions for the listing agent
- What do current leases actually rent for vs. the listed asking? Can we see a recent rent roll and the last 12 months of T-12 income?
- It's been on market 40 days. Have you received any prior offers? Is the seller open to a 27% concession, seller financing, or rate buy-down credit?
- Built in 1930 — when were the roof, HVAC, electrical panel, plumbing, and water heater last replaced?
- Is there a deadline driving the sale (1031 exchange, divorce, estate, relocation)? That informs how much negotiation room exists.
- Schools are F-rated, which usually means shorter tenancies and higher turnover. Who's the typical renter profile here, and what's been the actual vacancy rate?
- The area grade is low — what's the realistic commute time and amenity access for the typical tenant pool here? Any planned neighborhood developments (good or bad) we should know about?
- What's the average days-on-market for RENTAL listings here right now (not sales)? A rising rental-DOM trend means longer vacancies and softer asking-rent achievability than the comps imply.
- What's the recent tenant-quality profile in this submarket — average credit score on applications, eviction rate, late-payment / NSF rate, and stable-employment percentage? A property-management company in the area should have these aggregated.
- How much new for-sale + rental construction is in the pipeline within 1–3 miles? Heavy new supply typically softens prices + rents 12–24 months out; constrained supply supports both.
Investment metrics
- 1% rule
- 0.73% ✗
- Cap rate
- 6.20%
- Cash-on-cash
- -0.32%
- DSCR
- 0.99
- GRM
- 11.4
CMA / ARV
No comps found within radius.
Projected returns pro-forma
2.76% appreciation · 3.0% rent growth · sell at horizon
- IRR
- 6.5%
- Equity multiple
- 1.37×
- Total profit
- $17,925
- Equity at exit
- $76,301
- IRR
- 9.4%
- Equity multiple
- 2.38×
- Total profit
- $67,675
- Equity at exit
- $115,766
Cash invested: $49,000 (down + closing). Projections, not guarantees.
Landlord ↔ Tenant lean methodology
- Overall (STATE)
- 62 Landlord-Friendly
- State Pennsylvania
- 62 Landlord-Friendly · EVEN
- County
- — inherits STATE
- City
- — inherits STATE
ZIP-level market 17834
- Home prices YoY
- 2.3%
- Active inventory
- 14
- Price-to-rent
- 11.4×
Monthly cashflow live
- Estimated rent
- $1,283 medium interval (Pro) →
- Mortgage (P&I)
- −$918
- Tax from tax record
- −$36 /mo · $428/yr
- Insurance
- −$73
- HOA
- −$0
- Vacancy / Maint / Mgmt
- −$269
- Net cashflow
- $-13
Break-even live
Sensitivity live
| Price | -10% $86 | -5% $37 | +0% $-13 | +5% $-62 | +10% $-112 |
|---|---|---|---|---|---|
| Rent | -10% $-114 | -5% $-64 | +0% $-13 | +5% $38 | +10% $88 |
| Rate | -1.0pp $75 | -0.5pp $32 | base $-13 | +0.5pp $-58 | +1.0pp $-104 |
UW: 25.0% down · 7.5% · 30yr · 1.5% tax · 5.0% vac · 8.0% maint · 8.0% mgmt
Financing live
Cash to close
- Down payment
- $43,750
- Closing costs
- $5,250
- Reserves months
- —
- Total cash needed
- —
Loan-product check · same deal, 3 products live
Conventional
25% down · 7.5% · 30yr
- Down + closing
- —
- Monthly P&I
- —
- Monthly cashflow
- —
- DSCR
- —
- Eligible?
- —
Personal DTI + credit; lowest rate.
DSCR
20% down · 8.5% · 30yr
- Down + closing
- —
- Monthly P&I
- —
- Monthly cashflow
- —
- DSCR
- —
- Eligible?
- —
No personal income docs; deal must DSCR.
Hard money
10% down · 12.0% · 12mo
- Down + closing
- —
- Monthly P&I
- —
- Monthly cashflow
- —
- DSCR
- —
- Eligible?
- —
Short-term bridge; refi at stabilization.
Listing history 28 events
-
2026-06-22days on market $175,000 Active 40 DOM
-
2026-06-21days on market $175,000 Active 39 DOM
-
2026-06-21days on market $175,000 Active 38 DOM
-
2026-06-18days on market $175,000 Active 36 DOM
-
2026-06-17days on market $175,000 Active 35 DOM
-
2026-06-16days on market $175,000 Active 34 DOM
-
2026-06-15days on market $175,000 Active 33 DOM
-
2026-06-13days on market $175,000 Active 31 DOM
-
2026-06-12days on market $175,000 Active 30 DOM
-
2026-06-09days on market $175,000 Active 27 DOM
-
2026-06-08days on market $175,000 Active 26 DOM
-
2026-06-08days on market $175,000 Active 25 DOM
-
2026-06-07statusdays on market $175,000 Active 24 DOM
-
2026-05-21historical $695
-
2026-05-08price $695
-
2026-04-26price $750
-
2026-04-14price $795
-
2026-04-07status Pending
-
2026-04-07price $850
-
2026-03-31price $950
-
2026-03-30status Active
-
2026-02-23status Pending
-
2026-02-21price $975
-
2026-02-09$175,000 Active
-
2026-02-06historical $175,000
-
2026-02-05$1,000
-
2025-12-18soldstatus $50,000
-
2025-12-18soldstatus $100,000
ⓘ Source: listings_history table (triggers on properties + properties_extension) + one-shot
backfill from property_details.listing_events for pre-trigger history.
Tax reassessment forecast PA · Partial reset (capped growth)
- Current annual tax
- $428 · $36/mo
- Projected year-2 tax
- $1,596 · $133/mo
- Expected delta
- +$1,169/yr (+$97/mo · 273.3%)
ⓘ Screening estimate from a state-policy table — verify with the county assessor before closing.
Climate risk First Street
- Flood 1/10 Low FEMA zone X (unshaded) · 0% chance over 30 yrs
- Wildfire 4/10 Moderate
- Heat 4/10 Moderate 7 d/yr ≥93°F today · 16 d/yr by 30 yrs out
- Wind 3/10 Moderate 5% chance of damaging wind over 30 yrs
- Air quality 2/10 Low 1 unhealthy d/yr today · 2 by 30 yrs out
Nearby sold comps map
Loading sold comps map…
Walkable amenities ~0.75 mi
Loading nearby amenities…
Taxation est. · year 1
- Rental income
- $15,393
- − Mortgage interest
- −$9,803
- − Property taxes
- −$428
- − Insurance
- −$875
- − Repairs & maintenance
- −$1,231
- − Management
- −$1,231
- − Depreciation
- −$5,091
- Taxable loss
- −$3,266
- Est. tax savings @ 24.0%
- +$784
- After-tax cash flow
- $629/yr
For passive investors: Depreciation is non-cash, so a rental often shows a tax loss while cash-flowing — sheltering income. Rental losses are passive: they offset passive income freely, and up to $25,000/yr can offset ordinary (W-2) income if you actively participate and your MAGI is under $100k (phasing out to $0 by $150k); unused losses carry forward. On sale, claimed depreciation is recaptured at up to 25%, and gains may owe capital-gains tax (a 1031 exchange can defer both). Figures are a year-1 estimate at your 24.0% rate — not tax advice; consult a CPA.
Schools (NCES district)
- District
- Mount Carmel Area SD
- NCES district ID
- 4215990
- Math proficiency
- 20% ▼ -18.00%
- Reading proficiency
- 37% ▼ -15.00%
- Median HH income
- $35,195
- Composite
- 23.48/100
- National rank
- #7876
- State rank
- #455 of 539 in PA
Livability — Kulpmont
- Score
- 73/100
- State rank
- #581
- US rank
- #5591
Category grades
Schools grade is shown separately in the Schools card above.
Census & demographics
- Census place
- Kulpmont, PA
- Population (ZIP)
- 3,525
Population outlook (Northumberland County) Hauer SSP2
- Today (2025)
- 90,896 people
- By 2030
- 89,084 · -2.0%
- By 2040
- 84,822 · -6.7%
- By 2050
- 80,521 · -11.4%
- By 2075
- 72,152 · -20.6%
- By 2100
- 62,257 · -31.5%
Race, ethnicity, and origin ACS 2023
- Neighborhood character
- Predominantly White (90%)
- Race & ethnicity
- White 90% Hispanic / Latino 7% Two or more races 5% Asian 4%
- Hispanic origin (detail)
- Puerto Rican 6%
- Common ancestry
- Romanian 24% Iranian 8% Scotch-Irish 3%
- Foreign-born
- 3% · China
- Languages at home
- 95% English-only · Chinese 2% Other Indo-European 2% Russian/Polish/Slavic 1%
Political lean MEDSL · Northumberland
- 2024 margin
- Solid R (+39.9) · D 29.6% · R 69.5%
- 2008→2024 swing
- -26.1pp toward R · 2008: -13.8pp · 2024: -39.9pp
- All cycles
- 2024: R+39.9 2020: R+38.5 2016: R+43.6 2012: R+19.4 2008: R+13.8
Not yet ingested
- Civics
- —
Market trends
- HPI YoY
- ▲ 2.76%
- Current HPI
- 121.4505
- Rent YoY
- —
- Metro
- —
- State GDP YoY
- ▲ 1.68%
- F500 in state
- 34
Industry mix (Fortune 500 HQ in PA)
| Industry | F500 HQs | Revenue |
|---|---|---|
| Healthcare | 2 | $309B |
|
||
| Insurance | 2 | $27B |
|
||
| Telecommunications / Media | 1 | $124B |
|
||
| Industrial Distribution | 1 | $22B |
|
||
| Financial Services | 1 | $20B |
|
||
| Chemicals / Materials | 1 | $18B |
|
||
Price history
+250.0% since first listed15 events — show timeline
- 2026-05-21 Rental Removed $695 APPFOLIO
- 2026-05-08 Price Changed $695 APPFOLIO
- 2026-04-26 Price Changed $750 APPFOLIO
- 2026-04-14 Price Changed $795 APPFOLIO
- 2026-04-07 Pending — BRIGHT MLS
- 2026-04-07 Price Changed $850 APPFOLIO
- 2026-03-31 Price Changed $950 APPFOLIO
- 2026-03-30 Relisted — BRIGHT MLS
- 2026-02-23 Pending — BRIGHT MLS
- 2026-02-21 Price Changed $975 APPFOLIO
- 2026-02-09 Listed $175,000 BRIGHT MLS
- 2026-02-06 Coming Soon $175,000 BRIGHT MLS
- 2026-02-05 Listed for Rent $1,000 APPFOLIO
- 2025-12-18 Sold (Public Records) $100,000 Public Records
- 2025-12-18 Sold (Public Records) $50,000 Public Records
Property tax history
+2.6%/yrLatest (2026): $428 · +1.7% YoY. Source: county tax records.
Cash-flow waterfall
monthlySold comps — $/sqft
last 12 mo · ≤1 miLoading sold comps…