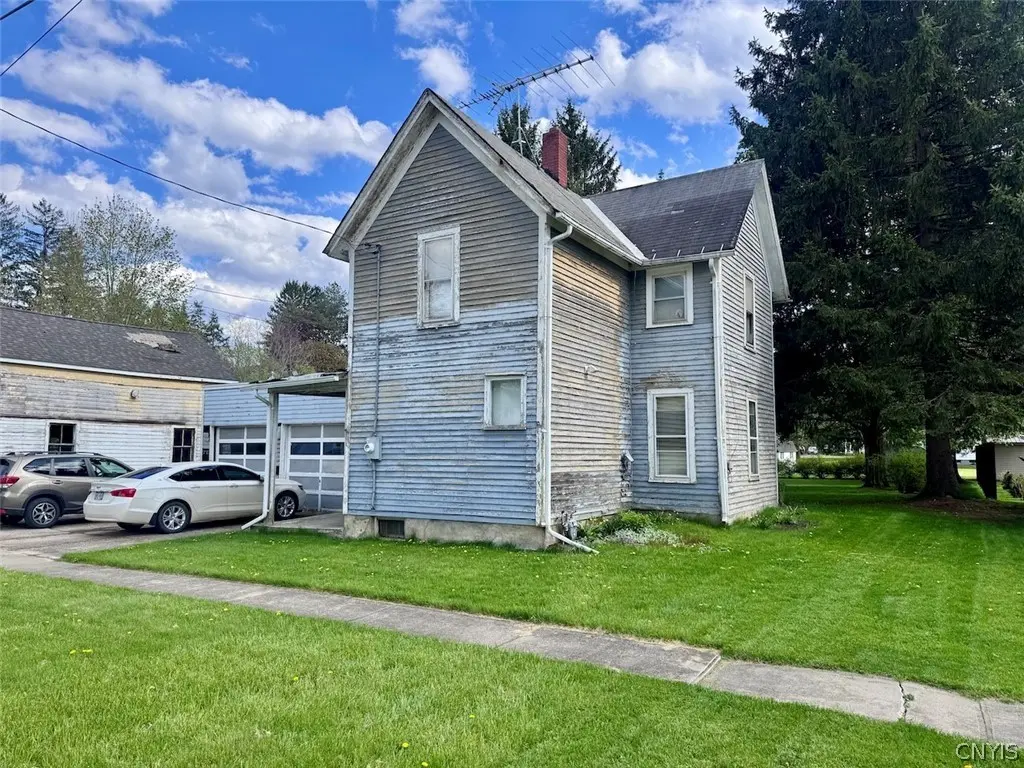
12 Norton St · Belmont, NY
Flood risk 5/10 · Moderate
- FEMA flood zone
- X
- Chance of flooding over 30 yrs
- 0.47%
- Est. flood insurance / yr
- $473 – $860
Fire risk 3/10 · Minor
- Est. fire insurance / yr
- $691 – $1,283
Heat risk 2/10 · Minimal
- Hot days now (above 90°F)
- 7 days/yr
- Hot days in 30 yrs
- 18 days/yr
Wind risk 1/10 · Minimal
- Chance of severe wind over 30 yrs
- —
Air-quality risk 1/10 · Minimal
- Unhealthy air days now
- 0 days/yr
- Unhealthy air days in 30 yrs
- 0 days/yr
Risk factors via First Street. Map © Google.
Why this score? — see what drove the B+ grade
The composite is a weighted blend of 9 inputs, each scored 0–100. Each bar is that input's sub-score; the figure is the points it added to the 100-point composite (weight × sub-score).
- Cash flow +30.0/30.0
- 1% rule +10.0/10.0
- DSCR +10.0/10.0
- Appreciation +8.4/10.0
- ARV discount +7.5/15.0
- Schools +4.5/10.0
- Livability +3.6/5.0
- Rent growth +2.5/5.0
- Condition / age +2.5/5.0
$45,900
🖨 Deal sheet 📄 Offer letter ✓ Due diligence
Listing remarks
Opportunity awaits with this spacious 2-story home located on a quiet street in the Village of Belmont NY, Allegany County. Offering 4 bedrooms, including one conveniently located on the first floor and three additional bedrooms upstairs, this property has plenty of space and potential for the right buyer. The home features a full bathroom on the main level, with room and potential to add a second full bath upstairs. A large attached 2-car garage provides excellent storage and workspace options. Situated on 0.25 acres, the property also includes a great backyard perfect for outdoor enjoyment, gardening, and entertaining. Conveniently located within the Genesee Valley Sc
Key facts
- 2 story home
- Great backyard
- 0.25 acre lot
Tags
Property features AI
Exterior
- Parking: Attached garage; 2 garage spaces
- Utilities: Public water (connected); Sewer connected
- Home design: 2-story home; Existing construction
- Construction: Frame construction with wood siding; Stone foundation; Asphalt roof
- Exterior features: Concrete driveway; Rectangular residential lot with 50 x 200 dimensions; City street frontage
Interior
- Kitchen: Eat-in kitchen
- Bedrooms: 1 main-level bedroom
- Flooring: Hardwood; Varied flooring
- Bathrooms: 1 full bathroom (main level)
- Heating & cooling: Gas forced-air heating
- Interior features: Eat-in kitchen; Other interior features (see remarks); Crawl space/partial basement
- Laundry & utility: Washer; Dryer; Gas water heater
Neighborhood map
What this means for you Summary
Snapshot
- This is a 4-bed/2.0-bath single-family listed at $46k.
Deal economics
- At list price, monthly cash flow is $599 ($7k/yr) — positive.
- The deal already cash-flows at list — no discount required.
- Meets the 1% rule at list price ($1k rent vs $46k).
- Recommended offer: $45k (3.0% below list) — sets the bar for market timing.
Location & tenants
- Location reads 71/100 on livability (#401 in NY) — a middle-class / working-renter tenant base. Strengths: cost of living A+, housing A+, health & safety A+; Watch: crime F, amenities F, commute F.
- Genesee Valley Central School District (rural): math 52% / reading 50% proficiency, ranked #453 of 755 in NY (top 60%) — acceptable for families but not a draw, mixed tenant base, ~2y average lease.
- Market conditions: 19 active listings in the ZIP; 87 units permitted in Allegany County in 2024 (0 in 5+ unit buildings).
Forward outlook
- In year one you build about $3k of equity ($317 loan paydown + $3k appreciation (6.8% local appreciation)).
- Allegany County population projected at -26% by 2050 — secular population decline; favor cash flow + early exit over multi-decade hold.
- At projected returns (6.8% appreciation + 3.0% rent growth), your $13k cash investment doubles in ~2 years — after that, you're playing with house money.
- By year 9, paydown + projected appreciation supports a ~$32k cash-out refi (75% LTV) — recoverable capital for the next deal without selling this one.
Negotiation context
- It's been on market 33 days — a 3% lower offer ($45k) is reasonable based on typical stale-listing flexibility.
- 3 sale attempts since 11y ago with the ask held roughly flat each time — persistent listings suggest the price (not the market) is what's stuck; bring a comps-based counter.
Risks & watch-outs
- Watch-outs: property tax is 3.8% of price; built in 1915 — expect roof / HVAC / electrical / plumbing capex.
- Climate carrying-cost: moderate flood risk — expect insurance premiums to compound above CPI over the hold.
Questions for the listing agent
- It's been on market 33 days. Have you received any prior offers? Is the seller open to a 3% concession, seller financing, or rate buy-down credit?
- Built in 1915 — when were the roof, HVAC, electrical panel, plumbing, and water heater last replaced?
- Property tax is high relative to price — has the assessment been appealed recently, and will the sale trigger a re-assessment?
- Is there a deadline driving the sale (1031 exchange, divorce, estate, relocation)? That informs how much negotiation room exists.
- Crime grade is F in this area — have there been break-ins, vandalism, or insurance claims at this property in the last 3 years? What carrier currently insures it and at what premium?
- What's the average days-on-market for RENTAL listings here right now (not sales)? A rising rental-DOM trend means longer vacancies and softer asking-rent achievability than the comps imply.
- What's the recent tenant-quality profile in this submarket — average credit score on applications, eviction rate, late-payment / NSF rate, and stable-employment percentage? A property-management company in the area should have these aggregated.
- How much new for-sale + rental construction is in the pipeline within 1–3 miles? Heavy new supply typically softens prices + rents 12–24 months out; constrained supply supports both.
Investment metrics
- 1% rule
- 2.77% ✓
- Cap rate
- 21.96%
- Cash-on-cash
- 55.96%
- DSCR
- 3.49
- GRM
- 3.0
CMA / ARV
- ARV (median comp)
- $137,624
- List price
- $45,900
- Delta
- -66.65%
- Verdict
- UNDERPRICED
- Comps
- 17 within 1.0 mi
Show comp detail 3 sales within ~0.75 mi
| Address | Dist | Beds/Ba | Sqft | Sold | Price | $/sf | Match |
|---|---|---|---|---|---|---|---|
| 14 Willets Ave | 0.09mi | 3/2.0 (-1) | 1,530 (+9%) | 11mo | $139,900 | $91 | 66 |
| 27 Willard St | 0.35mi | 3/1.0 (-1) | 1,272 (-9%) | 5mo | $72,000 | $57 | 56 |
| 7 Trianna St | 0.43mi | 3/1.5 (-1) | 1,272 (-9%) | 21mo | $79,900 | $63 | 40 |
Match score weights: distance 35% · size 25% · config 20% · recency 20%. Top-matched comps best support the ARV.
Projected returns pro-forma
6.77% appreciation · 3.0% rent growth · sell at horizon
- IRR
- 65.2%
- Equity multiple
- 5.17×
- Total profit
- $53,625
- Equity at exit
- $31,115
- IRR
- 61.5%
- Equity multiple
- 10.92×
- Total profit
- $127,530
- Equity at exit
- $58,488
Cash invested: $12,852 (down + closing). Projections, not guarantees.
Landlord ↔ Tenant lean methodology
- Overall (STATE)
- 15 Strongly Tenant-Friendly
- State New York
- 15 Strongly Tenant-Friendly · D+10
- County
- — inherits STATE
- City
- — inherits STATE
ZIP-level market 14813
- Home prices YoY
- 2.6%
- Active inventory
- 19
- Price-to-rent
- 3.0×
Monthly cashflow live
- Estimated rent
- $1,272 medium interval (Pro) →
- Mortgage (P&I)
- −$241
- Tax from tax record
- −$146 /mo · $1,747/yr
- Insurance
- −$19
- HOA
- −$0
- Vacancy / Maint / Mgmt
- −$267
- Net cashflow
- $599
Break-even live
UW: 25.0% down · 7.5% · 30yr · 1.5% tax · 5.0% vac · 8.0% maint · 8.0% mgmt
Financing live
Cash to close
- Down payment
- $11,475
- Closing costs
- $1,377
- Reserves months
- —
- Total cash needed
- —
Loan-product check · same deal, 3 products live
Conventional
25% down · 7.5% · 30yr
- Down + closing
- —
- Monthly P&I
- —
- Monthly cashflow
- —
- DSCR
- —
- Eligible?
- —
Personal DTI + credit; lowest rate.
DSCR
20% down · 8.5% · 30yr
- Down + closing
- —
- Monthly P&I
- —
- Monthly cashflow
- —
- DSCR
- —
- Eligible?
- —
No personal income docs; deal must DSCR.
Hard money
10% down · 12.0% · 12mo
- Down + closing
- —
- Monthly P&I
- —
- Monthly cashflow
- —
- DSCR
- —
- Eligible?
- —
Short-term bridge; refi at stabilization.
Listing history 16 events
-
2026-06-18days on market $45,900 Active 33 DOM
-
2026-06-17days on market $45,900 Active 32 DOM
-
2026-06-16days on market $45,900 Active 31 DOM
-
2026-06-15days on market $45,900 Active 30 DOM
-
2026-06-13days on market $45,900 Active 28 DOM
-
2026-06-12status $45,900 Active 27 DOM
-
2026-06-09status $45,900 Pending 27 DOM
-
2026-06-08days on market $45,900 Active 27 DOM
-
2026-06-07days on market $45,900 Active 26 DOM
-
2026-06-05days on market $45,900 Active 24 DOM
-
2026-06-04days on market $45,900 Active 22 DOM
-
2026-06-02days on market $45,900 Active 21 DOM
-
2026-06-01days on market $45,900 Active 20 DOM
-
2026-05-31days on market $45,900 Active 19 DOM
-
2026-05-12$45,900 Active 888-char remark
-
2015-05-19$38,900
ⓘ Source: listings_history table (triggers on properties + properties_extension) + one-shot
backfill from property_details.listing_events for pre-trigger history.
Tax reassessment forecast NY · Partial reset (capped growth)
- Current annual tax
- $1,747 · $146/mo
- Projected year-2 tax
- $1,747 · $146/mo
- Expected delta
- $0/yr ($0/mo · 0.0%)
ⓘ Screening estimate from a state-policy table — verify with the county assessor before closing.
Climate risk First Street
- Flood 5/10 Major FEMA zone X · 47% chance over 30 yrs
- Wildfire 3/10 Moderate
- Heat 2/10 Low 7 d/yr ≥90°F today · 18 d/yr by 30 yrs out
- Wind 1/10 Low
- Air quality 1/10 Low 0 unhealthy d/yr today · 0 by 30 yrs out
Nearby sold comps map
Loading sold comps map…
Walkable amenities ~0.75 mi
Loading nearby amenities…
Taxation est. · year 1
- Rental income
- $15,262
- − Mortgage interest
- −$2,571
- − Property taxes
- −$1,747
- − Insurance
- −$230
- − Repairs & maintenance
- −$1,221
- − Management
- −$1,221
- − Depreciation
- −$1,335
- Taxable income
- $6,938
- Est. tax owed @ 24.0%
- −$1,665
- After-tax cash flow
- $5,527/yr
For passive investors: Depreciation is non-cash, so a rental often shows a tax loss while cash-flowing — sheltering income. Rental losses are passive: they offset passive income freely, and up to $25,000/yr can offset ordinary (W-2) income if you actively participate and your MAGI is under $100k (phasing out to $0 by $150k); unused losses carry forward. On sale, claimed depreciation is recaptured at up to 25%, and gains may owe capital-gains tax (a 1031 exchange can defer both). Figures are a year-1 estimate at your 24.0% rate — not tax advice; consult a CPA.
Schools (NCES district)
- District
- Genesee Valley Central School District
- NCES district ID
- 3600017
- Math proficiency
- 52% ▲ 5.00%
- Reading proficiency
- 50% ▲ 1.00%
- Median HH income
- $43,704
- Composite
- 45.0/100
- National rank
- #5858
- State rank
- #453 of 755 in NY
Livability — Belmont
- Score
- 71/100
- State rank
- #401
- US rank
- #6959
Category grades
Schools grade is shown separately in the Schools card above.
Census & demographics
- Census place
- Belmont, NY
- Population (ZIP)
- 2,465
Population outlook (Allegany County) Hauer SSP2
- Today (2025)
- 45,362 people
- By 2030
- 43,078 · -5.0%
- By 2040
- 38,031 · -16.2%
- By 2050
- 33,634 · -25.9%
- By 2075
- 25,285 · -44.3%
- By 2100
- 18,902 · -58.3%
Race, ethnicity, and origin ACS 2023
- Neighborhood character
- Predominantly White (97%)
- Race & ethnicity
- White 97% Black 2%
- Common ancestry
- Lithuanian 4% Romanian 4% Slovak 2%
- Foreign-born
- 0%
Political lean MEDSL · Allegany
- 2024 margin
- Solid R (+43.2) · D 28.4% · R 71.6%
- 2008→2024 swing
- -21.5pp toward R · 2008: -21.7pp · 2024: -43.2pp
- All cycles
- 2024: R+43.2 2020: R+38.9 2016: R+42.3 2012: R+25.3 2008: R+21.7
Not yet ingested
- Civics
- —
Market trends
- HPI YoY
- ▲ 6.77%
- Current HPI
- 271.7193
- Rent YoY
- —
- Metro
- —
- State GDP YoY
- ▲ 2.60%
- F500 in state
- 92
Industry mix (Fortune 500 HQ in NY)
| Industry | F500 HQs | Revenue |
|---|---|---|
| Financial Services | 10 | $950B |
|
||
| Consumer Goods | 9 | $162B |
|
||
| Insurance | 4 | $225B |
|
||
| Telecommunications | 2 | $144B |
|
||
| Pharmaceuticals | 2 | $112B |
|
||
| Media / Entertainment | 2 | $69B |
|
||
Price history
+18.0% since first listed4 events — show timeline
- 2026-06-12 Relisted — CNYIS
- 2026-06-08 Pending — CNYIS
- 2026-05-12 Listed $45,900 CNYIS
- 2015-05-19 Listed $38,900 UNYREIS
Property tax history
-1.7%/yrLatest (2025): $1,747 · +0.6% YoY. Source: county tax records.
Cash-flow waterfall
monthlySold comps — $/sqft
last 12 mo · ≤1 miLoading sold comps…