 🏷️ Likely Rental
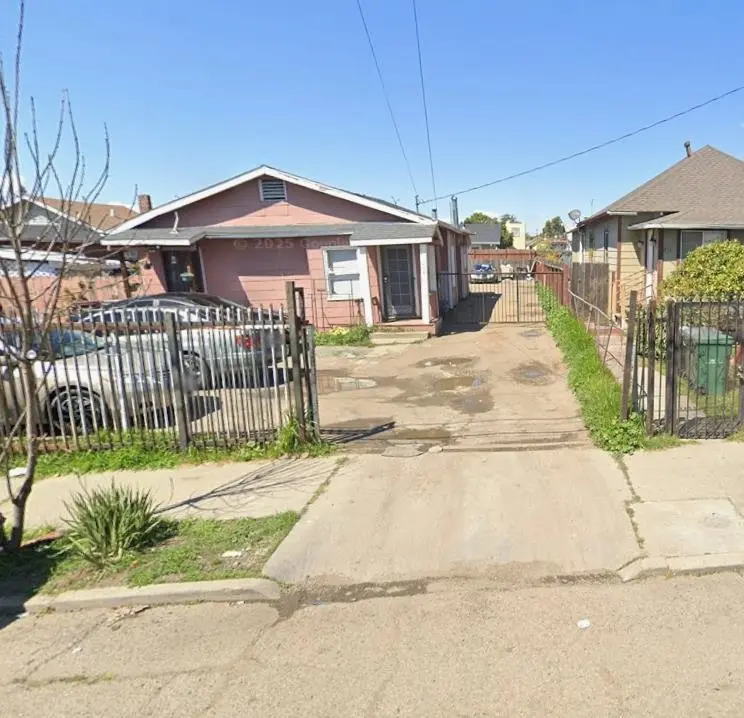
1467 74th Ave · Oakland, CA
Flood risk 1/10 · Minimal
- FEMA flood zone
- X (unshaded)
- Chance of flooding over 30 yrs
- 0.0%
- Est. flood insurance / yr
- $507 – $1,088
Fire risk 1/10 · Minimal
- Est. fire insurance / yr
- $659 – $1,223
Heat risk 4/10 · Minor
- Hot days now (above 83°F)
- 7 days/yr
- Hot days in 30 yrs
- 15 days/yr
Wind risk 1/10 · Minimal
- Chance of severe wind over 30 yrs
- —
Air-quality risk 8/10 · Major
- Unhealthy air days now
- 14 days/yr
- Unhealthy air days in 30 yrs
- 14 days/yr
Risk factors via First Street. Map © Google.
Why this score? — see what drove the B+ grade
The composite is a weighted blend of 9 inputs, each scored 0–100. Each bar is that input's sub-score; the figure is the points it added to the 100-point composite (weight × sub-score).
- Cash flow +30.0/30.0
- ARV discount +15.0/15.0
- 1% rule +10.0/10.0
- DSCR +10.0/10.0
- Rent growth +4.1/5.0
- Livability +3.6/5.0
- Schools +3.0/10.0
- Condition / age +2.5/5.0
- Appreciation +0.0/10.0
$500,000
🖨 Deal sheet 📄 Offer letter ✓ Due diligence
Multi-family units
County records classify this as Multi-Family (5+ Unit). Listing-text estimate: 1 unit. estimate disagrees with records
5+ unit building — per-unit beds/baths from public records are typically unavailable; the breakdown below (if shown) is an estimate from the listing text.
Listing remarks MLS
1467 74th Avenue offers a strategic opportunity to acquire a four-unit multifamily property with steady rental demand. Built in 1924, the property includes two 2 bedroom units, 2 one bedroom unit and one studio unit totaling approximately 3,121 square feet and is positioned on a generous 10,700-square-foot lot. Off-street parking enhances tenant appeal and operational flexibility. Located in a transit-connected Oakland location near Coliseum BART and the 880 corridor, the property presents easy access for commuting.
Key facts
- Two units are vacant
- Off street parking
- 0.25 acre lot
Tags
Neighborhood map
What this means for you Summary
Snapshot
- This is a 7-bed/7.0-bath multifamily listed at $500k.
Deal economics
- At list price, monthly cash flow is $3k ($39k/yr) — positive.
- The deal already cash-flows at list — no discount required.
- Meets the 1% rule at list price ($9k rent vs $500k).
- Recommended offer: $440k (12.0% below list) — sets the bar for market timing.
- Cap rate 14.1% vs local median 2.4% in Oakland — top-decile yield for the area; either an underpriced asset or a hidden risk that comps aren't pricing in. Stress-test before assuming the spread holds.
Location & tenants
- Location reads 71/100 on livability (#224 in CA) — a middle-class / working-renter tenant base. Strengths: amenities A+, commute A+, employment A+; Watch: schools C-, crime F, cost of living F.
- Oakland Unified (urban): math 27% / reading 33% proficiency, ranked #1,007 of 1,400 in CA (top 72%) — families likely to look elsewhere, expect single-tenant / working-renter base with shorter leases; 68% free/reduced lunch — lower-income household profile, screen leases tightly.
- Market conditions: Rents rising fast (+6.5%/yr); 83 active listings in the ZIP; 1,742 units permitted in Alameda County in 2024 (856 in 5+ unit buildings).
- At $8,712/mo this rent would consume 201% of the median local household income ($52k/yr) (locally 2404% of renters already pay >50% of income on rent) — very limited rent-growth headroom before tenants either downsize or default.
Forward outlook
- Local home prices are declining (-3.0%/yr); year-one equity from $3k of loan paydown is wiped out by about $15k of value loss. Plan a longer hold.
- Alameda County population projected at +34% by 2050 — long-run rental-demand tailwind backs the buy-and-hold thesis.
- At projected returns (-3.0% appreciation + 6.5% rent growth), your $140k cash investment doubles in ~4 years — after that, you're playing with house money.
Negotiation context
- It's been on market 139 days — a 12% lower offer ($440k) is reasonable based on typical stale-listing flexibility.
- 4 sale attempts since 18y ago with the ask held roughly flat each time — persistent listings suggest the price (not the market) is what's stuck; bring a comps-based counter.
- Current owner paid $170k; list at $500k implies a 194% gain — meaningful room to come down on a strong offer.
Risks & watch-outs
- Watch-outs: built in 1924 — expect roof / HVAC / electrical / plumbing capex.
Questions for the listing agent
- It's been on market 139 days. Have you received any prior offers? Is the seller open to a 12% concession, seller financing, or rate buy-down credit?
- Built in 1924 — when were the roof, HVAC, electrical panel, plumbing, and water heater last replaced?
- Why hasn't it sold? Are there any deal-killer items the seller is aware of (foundation, flood, title, zoning, code violations)?
- Is there a deadline driving the sale (1031 exchange, divorce, estate, relocation)? That informs how much negotiation room exists.
- Crime grade is F in this area — have there been break-ins, vandalism, or insurance claims at this property in the last 3 years? What carrier currently insures it and at what premium?
- What's the average days-on-market for RENTAL listings here right now (not sales)? A rising rental-DOM trend means longer vacancies and softer asking-rent achievability than the comps imply.
- What's the recent tenant-quality profile in this submarket — average credit score on applications, eviction rate, late-payment / NSF rate, and stable-employment percentage? A property-management company in the area should have these aggregated.
- How much new apartment / multifamily construction is in the pipeline within 1–3 miles? Heavy new supply (>2% of stock underway) typically softens rents 12–24 months out; light construction supports rent growth.
Investment metrics
- 1% rule
- 1.74% ✓
- Cap rate
- 14.06%
- Cash-on-cash
- 27.72%
- DSCR
- 2.23
- GRM
- 4.8
CMA / ARV
- ARV (median comp)
- $728,285
- List price
- $500,000
- Delta
- -31.35%
- Verdict
- UNDERPRICED
- Comps
- 20 within 1.0 mi
Show comp detail 3 sales within ~0.75 mi
| Address | Dist | Beds/Ba | Sqft | Sold | Price | $/sf | Match |
|---|---|---|---|---|---|---|---|
| 1920 69th Ave | 0.29mi | 6/4.0 (-1) | 3,276 (+5%) | 4mo | $728,125 | $222 | 58 |
| 1749 84th Ave | 0.66mi | 8/4.0 (+1) | 3,456 (+11%) | 8mo | $870,000 | $252 | 28 |
| 934 70th Ave | 0.60mi | 7/4.0 | 2,700 (-14%) | 17mo | $690,000 | $256 | 24 |
Match score weights: distance 35% · size 25% · config 20% · recency 20%. Top-matched comps best support the ARV.
Projected returns pro-forma
-3.0% appreciation · 6.45% rent growth · sell at horizon
- IRR
- 25.8%
- Equity multiple
- 2.12×
- Total profit
- $156,509
- Equity at exit
- $74,552
- IRR
- 35.6%
- Equity multiple
- 4.86×
- Total profit
- $540,386
- Equity at exit
- $43,231
Cash invested: $140,000 (down + closing). Projections, not guarantees.
Landlord ↔ Tenant lean methodology
- Overall (CITY)
- 0 Strongly Tenant-Friendly
- State California
- 18 Strongly Tenant-Friendly · D+13
- County
- — inherits STATE
- City Oakland
- 0 Strongly Tenant-Friendly · D+62
ZIP-level market 94621
- Rents YoY
- 6.5%
- Active inventory
- 83
- Price-to-rent
- 18.6×
Monthly cashflow live
- Estimated rent
- $8,712 high interval (Pro) →
- Mortgage (P&I)
- −$2,622
- Tax from tax record
- −$818 /mo · $9,814/yr
- Insurance
- −$208
- HOA
- −$0
- Vacancy / Maint / Mgmt
- −$1,830
- Net cashflow
- $3,234
Break-even live
4-unit breakdown (identical units grouped — click to expand)
| Units | Beds | Baths | Est. rent |
|---|---|---|---|
| 2× units | 2 | 1 | $4,476 |
| #1 | 2 | 1 | $2,238 |
| #2 | 2 | 1 | $2,238 |
| 2× units | 1 | 1 | $4,236 |
| #3 | 1 | 1 | $2,118 |
| #4 | 1 | 1 | $2,118 |
| Total (4 units) | $8,712 | ||
UW: 25.0% down · 7.5% · 30yr · 1.5% tax · 5.0% vac · 8.0% maint · 8.0% mgmt
Financing live
Cash to close
- Down payment
- $125,000
- Closing costs
- $15,000
- Reserves months
- —
- Total cash needed
- —
Loan-product check · same deal, 3 products live
Conventional
25% down · 7.5% · 30yr
- Down + closing
- —
- Monthly P&I
- —
- Monthly cashflow
- —
- DSCR
- —
- Eligible?
- —
Personal DTI + credit; lowest rate.
DSCR
20% down · 8.5% · 30yr
- Down + closing
- —
- Monthly P&I
- —
- Monthly cashflow
- —
- DSCR
- —
- Eligible?
- —
No personal income docs; deal must DSCR.
Hard money
10% down · 12.0% · 12mo
- Down + closing
- —
- Monthly P&I
- —
- Monthly cashflow
- —
- DSCR
- —
- Eligible?
- —
Short-term bridge; refi at stabilization.
Listing history 24 events
-
2026-06-18days on market $500,000 Active 139 DOM
-
2026-06-17days on market $500,000 Active 138 DOM
-
2026-06-16days on market $500,000 Active 137 DOM
-
2026-06-15days on market $500,000 Active 136 DOM
-
2026-06-13days on market $500,000 Active 134 DOM
-
2026-06-13days on market $500,000 Active 133 DOM
-
2026-06-09days on market $500,000 Active 130 DOM
-
2026-06-08days on market $500,000 Active 129 DOM
-
2026-06-07days on market $500,000 Active 128 DOM
-
2026-06-04days on market $500,000 Active 125 DOM
-
2026-06-03days on market $500,000 Active 124 DOM
-
2026-06-02days on market $500,000 Active 123 DOM
-
2026-06-01days on market $500,000 Active 122 DOM
-
2026-05-31days on market $500,000 Active 121 DOM
-
2026-04-20status Active 521-char remark
Show marketing remark (521 chars)
1467 74th Avenue offers a strategic opportunity to acquire a four-unit multifamily property with steady rental demand. Built in 1924, the property includes two 2 bedroom units, 2 one bedroom unit and one studio unit totaling approximately 3,121 square feet and is positioned on a generous 10,700-square-foot lot. Off-street parking enhances tenant appeal and operational flexibility. Located in a transit-connected Oakland location near Coliseum BART and the 880 corridor, the property presents easy access for commuting.
-
2026-04-14status Pending 521-char remark
Show marketing remark (521 chars)
1467 74th Avenue offers a strategic opportunity to acquire a four-unit multifamily property with steady rental demand. Built in 1924, the property includes two 2 bedroom units, 2 one bedroom unit and one studio unit totaling approximately 3,121 square feet and is positioned on a generous 10,700-square-foot lot. Off-street parking enhances tenant appeal and operational flexibility. Located in a transit-connected Oakland location near Coliseum BART and the 880 corridor, the property presents easy access for commuting.
-
2026-04-03status Active 521-char remark
Show marketing remark (521 chars)
1467 74th Avenue offers a strategic opportunity to acquire a four-unit multifamily property with steady rental demand. Built in 1924, the property includes two 2 bedroom units, 2 one bedroom unit and one studio unit totaling approximately 3,121 square feet and is positioned on a generous 10,700-square-foot lot. Off-street parking enhances tenant appeal and operational flexibility. Located in a transit-connected Oakland location near Coliseum BART and the 880 corridor, the property presents easy access for commuting.
-
2026-03-23status Pending 521-char remark
Show marketing remark (521 chars)
1467 74th Avenue offers a strategic opportunity to acquire a four-unit multifamily property with steady rental demand. Built in 1924, the property includes two 2 bedroom units, 2 one bedroom unit and one studio unit totaling approximately 3,121 square feet and is positioned on a generous 10,700-square-foot lot. Off-street parking enhances tenant appeal and operational flexibility. Located in a transit-connected Oakland location near Coliseum BART and the 880 corridor, the property presents easy access for commuting.
-
2026-01-13$500,000 Active 521-char remark
Show marketing remark (521 chars)
1467 74th Avenue offers a strategic opportunity to acquire a four-unit multifamily property with steady rental demand. Built in 1924, the property includes two 2 bedroom units, 2 one bedroom unit and one studio unit totaling approximately 3,121 square feet and is positioned on a generous 10,700-square-foot lot. Off-street parking enhances tenant appeal and operational flexibility. Located in a transit-connected Oakland location near Coliseum BART and the 880 corridor, the property presents easy access for commuting.
-
2008-12-22soldstatus $170,000 147-char remark
Show marketing remark (147 chars)
4 units on Large Lot; 10,700 sqft. 3 units need large amount of renovation. 1 in decent shape. Seller will consider financing to qualified buyer.
-
2008-11-20soldstatus $170,000
-
2008-09-22historical 147-char remark
Show marketing remark (147 chars)
4 units on Large Lot; 10,700 sqft. 3 units need large amount of renovation. 1 in decent shape. Seller will consider financing to qualified buyer.
-
2008-09-08$199,500 147-char remark
Show marketing remark (147 chars)
4 units on Large Lot; 10,700 sqft. 3 units need large amount of renovation. 1 in decent shape. Seller will consider financing to qualified buyer.
-
1995-11-22soldstatus $93,500
ⓘ Source: listings_history table (triggers on properties + properties_extension) + one-shot
backfill from property_details.listing_events for pre-trigger history.
Tax reassessment forecast CA · Resets to sale price
- Current annual tax
- $9,814 · $818/mo
- Projected year-2 tax
- $9,814 · $818/mo
- Expected delta
- $0/yr ($0/mo · 0.0%)
ⓘ Screening estimate from a state-policy table — verify with the county assessor before closing.
Climate risk First Street
- Flood 1/10 Low FEMA zone X (unshaded) · 0% chance over 30 yrs
- Wildfire 1/10 Low
- Heat 4/10 Moderate 7 d/yr ≥83°F today · 15 d/yr by 30 yrs out
- Wind 1/10 Low
- Air quality 8/10 Severe 14 unhealthy d/yr today · 14 by 30 yrs out
Nearby sold comps map
Loading sold comps map…
Walkable amenities ~0.75 mi
Loading nearby amenities…
Taxation est. · year 1
- Rental income
- $104,544
- − Mortgage interest
- −$28,008
- − Property taxes
- −$9,814
- − Insurance
- −$2,500
- − Repairs & maintenance
- −$8,364
- − Management
- −$8,364
- − Depreciation
- −$14,545
- Taxable income
- $32,950
- Est. tax owed @ 24.0%
- −$7,908
- After-tax cash flow
- $30,903/yr
For passive investors: Depreciation is non-cash, so a rental often shows a tax loss while cash-flowing — sheltering income. Rental losses are passive: they offset passive income freely, and up to $25,000/yr can offset ordinary (W-2) income if you actively participate and your MAGI is under $100k (phasing out to $0 by $150k); unused losses carry forward. On sale, claimed depreciation is recaptured at up to 25%, and gains may owe capital-gains tax (a 1031 exchange can defer both). Figures are a year-1 estimate at your 24.0% rate — not tax advice; consult a CPA.
Schools (NCES district)
- District
- Oakland Unified
- NCES district ID
- 0628050
- Math proficiency
- 27% ▬ 0.00%
- Reading proficiency
- 33% ▬ 0.00%
- Median HH income
- $55,194
- Composite
- 29.52/100
- National rank
- #11769
- State rank
- #1007 of 1400 in CA
Livability — Oakland
- Score
- 71/100
- State rank
- #224
- US rank
- #7245
Category grades
Schools grade is shown separately in the Schools card above.
Census & demographics
- Census place
- Oakland, CA
- County
- Alameda County · 1,614,355 people
- City population
- 385,993
- Metro
- San Francisco-Oakland-Berkeley, CA
- Population (ZIP)
- 33,840
- Household income
- $52,049
- Rent vs Own
- Severe rent burden
- 2404.0
Population outlook (Alameda County) Hauer SSP2
- Today (2025)
- 1,928,884 people
- By 2030
- 2,069,146 · +7.3%
- By 2040
- 2,338,405 · +21.2%
- By 2050
- 2,586,608 · +34.1%
- By 2075
- 3,061,911 · +58.7%
- By 2100
- 3,234,133 · +67.7%
Race, ethnicity, and origin ACS 2023
- Neighborhood character
- Majority Hispanic (63%)
- Race & ethnicity
- Hispanic / Latino 63% Black 24% Two or more races 14% White 6% Asian 4% Native American 2%
- Hispanic origin (detail)
- Mexican 41%
- Common ancestry
- Italian 1%
- Foreign-born
- 35% · Canada, China, Vietnam
- Languages at home
- 40% English-only · Spanish 53% Arabic 2% Other Asian/Pacific 2%
Political lean MEDSL · Alameda
- 2024 margin
- Solid D (+53.6) · D 74.6% · R 21.0% · Other 4.4%
- 2008→2024 swing
- -5.9pp toward R · 2008: 59.5pp · 2024: 53.6pp
- All cycles
- 2024: D+53.6 2020: D+62.5 2016: D+64.4 2012: D+59.8 2008: D+59.5
Not yet ingested
- Civics
- —
Market trends
- HPI YoY
- ▼ -346.43%
- Current HPI
- 523.2253
- Rent YoY
- ▲ 6.45%
- Metro
- San Francisco-Oakland-Berkeley, CA
- State GDP YoY
- ▲ 3.21%
- F500 in state
- 116
Industry mix (Fortune 500 HQ in CA)
| Industry | F500 HQs | Revenue |
|---|---|---|
| Technology | 27 | $1,492B |
|
||
| Financial Services | 3 | $174B |
|
||
| Retail | 3 | $44B |
|
||
| Insurance | 3 | $26B |
|
||
| Media / Entertainment | 2 | $115B |
|
||
| Pharmaceuticals / Biotech | 2 | $62B |
|
||
Price history
+434.8% since first listed10 events — show timeline
- 2026-04-20 Relisted — bridgeMLS, Bay East AOR, or Contra Costa AOR
- 2026-04-14 Pending — bridgeMLS, Bay East AOR, or Contra Costa AOR
- 2026-04-03 Relisted — bridgeMLS, Bay East AOR, or Contra Costa AOR
- 2026-03-23 Pending — bridgeMLS, Bay East AOR, or Contra Costa AOR
- 2026-01-13 Listed $500,000 bridgeMLS, Bay East AOR, or Contra Costa AOR
- 2008-12-22 Sold (MLS) $170,000 bridgeMLS, Bay East AOR, or Contra Costa AOR
- 2008-11-20 Sold (Public Records) $170,000 Public Records
- 2008-09-22 Listing Removed — bridgeMLS, Bay East AOR, or Contra Costa AOR
- 2008-09-08 Listed $199,500 bridgeMLS, Bay East AOR, or Contra Costa AOR
- 1995-11-22 Sold (Public Records) $93,500 Public Records
Property tax history
-3.4%/yrLatest (2025): $9,814 · +6.7% YoY. Source: county tax records.
Cash-flow waterfall
monthlySold comps — $/sqft
last 12 mo · ≤1 miLoading sold comps…