629 Canterbury Dr Dr · Augusta-Richmond County consolidated government (balance), GA
Flood risk 1/10 · Minimal
- FEMA flood zone
- X (unshaded)
- Chance of flooding over 30 yrs
- 0.0%
- Est. flood insurance / yr
- $507 – $1,088
Fire risk 1/10 · Minimal
- Est. fire insurance / yr
- $963 – $1,789
Heat risk 7/10 · Major
- Hot days now (above 106°F)
- 7 days/yr
- Hot days in 30 yrs
- 16 days/yr
Wind risk 6/10 · Moderate
- Chance of severe wind over 30 yrs
- 67.0%
Air-quality risk 3/10 · Minor
- Unhealthy air days now
- 3 days/yr
- Unhealthy air days in 30 yrs
- 3 days/yr
Risk factors via First Street. Map © Google.
Why this score? — see what drove the D- grade
The composite is a weighted blend of 9 inputs, each scored 0–100. Each bar is that input's sub-score; the figure is the points it added to the 100-point composite (weight × sub-score).
- Cash flow +12.3/30.0
- ARV discount +8.4/15.0
- DSCR +3.6/10.0
- 1% rule +3.1/10.0
- Rent growth +2.6/5.0
- Livability +2.5/5.0
- Condition / age +2.5/5.0
- Schools +1.3/10.0
- Appreciation +0.0/10.0
$349,900
🖨 Deal sheet 📄 Offer letter ✓ Due diligence
Listing remarks
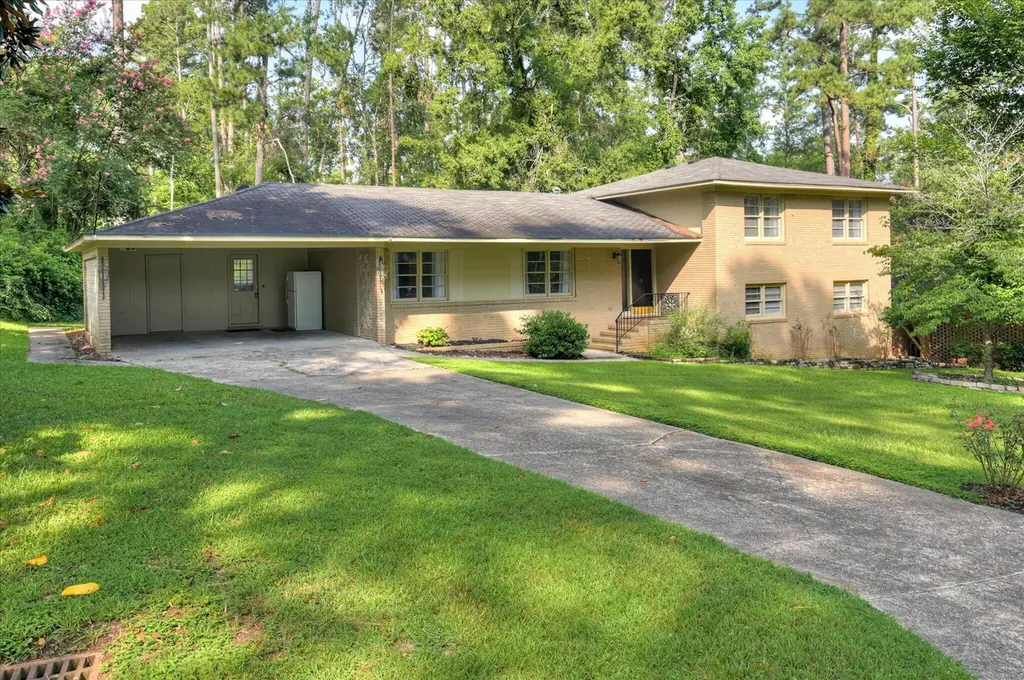
LARGE 5 BEDROOM , THREE FULL BATH HOME WITH FORMAL DINING ROOM, FORMAL LIVING ROOM, TWO LARGE GREAT ROOMS, AND A BREAKFAST ROOM!! KITCHEN HAS DOUBLE OVEN, A FRIDGE AND A COFFEBAR!! MAIN LEVEL GREAT ROOM HAS FLOOR TO CEILING SHELVING, TWO CEILING FANS, HARDWOOD FLOORING, AND SLIDING GLASS DOOR LEADING OUTSIDE!! FORMAL DINING ROOM AND LIVING ROOM HAVE LOTS OF WINDOWS AND HARDWOOD FLOORS!! DOWNSTAIRS GREAT ROOM HAS WOOD BURNING FIREPLACE AND DOOR LEADING OUTSIDE!! TWO MORE BEDROOMS AND FULL BATH DOWNSTAIRS!! UPSTAIRS HAVE THREE LARGE BEDROOMS AND TWO MORE BATHS AND ALL ROOMS HAVE HARDWOOD FLOORS!! INSIDE HAS BEEN PROFESIONALLY PAINTED RECENTLY!!! NO HOA!! HOME SITS ON OVER 1/3 ACRE!
Key facts
- Formal dining room
- Coffeebar
- Breakfast room
Tags
Property features AI
Finance
- HOA & community: Street lights in the community; Subdivision: Brynwood
Exterior
- Parking: Attached garage; Carport with 2 spaces; Concrete parking surface
- Utilities: Public water; Septic tank sewer; Cable available
- Home design: Single family residence; Residential property; Three or more levels
- Construction: Brick and wood siding construction; Composition roof; Crawl space foundation
- Exterior features: Patio; Front porch; Fenced yard; Landscaped lot; Lot dimensions roughly 105 x 155 x 90 x 172
Interior
- Kitchen: Refrigerator; Double oven; Dishwasher; Cooktop
- Flooring: Laminate; Ceramic tile; Hardwood
- Bathrooms: Three full bathrooms
- Heating & cooling: Heat pump; Fireplace(s); Central air; Ceiling fan(s)
- Interior features: Entrance foyer; Pantry; Eat-in kitchen; In-law floorplan
- Laundry & utility: Washer hookup; Electric water heater
Neighborhood map
What this means for you Summary
Snapshot
- This is a 5-bed/3.0-bath single-family listed at $350k.
Deal economics
- At list price, monthly cash flow is $-66 ($-793/yr) — negative.
- To cash-flow at today's rent, offer at most $338k (3.3% below list).
- To meet the 1% rule (rent ≥ 1% of price), the offer needs to be $285k (18.6% below list).
- Recommended offer: $285k (18.6% below list) — sets the bar for 1% rule.
Location & tenants
- Location reads: area grade D — affects rentability + tenant quality, not the cash-flow math above.
- Richmond County (urban): math 12% / reading 20% proficiency, ranked #154 of 174 in GA (top 88%) — low school quality limits family demand, transient renter base, plan for 1-2y turnover; 72% free/reduced lunch — lower-income household profile, screen leases tightly.
- Zoned schools: Tutt Middle School (math 7% / reading 21%, grade F, #405 of 470 statewide, top 86%, 476 students, 98% FRL); Westside High School (math 2% / reading 12%, grade F, #385 of 424 statewide, top 92%, 999 students, 98% FRL) — zoned schools average 98% FRL vs 72% district-wide (26 pts higher); higher-poverty schools than district average — tighter screening recommended.
- Market conditions: Rents flat; 303 active listings in the ZIP; 9 comparable units currently listed for rent nearby; rentals lingering (median 44d on market — plan ~5-8 weeks vacancy on turnover, expect pricing pressure); 67% of comp listings sitting > 30 days — soft ceiling on asking rent; 561 units permitted in Richmond County in 2024 (0 in 5+ unit buildings).
- At $2,847/mo this rent would consume 48% of the median local household income ($71k/yr) (locally 2113% of renters already pay >50% of income on rent) — very limited rent-growth headroom before tenants either downsize or default.
Forward outlook
- Local home prices are declining (-3.0%/yr); year-one equity from $2k of loan paydown is wiped out by about $10k of value loss. Plan a longer hold.
- Richmond County population projected to shrink 5% by 2050 — rents likely to lag national; underwrite the cash flow, not the appreciation.
Negotiation context
- It's been on market 38 days — a 3% lower offer ($339k) is reasonable based on typical stale-listing flexibility.
- 7 sale attempts since 5y ago with the ask held roughly flat each time — persistent listings suggest the price (not the market) is what's stuck; bring a comps-based counter.
Risks & watch-outs
- Climate carrying-cost: major wind risk, 67% chance of damaging wind over 30y; extreme-heat days projected 7→16/yr by 2055 (HVAC capex compounding) — expect insurance premiums to compound above CPI over the hold.
Questions for the listing agent
- What do current leases actually rent for vs. the listed asking? Can we see a recent rent roll and the last 12 months of T-12 income?
- It's been on market 38 days. Have you received any prior offers? Is the seller open to a 19% concession, seller financing, or rate buy-down credit?
- Built in 1964 — when were the roof, HVAC, electrical panel, plumbing, and water heater last replaced?
- Is there a deadline driving the sale (1031 exchange, divorce, estate, relocation)? That informs how much negotiation room exists.
- The area grade is low — what's the realistic commute time and amenity access for the typical tenant pool here? Any planned neighborhood developments (good or bad) we should know about?
- What's the average days-on-market for RENTAL listings here right now (not sales)? A rising rental-DOM trend means longer vacancies and softer asking-rent achievability than the comps imply.
- What's the recent tenant-quality profile in this submarket — average credit score on applications, eviction rate, late-payment / NSF rate, and stable-employment percentage? A property-management company in the area should have these aggregated.
- How much new for-sale + rental construction is in the pipeline within 1–3 miles? Heavy new supply typically softens prices + rents 12–24 months out; constrained supply supports both.
Investment metrics
- 1% rule
- 0.81% ✗
- Cap rate
- 6.07%
- Cash-on-cash
- -0.81%
- DSCR
- 0.96
- GRM
- 10.2
CMA / ARV
- ARV (median comp)
- $356,905
- List price
- $349,900
- Delta
- -1.96%
- Verdict
- FAIR
- Comps
- 20 within 1.0 mi
Show comp detail 12 sales within ~0.75 mi
| Address | Dist | Beds/Ba | Sqft | Sold | Price | $/sf | Match |
|---|---|---|---|---|---|---|---|
| 513 Winchester Dr | 0.34mi | 5/3.0 | 2,462 (-9%) | 1mo | $425,000 | $173 | 69 |
| 3215 Ramsgate Rd | 0.35mi | 4/3.0 (-1) | 2,668 (-1%) | 12mo | $480,000 | $180 | 67 |
| 521 Winchester Dr | 0.26mi | 4/3.0 (-1) | 2,860 (+6%) | 12mo | $579,900 | $203 | 63 |
| 3209 Ramsgate Rd | 0.32mi | 4/2.5 (-1) | 2,879 (+7%) | 10mo | $230,000 | $80 | 59 |
| 605 Regent Rd | 0.52mi | 4/3.0 (-1) | 2,846 (+5%) | 4mo | $350,000 | $123 | 58 |
| 3129 Ramsgate Rd | 0.22mi | 4/2.0 (-1) | 2,385 (-12%) | 4mo | $345,000 | $145 | 58 |
| 3247 Ramsgate Rd | 0.61mi | 4/4.0 (-1) | 2,666 (-1%) | 9mo | $310,000 | $116 | 54 |
| 642 Canterbury Dr | 0.20mi | 4/2.0 (-1) | 2,375 (-12%) | 12mo | $374,000 | $157 | 52 |
| 427 Scotts Way | 0.74mi | 4/2.5 (-1) | 2,600 (-4%) | 1mo | $541,000 | $208 | 52 |
| 508 Scotts Way | 0.45mi | 4/3.5 (-1) | 3,100 (+15%) | 11mo | $591,000 | $191 | 38 |
| 3344 Wheeler Rd | 0.65mi | 4/3.5 (-1) | 3,047 (+13%) | 6mo | $475,000 | $156 | 36 |
| 407 Dorchester Dr | 0.60mi | 4/2.5 (-1) | 2,351 (-13%) | 10mo | $380,000 | $162 | 35 |
Match score weights: distance 35% · size 25% · config 20% · recency 20%. Top-matched comps best support the ARV.
Projected returns pro-forma
-3.0% appreciation · 0.48% rent growth · sell at horizon
- IRR
- -20.4%
- Equity multiple
- 0.31×
- Total profit
- $-67,969
- Equity at exit
- $52,171
- IRR
- -20.0%
- Equity multiple
- 0.06×
- Total profit
- $-92,160
- Equity at exit
- $30,253
Cash invested: $97,972 (down + closing). Projections, not guarantees.
Landlord ↔ Tenant lean methodology
- Overall (STATE)
- 90 Strongly Landlord-Friendly
- State Georgia
- 90 Strongly Landlord-Friendly · R+3
- County
- — inherits STATE
- City
- — inherits STATE
ZIP-level market 30909
- Home prices YoY
- -32.2%
- Rents YoY
- 0.5%
- Active inventory
- 303
- Price-to-rent
- 10.2×
Monthly cashflow live
- Estimated rent
- $2,847 high interval (Pro) →
- Mortgage (P&I)
- −$1,835
- Tax from tax record
- −$335 /mo · $4,016/yr
- Insurance
- −$146
- HOA
- −$0
- Vacancy / Maint / Mgmt
- −$598
- Net cashflow
- $-66
Break-even live
UW: 25.0% down · 7.5% · 30yr · 1.5% tax · 5.0% vac · 8.0% maint · 8.0% mgmt
Financing live
Cash to close
- Down payment
- $87,475
- Closing costs
- $10,497
- Reserves months
- —
- Total cash needed
- —
Loan-product check · same deal, 3 products live
Conventional
25% down · 7.5% · 30yr
- Down + closing
- —
- Monthly P&I
- —
- Monthly cashflow
- —
- DSCR
- —
- Eligible?
- —
Personal DTI + credit; lowest rate.
DSCR
20% down · 8.5% · 30yr
- Down + closing
- —
- Monthly P&I
- —
- Monthly cashflow
- —
- DSCR
- —
- Eligible?
- —
No personal income docs; deal must DSCR.
Hard money
10% down · 12.0% · 12mo
- Down + closing
- —
- Monthly P&I
- —
- Monthly cashflow
- —
- DSCR
- —
- Eligible?
- —
Short-term bridge; refi at stabilization.
Rent comps 9 comps
| Address | Beds | Baths | Sqft | Rent | $/sqft | DOM | Units | Dist |
|---|---|---|---|---|---|---|---|---|
| 407 Sheffield Cir Augusta, GA | 5.0 | 3.0 | 3236 | $4,300 | $1.33 | 43d | 1 | 0.39mi |
| 403 Aumond Rd Augusta, GA | 4.0 | 2.0 | 1774 | $2,200 | $1.24 | 43d | 1 | 0.81mi |
| 315 Indian Trl Augusta, GA | 4.0 | 2.0 | 2188 | $1,850 | $0.85 | 23d | 1 | 1.02mi |
| 311 Gardners Mill Ct Augusta, GA | 4.0 | 2.0 | 2078 | $2,150 | $1.03 | 43d | 1 | 1.09mi |
| 226 Thread Needle Rd E Augusta, GA | 5.0 | 3.0 | 2335 | $3,750 | $1.61 | 43d | 1 | 1.11mi |
| 8 Conifer Sq Augusta, GA | 4.0 | 2.5 | 2585 | $3,200 | $1.24 | 23d | 1 | 1.22mi |
| 3218 Winding Wood Pl Augusta, GA | 4.0 | 3.0 | 2040 | $3,500 | $1.72 | 43d | 1 | 1.24mi |
| 646 Center Court Dr Augusta, GA | 4.0 | 3.0 | 1809 | $1,800 | $1.00 | 43d | 1 | 1.46mi |
| 646 Center Court Dr Augusta, GA | 4.0 | 3.0 | 1809 | $1,800 | $1.00 | 23d | 1 | 1.46mi |
Listing history 29 events
-
2026-06-18days on market $349,900 Active 38 DOM
-
2026-06-17days on market $349,900 Active 37 DOM
-
2026-06-16days on market $349,900 Active 36 DOM
-
2026-06-15days on market $349,900 Active 35 DOM
-
2026-06-14days on market $349,900 Active 33 DOM
-
2026-06-10days on market $349,900 Active 30 DOM
-
2026-06-09days on market $349,900 Active 29 DOM
-
2026-06-08days on market $349,900 Active 28 DOM
-
2026-06-07days on market $349,900 Active 27 DOM
-
2026-06-03days on market $349,900 Active 23 DOM
-
2026-06-02days on market $349,900 Active 22 DOM
-
2026-06-01days on market $349,900 Active 21 DOM
-
2026-05-31days on market $349,900 Active 20 DOM
-
2026-05-30days on market $349,900 Active 19 DOM
-
2026-05-11historical
-
2026-03-12price $349,900
-
2025-07-18$375,000 Active
-
2025-07-18$349,900 Active 991-char remark
-
2024-12-02historical
-
2024-12-02historical
-
2024-11-15historical $2,300
-
2024-10-22$2,300
-
2024-08-07$375,000
-
2024-08-07$375,000
-
2021-06-07soldstatus $310,000
-
2021-06-01soldstatus $310,000
-
2021-06-01soldstatus $310,000
-
2021-04-09$310,000
-
2021-04-09$310,000
ⓘ Source: listings_history table (triggers on properties + properties_extension) + one-shot
backfill from property_details.listing_events for pre-trigger history.
Tax reassessment forecast GA · Resets to sale price
- Current annual tax
- $4,016 · $335/mo
- Projected year-2 tax
- $4,016 · $335/mo
- Expected delta
- $0/yr ($0/mo · 0.0%)
ⓘ Screening estimate from a state-policy table — verify with the county assessor before closing.
Climate risk First Street
- Flood 1/10 Low FEMA zone X (unshaded) · 0% chance over 30 yrs
- Wildfire 1/10 Low
- Heat 7/10 Severe 7 d/yr ≥106°F today · 16 d/yr by 30 yrs out
- Wind 6/10 Major 67% chance of damaging wind over 30 yrs
- Air quality 3/10 Moderate 3 unhealthy d/yr today · 3 by 30 yrs out
Nearby sold comps map
Loading sold comps map…
Walkable amenities ~0.75 mi
Loading nearby amenities…
Taxation est. · year 1
- Rental income
- $34,166
- − Mortgage interest
- −$19,600
- − Property taxes
- −$4,016
- − Insurance
- −$1,750
- − Repairs & maintenance
- −$2,733
- − Management
- −$2,733
- − Depreciation
- −$10,179
- Taxable loss
- −$6,844
- Est. tax savings @ 24.0%
- +$1,643
- After-tax cash flow
- $850/yr
For passive investors: Depreciation is non-cash, so a rental often shows a tax loss while cash-flowing — sheltering income. Rental losses are passive: they offset passive income freely, and up to $25,000/yr can offset ordinary (W-2) income if you actively participate and your MAGI is under $100k (phasing out to $0 by $150k); unused losses carry forward. On sale, claimed depreciation is recaptured at up to 25%, and gains may owe capital-gains tax (a 1031 exchange can defer both). Figures are a year-1 estimate at your 24.0% rate — not tax advice; consult a CPA.
Schools (NCES district)
- District
- Richmond County
- NCES district ID
- 1304380
- Math proficiency
- 12% ▼ -9.00%
- Reading proficiency
- 20% ▼ -6.00%
- Median HH income
- $38,069
- Composite
- 13.43/100
- National rank
- #9524
- State rank
- #154 of 174 in GA
Livability — Augusta-Richmond County consolidated government (balance)
No livability data for this city. (Only ~50 U.S. cities are tracked.)
Census & demographics
- Census place
- Augusta-Richmond County consolidated government (balance), GA
- County
- Richmond County · 190,917 people
- City population
- 154,035
- Metro
- Augusta-Richmond County, GA-SC
- Population (ZIP)
- 46,501
- Household income
- $71,364
- Rent vs Own
- Severe rent burden
- 2113.0
Population outlook (Richmond County) Hauer SSP2
- Today (2025)
- 200,753 people
- By 2030
- 200,232 · -0.3%
- By 2040
- 196,813 · -2.0%
- By 2050
- 190,347 · -5.2%
- By 2075
- 172,496 · -14.1%
- By 2100
- 146,284 · -27.1%
Race, ethnicity, and origin ACS 2023
- Neighborhood character
- Diverse neighborhood (Simpson 0.65)
- Race & ethnicity
- Black 44% White 39% Two or more races 9% Hispanic / Latino 6% Asian 3%
- Hispanic origin (detail)
- Mexican 3% Puerto Rican 2%
- Common ancestry
- Slovak 2% Serbian 1% Lithuanian 1%
- Foreign-born
- 6% · Canada, China, South Korea
- Languages at home
- 92% English-only · Spanish 3% Other Indo-European 1% Chinese 1%
Political lean MEDSL · Richmond
- 2024 margin
- Solid D (+36.1) · D 67.8% · R 31.7%
- 2008→2024 swing
- +4.3pp toward D · 2008: 31.8pp · 2024: 36.1pp
- All cycles
- 2024: D+36.1 2020: D+37.2 2016: D+32.4 2012: D+33.8 2008: D+31.8
Not yet ingested
- Civics
- —
Market trends
- HPI YoY
- ▼ -133.14%
- Current HPI
- 280.4587
- Rent YoY
- ▲ 0.48%
- Metro
- Augusta-Richmond County, GA-SC
- State GDP YoY
- ▲ 2.66%
- F500 in state
- 28
Industry mix (Fortune 500 HQ in GA)
| Industry | F500 HQs | Revenue |
|---|---|---|
| Paper / Packaging | 2 | $29B |
|
||
| Retail | 1 | $160B |
|
||
| Transportation / Logistics | 1 | $91B |
|
||
| Airlines | 1 | $62B |
|
||
| Consumer Goods | 1 | $47B |
|
||
| Utilities | 1 | $25B |
|
||
Price history
+12.9% since first listed15 events — show timeline
- 2026-05-11 Listing Removed — Hive MLS
- 2026-03-12 Price Changed $349,900 Hive MLS
- 2025-07-18 Listed $349,900 Hive MLS
- 2025-07-18 Listed $375,000 Hive MLS
- 2024-12-02 Listing Removed — Hive MLS
- 2024-12-02 Listing Removed — Hive MLS
- 2024-11-15 Rental Removed $2,300 AUGUSTAMLS
- 2024-10-22 Listed for Rent $2,300 AUGUSTAMLS
- 2024-08-07 Listed $375,000 Hive MLS
- 2024-08-07 Listed $375,000 Hive MLS
- 2021-06-07 Sold (Public Records) $310,000 Public Records
- 2021-06-01 Sold (MLS) $310,000 Hive MLS
- 2021-06-01 Sold (MLS) $310,000 Hive MLS
- 2021-04-09 Listed $310,000 Hive MLS
- 2021-04-09 Listed $310,000 Hive MLS
Property tax history
+11.0%/yrLatest (2025): $4,016 · +0.2% YoY. Source: county tax records.
Cash-flow waterfall
monthlySold comps — $/sqft
last 12 mo · ≤1 miLoading sold comps…