297 Madison 5270 · St. Paul, AR
Flood risk 1/10 · Minimal
- FEMA flood zone
- X
- Chance of flooding over 30 yrs
- 0.0%
- Est. flood insurance / yr
- $507 – $1,088
Fire risk 5/10 · Moderate
- Est. fire insurance / yr
- $1,499 – $2,785
Heat risk 4/10 · Minor
- Hot days now (above 103°F)
- 7 days/yr
- Hot days in 30 yrs
- 22 days/yr
Wind risk 2/10 · Minimal
- Chance of severe wind over 30 yrs
- 1.0%
Air-quality risk 2/10 · Minimal
- Unhealthy air days now
- 0 days/yr
- Unhealthy air days in 30 yrs
- 1 days/yr
Risk factors via First Street. Map © Google.
Why this score? — see what drove the B+ grade
The composite is a weighted blend of 9 inputs, each scored 0–100. Each bar is that input's sub-score; the figure is the points it added to the 100-point composite (weight × sub-score).
- Cash flow +30.0/30.0
- DSCR +10.0/10.0
- Appreciation +10.0/10.0
- 1% rule +9.9/10.0
- ARV discount +7.5/15.0
- Schools +2.7/10.0
- Rent growth +2.5/5.0
- Livability +2.5/5.0
- Condition / age +2.5/5.0
$99,000
🖨 Deal sheet 📄 Offer letter ✓ Due diligence
Listing remarks
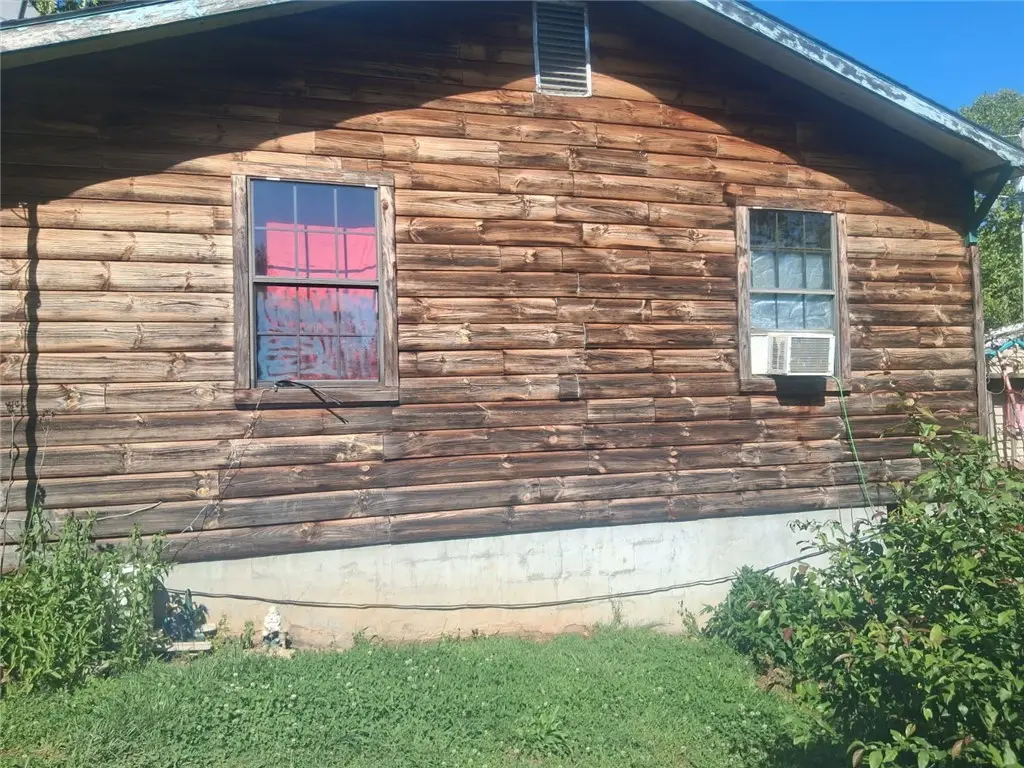
Country home located in the Japton area offering approximately 2,160 square feet of potential. The newer addition is ready for electrical and plumbing installation, providing an excellent opportunity to customize the space to your needs. Features include log construction, log siding accents, a spacious deck, and beautiful scenic views. With some finishing work, this property could truly shine.
Key facts
- Newer addition
- Log construction
- Spacious deck
Tags
Property features AI
Finance
- HOA & community: Monthly association fee; Located near schools
Exterior
- Utilities: Electricity available; Natural gas available; Public water
- Home design: Single-story; Log siding
- Construction: Block foundation; Architectural, metal, and shingle roofing
- Exterior features: Gravel driveway; Deck; Partial fencing; Rural lot; County road frontage
Interior
- Kitchen: Convection oven; Dishwasher; Electric range
- Flooring: Tile; Vinyl; Wood
- Bathrooms: 1 full bathroom; 2 half bathrooms
- Heating & cooling: Space heater; Wood stove
- Interior features: Cathedral ceilings; None specified
- Laundry & utility: Electric water heater
Neighborhood map
What this means for you Summary
Snapshot
- This is a 3-bed/1.0-bath single-family listed at $99k.
Deal economics
- At list price, monthly cash flow is $485 ($6k/yr) — positive.
- The deal already cash-flows at list — no discount required.
- Meets the 1% rule at list price ($1k rent vs $99k).
- Recommended offer: $96k (3.0% below list) — sets the bar for market timing.
Location & tenants
- Location reads: area grade B — affects rentability + tenant quality, not the cash-flow math above.
- Huntsville School District (rural): math 35% / reading 29% proficiency, ranked #141 of 238 in AR (top 59%) — families likely to look elsewhere, expect single-tenant / working-renter base with shorter leases.
- Market conditions: 129 active listings in the ZIP; 29 units permitted in Madison County in 2024 (0 in 5+ unit buildings).
Forward outlook
- In year one you build about $11k of equity ($684 loan paydown + $10k appreciation (10.0% local appreciation)).
- Madison County population projected to shrink 9% by 2050 — rents likely to lag national; underwrite the cash flow, not the appreciation.
- At projected returns (10.0% appreciation + 3.0% rent growth), your $28k cash investment doubles in ~2 years — after that, you're playing with house money.
- By year 4, paydown + projected appreciation supports a ~$38k cash-out refi (75% LTV) — recoverable capital for the next deal without selling this one.
Negotiation context
- It's been on market 31 days — a 3% lower offer ($96k) is reasonable based on typical stale-listing flexibility.
Risks & watch-outs
- Climate carrying-cost: moderate wildfire risk — expect insurance premiums to compound above CPI over the hold.
Questions for the listing agent
- It's been on market 31 days. Have you received any prior offers? Is the seller open to a 3% concession, seller financing, or rate buy-down credit?
- Is there a deadline driving the sale (1031 exchange, divorce, estate, relocation)? That informs how much negotiation room exists.
- What's the average days-on-market for RENTAL listings here right now (not sales)? A rising rental-DOM trend means longer vacancies and softer asking-rent achievability than the comps imply.
- What's the recent tenant-quality profile in this submarket — average credit score on applications, eviction rate, late-payment / NSF rate, and stable-employment percentage? A property-management company in the area should have these aggregated.
- How much new for-sale + rental construction is in the pipeline within 1–3 miles? Heavy new supply typically softens prices + rents 12–24 months out; constrained supply supports both.
Investment metrics
- 1% rule
- 1.49% ✓
- Cap rate
- 12.18%
- Cash-on-cash
- 21.02%
- DSCR
- 1.94
- GRM
- 5.6
CMA / ARV
No comps found within radius.
Projected returns pro-forma
10.0% appreciation · 3.0% rent growth · sell at horizon
- IRR
- 40.0%
- Equity multiple
- 4.06×
- Total profit
- $84,858
- Equity at exit
- $89,187
- IRR
- 34.5%
- Equity multiple
- 9.14×
- Total profit
- $225,614
- Equity at exit
- $192,335
Cash invested: $27,720 (down + closing). Projections, not guarantees.
Landlord ↔ Tenant lean methodology
- Overall (STATE)
- 92 Strongly Landlord-Friendly
- State Arkansas
- 92 Strongly Landlord-Friendly · R+14
- County
- — inherits STATE
- City
- — inherits STATE
ZIP-level market 72740
- Home prices YoY
- 19.5%
- Active inventory
- 129
- Price-to-rent
- 5.6×
Monthly cashflow live
- Estimated rent
- $1,473 medium interval (Pro) →
- Mortgage (P&I)
- −$519
- Tax from tax record
- −$118 /mo · $1,416/yr
- Insurance
- −$41
- HOA
- −$0
- Vacancy / Maint / Mgmt
- −$309
- Net cashflow
- $485
Break-even live
UW: 25.0% down · 7.5% · 30yr · 1.5% tax · 5.0% vac · 8.0% maint · 8.0% mgmt
Financing live
Cash to close
- Down payment
- $24,750
- Closing costs
- $2,970
- Reserves months
- —
- Total cash needed
- —
Loan-product check · same deal, 3 products live
Conventional
25% down · 7.5% · 30yr
- Down + closing
- —
- Monthly P&I
- —
- Monthly cashflow
- —
- DSCR
- —
- Eligible?
- —
Personal DTI + credit; lowest rate.
DSCR
20% down · 8.5% · 30yr
- Down + closing
- —
- Monthly P&I
- —
- Monthly cashflow
- —
- DSCR
- —
- Eligible?
- —
No personal income docs; deal must DSCR.
Hard money
10% down · 12.0% · 12mo
- Down + closing
- —
- Monthly P&I
- —
- Monthly cashflow
- —
- DSCR
- —
- Eligible?
- —
Short-term bridge; refi at stabilization.
Listing history 18 events
-
2026-06-18days on market $99,000 Active 31 DOM
-
2026-06-17days on market $99,000 Active 30 DOM
-
2026-06-16days on market $99,000 Active 29 DOM
-
2026-06-15days on market $99,000 Active 28 DOM
-
2026-06-14days on market $99,000 Active 26 DOM
-
2026-06-13pricedays on market $99,000 Active 25 DOM
-
2026-06-10days on market $109,000 Active 23 DOM
-
2026-06-09days on market $109,000 Active 22 DOM
-
2026-06-08days on market $109,000 Active 21 DOM
-
2026-06-07pricedays on market $109,000 Active 20 DOM
-
2026-06-05days on market $125,000 Active 17 DOM
-
2026-06-03days on market $125,000 Active 16 DOM
-
2026-06-02days on market $125,000 Active 15 DOM
-
2026-06-01days on market $125,000 Active 14 DOM
-
2026-05-31days on market $125,000 Active 13 DOM
-
2026-05-31days on market $125,000 Active 12 DOM
-
2026-05-21price $150,000
-
2026-05-18$190,000 Active
ⓘ Source: listings_history table (triggers on properties + properties_extension) + one-shot
backfill from property_details.listing_events for pre-trigger history.
Tax reassessment forecast AR · Resets to sale price
- Current annual tax
- $1,416 · $118/mo
- Projected year-2 tax
- $1,416 · $118/mo
- Expected delta
- $0/yr ($0/mo · 0.0%)
ⓘ Screening estimate from a state-policy table — verify with the county assessor before closing.
Climate risk First Street
- Flood 1/10 Low FEMA zone X · 0% chance over 30 yrs
- Wildfire 5/10 Major
- Heat 4/10 Moderate 7 d/yr ≥103°F today · 22 d/yr by 30 yrs out
- Wind 2/10 Low 100% chance of damaging wind over 30 yrs
- Air quality 2/10 Low 0 unhealthy d/yr today · 1 by 30 yrs out
Nearby sold comps map
Loading sold comps map…
Walkable amenities ~0.75 mi
Loading nearby amenities…
Taxation est. · year 1
- Rental income
- $17,680
- − Mortgage interest
- −$5,546
- − Property taxes
- −$1,416
- − Insurance
- −$495
- − Repairs & maintenance
- −$1,414
- − Management
- −$1,414
- − Depreciation
- −$2,880
- Taxable income
- $4,514
- Est. tax owed @ 24.0%
- −$1,083
- After-tax cash flow
- $4,742/yr
For passive investors: Depreciation is non-cash, so a rental often shows a tax loss while cash-flowing — sheltering income. Rental losses are passive: they offset passive income freely, and up to $25,000/yr can offset ordinary (W-2) income if you actively participate and your MAGI is under $100k (phasing out to $0 by $150k); unused losses carry forward. On sale, claimed depreciation is recaptured at up to 25%, and gains may owe capital-gains tax (a 1031 exchange can defer both). Figures are a year-1 estimate at your 24.0% rate — not tax advice; consult a CPA.
Schools (NCES district)
- District
- Huntsville School District
- NCES district ID
- 0508130
- Math proficiency
- 35% ▼ -7.00%
- Reading proficiency
- 29% ▼ -7.00%
- Median HH income
- $37,770
- Composite
- 26.72/100
- National rank
- #7146
- State rank
- #141 of 238 in AR
Livability — St. Paul
No livability data for this city. (Only ~50 U.S. cities are tracked.)
Census & demographics
- Population (ZIP)
- 10,226
Population outlook (Madison County) Hauer SSP2
- Today (2025)
- 15,655 people
- By 2030
- 15,418 · -1.5%
- By 2040
- 14,824 · -5.3%
- By 2050
- 14,198 · -9.3%
- By 2075
- 12,827 · -18.1%
- By 2100
- 10,871 · -30.6%
Race, ethnicity, and origin ACS 2023
- Neighborhood character
- Predominantly White (73%)
- Race & ethnicity
- White 73% Two or more races 22% Hispanic / Latino 4% Pacific Islander 1%
- Common ancestry
- Italian 3% Lithuanian 2% Slovak 2%
- Foreign-born
- 2% · Canada
- Languages at home
- 98% English-only · Spanish 1% Other Asian/Pacific 1%
Political lean MEDSL · Madison
- 2024 margin
- Solid R (+58.6) · D 19.9% · R 78.5% · Other 1.7%
- 2008→2024 swing
- -29.7pp toward R · 2008: -28.9pp · 2024: -58.6pp
- All cycles
- 2024: R+58.6 2020: R+55.7 2016: R+49.1 2012: R+32.9 2008: R+28.9
Not yet ingested
- Civics
- —
Market trends
- HPI YoY
- ▲ 57.73%
- Current HPI
- 353.404
- Rent YoY
- —
- Metro
- —
- State GDP YoY
- ▲ 3.80%
- F500 in state
- 10
Industry mix (Fortune 500 HQ in AR)
| Industry | F500 HQs | Revenue |
|---|---|---|
| Retail | 1 | $681B |
|
||
| Food / Agriculture | 1 | $53B |
|
||
| Retail / Energy | 1 | $22B |
|
||
| Transportation / Logistics | 1 | $12B |
|
||
| Energy | 1 | $4B |
|
||
Price history
-21.1% since first listed2 events — show timeline
- 2026-05-21 Price Changed $150,000 NWARMLS
- 2026-05-18 Listed $190,000 NWARMLS
Property tax history
+16.3%/yrLatest (2025): $1,416 · +65.1% YoY. Source: county tax records.
Cash-flow waterfall
monthlySold comps — $/sqft
last 12 mo · ≤1 miLoading sold comps…