 🌊 Lakefront
2835 Winkler Ave #215 · Fort Myers, FL
Flood risk 1/10 · Minimal
- FEMA flood zone
- X (unshaded)
- Chance of flooding over 30 yrs
- 0.0%
- Est. flood insurance / yr
- $507 – $1,088
Fire risk 1/10 · Minimal
- Est. fire insurance / yr
- $947 – $1,759
Heat risk 10/10 · Severe
- Hot days now (above 107°F)
- 7 days/yr
- Hot days in 30 yrs
- 31 days/yr
Wind risk 10/10 · Severe
- Chance of severe wind over 30 yrs
- 99.0%
Air-quality risk 2/10 · Minimal
- Unhealthy air days now
- 1 days/yr
- Unhealthy air days in 30 yrs
- 1 days/yr
Risk factors via First Street. Map © Google.
Why this score? — see what drove the C grade
The composite is a weighted blend of 9 inputs, each scored 0–100. Each bar is that input's sub-score; the figure is the points it added to the 100-point composite (weight × sub-score).
- Cash flow +19.5/30.0
- 1% rule +10.0/10.0
- ARV discount +7.5/15.0
- DSCR +6.2/10.0
- Livability +4.3/5.0
- Schools +4.1/10.0
- Condition / age +2.5/5.0
- Rent growth +1.4/5.0
- Appreciation +0.0/10.0
$64,999
🖨 Deal sheet 📄 Offer letter ✓ Due diligence
Listing remarks
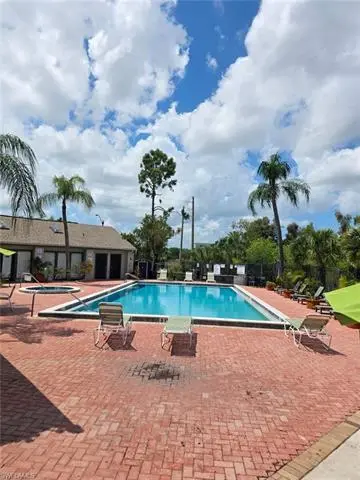
Act quickly—this opportunity won’t last. This second-floor, 1-bedroom, 1-bath end-unit condo in Village Creek offers a desirable corner location with peaceful pool views, making it a standout option in the community. Inside, the layout is efficient and comfortable, providing easy, low-maintenance living that works well for both full-time residents and tenants. The community features a variety of amenities including a pool, spa, clubhouse, and basketball court, adding to its overall appeal. With a higher percentage of rental units than many nearby communities, this property presents strong potential for investors looking to expand their portfolio, while still offering an affordab
Key facts
- Corner location
- Pool views
- New balconies
Tags
Property features AI
Finance
- Other: Complex has 240 units; building contains 21 units; Two units per floor; building is single-story; Subdivision/Development: Fort Myers; Zoning code B2; Lot/unit restrictions include limited number of vehicles, no commercial vehicles, no RVs
- Financial info: One-time special assessment fee: $3,465
- HOA & community: Mandatory HOA; Monthly HOA fee of $398; HOA covers trash removal; Condo management; Non-gated community; Community amenities include tennis courts, community pool, basketball and BBQ/picnic areas; Total annual recurring HOA fees: $4,776; Total one-time fees: $3,740; One-time other fee: $25
Exterior
- Parking: 1 assigned parking space; Guest parking available
- Security: Impact resistant windows
- Utilities: Central water; Sewer assessment paid; Cable available
- Home design: Residential property; Low-rise building (1–3 stories); End-unit; Rear exposure faces south
- Construction: Built in 1985; Wood frame construction; Stucco exterior; Built-up or flat roof; Below-ground private pool
- Exterior features: Pond; Tennis court; Community pool; Basketball and BBQ/picnic amenities; Private road
Interior
- Kitchen: Range; Refrigerator/Freezer
- Bedrooms: 1 bedroom
- Flooring: Tile
- Bathrooms: 1 full bathroom; Master bathroom with shower only
- Heating & cooling: Central electric heat; Central electric cooling; Ceiling fans
- Interior features: High-speed internet available; Breakfast bar and breakfast room; Balcony; Laundry in residence; Unfurnished; Other floor plan
- Laundry & utility: In-unit laundry
Neighborhood map
What this means for you Summary
Snapshot
- This is a 1-bed/1.0-bath condo listed at $65k.
Deal economics
- At list price, monthly cash flow is $74 ($885/yr) — positive.
- The deal already cash-flows at list — no discount required.
- Meets the 1% rule at list price ($1k rent vs $65k).
- Recommended offer: $63k (3.0% below list) — sets the bar for market timing.
- Cap rate 7.7% vs local median 3.0% in Fort Myers — top-decile yield for the area; either an underpriced asset or a hidden risk that comps aren't pricing in. Stress-test before assuming the spread holds.
Location & tenants
- Location reads 86/100 on livability (#14 in FL, #383 nationally) — a professional / high-income tenant draw. Strengths: amenities A+, commute A+, housing A+.
- Lee (suburban): math 47% / reading 50% proficiency, ranked #42 of 73 in FL (top 58%) — families likely to look elsewhere, expect single-tenant / working-renter base with shorter leases.
- Market conditions: Rents falling (-4.3%/yr); 267 active listings in the ZIP; 31 comparable units currently listed for rent nearby; rentals at typical pace (median 15d on market — plan ~3-4 weeks tenant-placement turnaround); 15,411 units permitted in Lee County in 2024 (4,686 in 5+ unit buildings).
Forward outlook
- Local home prices are declining (-3.0%/yr); year-one equity from $449 of loan paydown is wiped out by about $2k of value loss. Plan a longer hold.
- Lee County population projected at +44% by 2050 — long-run rental-demand tailwind backs the buy-and-hold thesis.
Negotiation context
- It's been on market 55 days — a 3% lower offer ($63k) is reasonable based on typical stale-listing flexibility.
- 2 sale attempts; this cycle's ask has dropped $14k (18%) from the opening price — seller is motivated, your offer sets the floor, not the list.
Risks & watch-outs
- Watch-outs: HOA is 27% of rent.
- Climate carrying-cost: severe wind risk, 99% chance of damaging wind over 30y; extreme-heat days projected 7→31/yr by 2055 (HVAC capex compounding) — expect insurance premiums to compound above CPI over the hold.
Questions for the listing agent
- It's been on market 55 days. Have you received any prior offers? Is the seller open to a 3% concession, seller financing, or rate buy-down credit?
- What does the HOA fee cover, when was the last increase, and are there any pending special assessments or reserve-fund shortfalls?
- Any open or pending special assessments — roof, HVAC, plumbing, elevator, façade? What's the per-unit balance and payoff schedule, and is the seller paying it off at close or rolling it to the buyer?
- Is there a deadline driving the sale (1031 exchange, divorce, estate, relocation)? That informs how much negotiation room exists.
- This sits on a lake — are riparian / water-frontage rights deeded with the parcel? Any dock permits, shoreline easements, or HOA water-use restrictions?
- What's the documented flood / surge / shoreline-erosion history here (FEMA AND non-FEMA — e.g., storm surge, creek backup, septic-field saturation)?
- Any water-quality or seasonal algae-bloom issues that affect tenant satisfaction or short-term-rental demand?
- What's the average days-on-market for RENTAL listings here right now (not sales)? A rising rental-DOM trend means longer vacancies and softer asking-rent achievability than the comps imply.
- What's the recent tenant-quality profile in this submarket — average credit score on applications, eviction rate, late-payment / NSF rate, and stable-employment percentage? A property-management company in the area should have these aggregated.
- How much new apartment / multifamily construction is in the pipeline within 1–3 miles? Heavy new supply (>2% of stock underway) typically softens rents 12–24 months out; light construction supports rent growth.
Investment metrics
- 1% rule
- 1.65% ✓
- Cap rate
- 7.66%
- Cash-on-cash
- 4.86%
- DSCR
- 1.22
- GRM
- 5.0
CMA / ARV
No comps found within radius.
Projected returns pro-forma
-3.0% appreciation · 0.0% rent growth · sell at horizon
- IRR
- -14.1%
- Equity multiple
- 0.52×
- Total profit
- $-8,766
- Equity at exit
- $9,692
- IRR
- -16.4%
- Equity multiple
- 0.29×
- Total profit
- $-12,870
- Equity at exit
- $5,620
Cash invested: $18,200 (down + closing). Projections, not guarantees.
Landlord ↔ Tenant lean methodology
- Overall (STATE)
- 87 Strongly Landlord-Friendly
- State Florida
- 87 Strongly Landlord-Friendly · R+3
- County
- — inherits STATE
- City
- — inherits STATE
ZIP-level market 33916
- Home prices YoY
- -28.2%
- Rents YoY
- -4.3%
- Active inventory
- 267
- Price-to-rent
- 5.0×
Monthly cashflow live
- Estimated rent
- $1,074 high interval (Pro) →
- Mortgage (P&I)
- −$341
- Tax from tax record
- −$117 /mo · $1,403/yr
- Insurance
- −$27
- HOA
- −$290
- Vacancy / Maint / Mgmt
- −$226
- Net cashflow
- $74
Break-even live
UW: 25.0% down · 7.5% · 30yr · 1.5% tax · 5.0% vac · 8.0% maint · 8.0% mgmt
Financing live
Cash to close
- Down payment
- $16,250
- Closing costs
- $1,950
- Reserves months
- —
- Total cash needed
- —
Loan-product check · same deal, 3 products live
Conventional
25% down · 7.5% · 30yr
- Down + closing
- —
- Monthly P&I
- —
- Monthly cashflow
- —
- DSCR
- —
- Eligible?
- —
Personal DTI + credit; lowest rate.
DSCR
20% down · 8.5% · 30yr
- Down + closing
- —
- Monthly P&I
- —
- Monthly cashflow
- —
- DSCR
- —
- Eligible?
- —
No personal income docs; deal must DSCR.
Hard money
10% down · 12.0% · 12mo
- Down + closing
- —
- Monthly P&I
- —
- Monthly cashflow
- —
- DSCR
- —
- Eligible?
- —
Short-term bridge; refi at stabilization.
Rent comps 31 comps
| Address | Beds | Baths | Sqft | Rent | $/sqft | DOM | Units | Dist |
|---|---|---|---|---|---|---|---|---|
| 2835 Winkler Ave Fort Myers, FL | 1.0 | 1.0 | 662 | $900 | $1.36 | 2d | 1 | 0.04mi |
| 2855 Winkler Ave Fort Myers, FL | 1.0 | 1.0 | 560 | $925 | $1.65 | 24d | 3 | 0.06mi |
| 2855 Winkler Ave Fort Myers, FL | 1.0 | 1.0 | 560 | $1,000 | $1.78 | 16d | 2 | 0.06mi |
| 2845 Winkler Ave #317 Fort Myers, FL | 1.0 | 1.0 | 560 | $995 | $1.78 | 24d | 1 | 0.07mi |
| 2937 Winkler Ave #1222 Fort Myers, FL | 1.0 | 1.0 | 560 | $997 | $1.78 | 24d | 1 | 0.19mi |
| 2719 Colonial Blvd Fort Myers, FL | 1.0–2.0 | 1.0–2.0 | 771 | $1,078 | $1.40 | 2d | 17 | 0.43mi |
| 2346 Winkler Ave Fort Myers, FL | 1.0–3.0 | 1.0–2.0 | 812 | $1,131 | $1.39 | 2d | 28 | 0.61mi |
| 4121 Residence Dr Fort Myers, FL | 1.0 | 1.0 | 697 | $1,200 | $1.72 | 24d | 2 | 0.62mi |
| 4121 Residence Dr #311 Fort Myers, FL | 1.0 | 1.0 | 697 | $1,300 | $1.87 | 3d | 1 | 0.62mi |
| 3891 Solomon Blvd Fort Myers, FL | 1.0–3.0 | 1.0–2.0 | 856 | $961 | $1.12 | 2d | 23 | 0.66mi |
| 4105 Residence Dr Fort Myers, FL | 1.0 | 1.0 | 757 | $1,098 | $1.45 | 15d | 2 | 0.66mi |
| 4105 Residence Dr #719 Fort Myers, FL | 1.0 | 1.0 | 697 | $1,095 | $1.57 | 3d | 1 | 0.66mi |
| 3419 Winkler Ave Fort Myers, FL | 1.0–3.0 | 1.0–2.0 | 1047 | $1,099 | $1.05 | 11d | 2 | 0.79mi |
| 3419 Winkler Ave Fort Myers, FL | 1.0–3.0 | 1.0–2.0 | 1047 | $999 | $0.95 | 3d | 2 | 0.79mi |
| 3407 Winkler Ave #309 Fort Myers, FL | 1.0 | 1.0 | 655 | $1,100 | $1.68 | 3d | 1 | 0.81mi |
| 3704 Broadway #310 Fort Myers, FL | 1.0 | 1.0 | 702 | $1,000 | $1.42 | 24d | 1 | 0.85mi |
| 3500 Star Ln Fort Myers, FL | 1.0–3.0 | 1.0–2.0 | 881 | $1,303 | $1.48 | 3d | 23 | 0.90mi |
| 3701 Winkler Ave Fort Myers, FL | 1.0–2.0 | 1.0–2.0 | 863 | $896 | $1.04 | 2d | 46 | 1.15mi |
| 6170 Mahaffey Rd Fort Myers, FL | 1.0–3.0 | 1.0–3.0 | 1106 | $1,197 | $1.08 | 24d | 1 | 1.19mi |
| 1942 Passaic Ave Apt 8 Fort Myers, FL | 2.0 | 1.0 | 750 | $995 | $1.33 | 24d | 1 | 1.36mi |
| 2950 Royal Palm Ave Fort Myers, FL | 2.0 | 1.0 | 732 | $1,522 | $2.08 | 24d | 1 | 1.39mi |
| 1840 Maravilla Ave Unit 1 Fort Myers, FL | 1.0 | 1.0 | 660 | $1,050 | $1.59 | 24d | 1 | 1.41mi |
| 1830 Maravilla Ave Fort Myers, FL | 1.0–2.0 | 1.0–2.0 | 785 | $950 | $1.21 | 3d | 8 | 1.43mi |
| 1830 Maravilla Ave Fort Myers, FL | 1.0–2.0 | 1.0–2.0 | 809 | $950 | $1.17 | 15d | 9 | 1.43mi |
| 2310 Maple Ave Fort Myers, FL | 2.0 | 1.0 | 750 | $1,250 | $1.67 | 3d | 1 | 1.45mi |
| 4760 S Cleveland Ave Fort Myers, FL | — | 1.0 | 350 | $799 | $2.28 | 24d | 1 | 1.45mi |
| 2252 Maple Ave Unit 2254-1 Fort Myers, FL | 1.0 | 1.0 | 600 | $1,250 | $2.08 | 16d | 1 | 1.48mi |
| 2919 Jackson St Unit 2 Fort Myers, FL | 1.0 | 1.0 | 650 | $1,150 | $1.77 | 19d | 1 | 1.50mi |
| 2919 Jackson St Fort Myers, FL | 2.0 | 2.0 | 650 | $1,250 | $1.92 | 24d | 1 | 1.50mi |
| 2919 Jackson St #6 Fort Myers, FL | 2.0 | 1.5 | 650 | $1,250 | $1.92 | 24d | 1 | 1.50mi |
| 4637 Deleon St Fort Myers, FL | 3.0 | 1.0–2.0 | 815 | $1,237 | $1.52 | 3d | 37 | 1.50mi |
HOA detail condo
- Monthly dues
- $290 · $3,480/yr
- Likely covers
- pool
- Assessments
- None detected in remarks — confirm with the listing agent.
Listing history 17 events
-
2026-06-17days on market $64,999 Active 55 DOM
-
2026-06-16days on market $64,999 Active 54 DOM
-
2026-06-15days on market $64,999 Active 53 DOM
-
2026-06-13days on market $64,999 Active 51 DOM
-
2026-06-10days on market $64,999 Active 48 DOM
-
2026-06-09days on market $64,999 Active 47 DOM
-
2026-06-08days on market $64,999 Active 46 DOM
-
2026-06-07days on market $64,999 Active 45 DOM
-
2026-06-03days on market $64,999 Active 41 DOM
-
2026-06-02pricedays on market $64,999 Active 40 DOM
-
2026-06-01days on market $74,999 Active 39 DOM
-
2026-05-31days on market $74,999 Active 38 DOM
-
2026-05-18price $74,999
-
2026-04-30status Active
-
2026-04-29historical
-
2026-04-22$79,000 Active
-
2002-05-28soldstatus $10,250,000
ⓘ Source: listings_history table (triggers on properties + properties_extension) + one-shot
backfill from property_details.listing_events for pre-trigger history.
Tax reassessment forecast FL · Resets to sale price
- Current annual tax
- $1,403 · $117/mo
- Projected year-2 tax
- $1,403 · $117/mo
- Expected delta
- $0/yr ($0/mo · 0.0%)
ⓘ Screening estimate from a state-policy table — verify with the county assessor before closing.
Climate risk First Street
- Flood 1/10 Low FEMA zone X (unshaded) · 0% chance over 30 yrs
- Wildfire 1/10 Low
- Heat 10/10 Extreme 7 d/yr ≥107°F today · 31 d/yr by 30 yrs out
- Wind 10/10 Extreme 99% chance of damaging wind over 30 yrs
- Air quality 2/10 Low 1 unhealthy d/yr today · 1 by 30 yrs out
Nearby sold comps map
Loading sold comps map…
Walkable amenities ~0.75 mi
Loading nearby amenities…
Taxation est. · year 1
- Rental income
- $12,891
- − Mortgage interest
- −$3,641
- − Property taxes
- −$1,403
- − Insurance
- −$325
- − Repairs & maintenance
- −$1,031
- − Management
- −$1,031
- − HOA
- −$3,480
- − Depreciation
- −$1,891
- Taxable income
- $88
- Est. tax owed @ 24.0%
- −$21
- After-tax cash flow
- $864/yr
For passive investors: Depreciation is non-cash, so a rental often shows a tax loss while cash-flowing — sheltering income. Rental losses are passive: they offset passive income freely, and up to $25,000/yr can offset ordinary (W-2) income if you actively participate and your MAGI is under $100k (phasing out to $0 by $150k); unused losses carry forward. On sale, claimed depreciation is recaptured at up to 25%, and gains may owe capital-gains tax (a 1031 exchange can defer both). Figures are a year-1 estimate at your 24.0% rate — not tax advice; consult a CPA.
Schools (NCES district)
- District
- Lee
- NCES district ID
- 1201080
- Math proficiency
- 47% ▼ -11.00%
- Reading proficiency
- 50% ▼ -4.00%
- Median HH income
- $49,518
- Composite
- 41.49/100
- National rank
- #3458
- State rank
- #42 of 73 in FL
Livability — Fort Myers
- Score
- 86/100
- State rank
- #14
- US rank
- #383
Category grades
Schools grade is shown separately in the Schools card above.
Census & demographics
- Census place
- Fort Myers, FL
- County
- Lee County · 788,662 people
- City population
- 278,598
- Metro
- Cape Coral-Fort Myers, FL
- Population (ZIP)
- 27,943
- Household income
- $52,586
- Rent vs Own
- Severe rent burden
- 2324.0
Population outlook (Lee County) Hauer SSP2
- Today (2025)
- 871,946 people
- By 2030
- 955,468 · +9.6%
- By 2040
- 1,113,587 · +27.7%
- By 2050
- 1,256,891 · +44.1%
- By 2075
- 1,560,270 · +78.9%
- By 2100
- 1,726,848 · +98.0%
Race, ethnicity, and origin ACS 2023
- Neighborhood character
- Highly diverse neighborhood (Simpson 0.71)
- Race & ethnicity
- Black 34% Hispanic / Latino 30% White 28% Two or more races 21% Asian 2%
- Hispanic origin (detail)
- Mexican 5% Puerto Rican 6% Cuban 7% Dominican 1%
- Common ancestry
- Estonian 3% Hispanic 1% Romanian 1%
- Foreign-born
- 22% · Canada, Vietnam, China
- Languages at home
- 69% English-only · Spanish 24% Other Indo-European 4% French/Haitian/Cajun 1%
Political lean MEDSL · Lee
- 2024 margin
- Strong R (+28.4) · D 35.5% · R 63.9%
- 2008→2024 swing
- -18.0pp toward R · 2008: -10.4pp · 2024: -28.4pp
- All cycles
- 2024: R+28.4 2020: R+19.2 2016: R+20.4 2012: R+16.6 2008: R+10.4
Not yet ingested
- Civics
- —
Market trends
- HPI YoY
- ▼ -95.73%
- Current HPI
- 243.2657
- Rent YoY
- ▼ -4.30%
- Metro
- Cape Coral-Fort Myers, FL
- State GDP YoY
- ▲ 3.28%
- F500 in state
- 36
Industry mix (Fortune 500 HQ in FL)
| Industry | F500 HQs | Revenue |
|---|---|---|
| Industrial Technology | 2 | $29B |
|
||
| Insurance | 2 | $17B |
|
||
| Retail | 1 | $60B |
|
||
| Technology Distribution | 1 | $58B |
|
||
| Homebuilding | 1 | $35B |
|
||
| Technology Manufacturing | 1 | $35B |
|
||
Price history
-99.3% since first listed5 events — show timeline
- 2026-05-18 Price Changed $74,999 NAPLESMLS
- 2026-04-30 Relisted — NAPLESMLS
- 2026-04-29 Listing Removed — NAPLESMLS
- 2026-04-22 Listed $79,000 NAPLESMLS
- 2002-05-28 Sold (Public Records) $10,250,000 Public Records
Property tax history
+8.8%/yrLatest (2025): $1,403 · +1.9% YoY. Source: county tax records.
Cash-flow waterfall
monthlySold comps — $/sqft
last 12 mo · ≤1 miLoading sold comps…