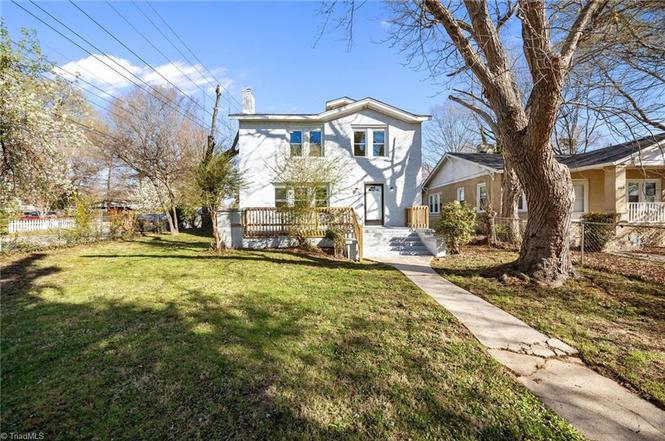
801 E Lexington Ave · High Point, NC
Flood risk 1/10 · Minimal
- FEMA flood zone
- X (unshaded)
- Chance of flooding over 30 yrs
- 0.0%
- Est. flood insurance / yr
- $507 – $1,088
Fire risk 1/10 · Minimal
- Est. fire insurance / yr
- $906 – $1,684
Heat risk 5/10 · Moderate
- Hot days now (above 104°F)
- 7 days/yr
- Hot days in 30 yrs
- 17 days/yr
Wind risk 4/10 · Minor
- Chance of severe wind over 30 yrs
- 15.0%
Air-quality risk 2/10 · Minimal
- Unhealthy air days now
- 1 days/yr
- Unhealthy air days in 30 yrs
- 1 days/yr
Risk factors via First Street. Map © Google.
Why this score? — see what drove the C grade
The composite is a weighted blend of 9 inputs, each scored 0–100. Each bar is that input's sub-score; the figure is the points it added to the 100-point composite (weight × sub-score).
- Cash flow +20.3/30.0
- ARV discount +15.0/15.0
- DSCR +6.4/10.0
- 1% rule +4.4/10.0
- Livability +3.9/5.0
- Schools +3.6/10.0
- Rent growth +2.7/5.0
- Condition / age +2.5/5.0
- Appreciation +0.0/10.0
$175,000
🖨 Deal sheet 📄 Offer letter ✓ Due diligence
Listing remarks
Welcome home to this charming property in the heart of High Point! The large front porch is perfect for relaxing afternoons in rocking chairs or entertaining guests. Inside, a welcoming foyer and new flooring throughout leads into the living room where built-in shelves add character and functional storage. The cozy kitchen features new cabinetry, with convenient access to the laundry room and back door leading directly to the driveway. The main-level primary bedroom offers everyday ease, while upstairs you’ll find three additional bedrooms with new carpet, providing flexible space for guests, hobbies, or home office needs. Step outside to enjoy the fenced yard with room for pets, play
Key facts
- Large front porch
- Fenced yard
- New cabinetry
Tags
Property features AI
Finance
- HOA & community: No association
Exterior
- Parking: Driveway
- Security: Deadbolt locks
- Utilities: Public water; Public sewer; Electric water heater; Natural gas available for heating; Publicly maintained road
- Home design: Residential stick/site-built house; Two levels; Built in 1945; Existing structure
- Construction: Brick construction
- Exterior features: Sump pump; Fenced yard; City lot
Interior
- Kitchen: Exhaust fan
- Bedrooms: Multiple bedrooms across main and second levels (dimensions available for rooms on each level)
- Flooring: Carpet; Laminate
- Bathrooms: One full bathroom
- Heating & cooling: Forced air heating (natural gas); Central air conditioning; Electric water heater
- Interior features: Primary bedroom on the main level; Pulldown attic stairs; Built-in features; Deadbolt locks; Pantry
- Laundry & utility: Washer hookup on main level; Dryer connection
Neighborhood map
What this means for you Summary
Snapshot
- This is a 3-bed/1.0-bath single-family listed at $175k.
Deal economics
- At list price, monthly cash flow is $225 ($3k/yr) — positive.
- The deal already cash-flows at list — no discount required.
- To meet the 1% rule (rent ≥ 1% of price), the offer needs to be $164k (6.5% below list).
- Recommended offer: $159k (9.0% below list) — sets the bar for market timing.
- Cap rate 7.8% vs local median 4.0% in High Point — top-decile yield for the area; either an underpriced asset or a hidden risk that comps aren't pricing in. Stress-test before assuming the spread holds.
Location & tenants
- Location reads 77/100 on livability (#31 in NC, #3,084 nationally) — a middle-class / working-renter tenant base. Strengths: commute A+, cost of living A+, housing A+; Watch: amenities D, employment D, crime F.
- Guilford County Schools (urban): math 39% / reading 45% proficiency, ranked #99 of 178 in NC (top 56%) — families likely to look elsewhere, expect single-tenant / working-renter base with shorter leases.
- Zoned schools: High Point Central High (math 48% / reading 42%, grade D-, #350 of 535 statewide, top 66%, 1,081 students, 100% FRL) — zoned schools average 100% FRL vs 52% district-wide (47 pts higher); higher-poverty schools than district average — tighter screening recommended.
- Market conditions: Rents flat; 120 active listings in the ZIP; 18 comparable units currently listed for rent nearby; rentals at typical pace (median 23d on market — plan ~3-4 weeks tenant-placement turnaround); 3,843 units permitted in Guilford County in 2024 (2,397 in 5+ unit buildings).
- This rent runs 30% of the median local income ($65k/yr) — at the standard rent-burdened threshold; future hikes will face affordability resistance.
Forward outlook
- Local home prices are declining (-3.0%/yr); year-one equity from $1k of loan paydown is wiped out by about $5k of value loss. Plan a longer hold.
- Guilford County population projected at +26% by 2050 — long-run rental-demand tailwind backs the buy-and-hold thesis.
Negotiation context
- It's been on market 93 days — a 9% lower offer ($159k) is reasonable based on typical stale-listing flexibility.
- Current owner paid $43k; list at $175k implies a 307% gain — meaningful room to come down on a strong offer.
Risks & watch-outs
- Watch-outs: built in 1945 — expect roof / HVAC / electrical / plumbing capex.
- Climate carrying-cost: extreme-heat days projected 7→17/yr by 2055 (HVAC capex compounding) — expect insurance premiums to compound above CPI over the hold.
Questions for the listing agent
- It's been on market 93 days. Have you received any prior offers? Is the seller open to a 9% concession, seller financing, or rate buy-down credit?
- Built in 1945 — when were the roof, HVAC, electrical panel, plumbing, and water heater last replaced?
- Why hasn't it sold? Are there any deal-killer items the seller is aware of (foundation, flood, title, zoning, code violations)?
- Is there a deadline driving the sale (1031 exchange, divorce, estate, relocation)? That informs how much negotiation room exists.
- Schools are D-rated, which usually means shorter tenancies and higher turnover. Who's the typical renter profile here, and what's been the actual vacancy rate?
- Crime grade is F in this area — have there been break-ins, vandalism, or insurance claims at this property in the last 3 years? What carrier currently insures it and at what premium?
- What's the average days-on-market for RENTAL listings here right now (not sales)? A rising rental-DOM trend means longer vacancies and softer asking-rent achievability than the comps imply.
- What's the recent tenant-quality profile in this submarket — average credit score on applications, eviction rate, late-payment / NSF rate, and stable-employment percentage? A property-management company in the area should have these aggregated.
- How much new for-sale + rental construction is in the pipeline within 1–3 miles? Heavy new supply typically softens prices + rents 12–24 months out; constrained supply supports both.
Investment metrics
- 1% rule
- 0.94% ✗
- Cap rate
- 7.83%
- Cash-on-cash
- 5.50%
- DSCR
- 1.24
- GRM
- 8.9
CMA / ARV
- ARV (on-the-fly)
- $230,550
- Comps found
- 12
Show comp detail 12 sales within ~0.75 mi
| Address | Dist | Beds/Ba | Sqft | Sold | Price | $/sf | Match |
|---|---|---|---|---|---|---|---|
| 512 Guilford Ave | 0.37mi | 3/2.5 | 1,449 (-0%) | 10mo | $255,000 | $176 | 69 |
| 1006 Hamilton St | 0.59mi | 3/1.0 | 1,398 (-4%) | 2mo | $212,000 | $152 | 66 |
| 511 Farriss Ave | 0.38mi | 3/2.0 | 1,560 (+8%) | 3mo | $322,500 | $207 | 63 |
| 1423 Hamilton St | 0.46mi | 3/2.0 | 1,448 (-0%) | 15mo | $137,000 | $95 | 62 |
| 1137 Bridges Dr | 0.41mi | 3/1.5 | 1,464 (+1%) | 18mo | $230,000 | $157 | 62 |
| 531 Farriss Ave | 0.35mi | 4/2.0 (+1) | 1,486 (+2%) | 13mo | $275,000 | $185 | 60 |
| 1404 Forrest St | 0.34mi | 3/2.0 | 1,637 (+13%) | 14mo | $218,000 | $133 | 47 |
| 420 Chester Woods Ct | 0.71mi | 3/2.0 | 1,576 (+9%) | 2mo | $279,000 | $177 | 47 |
| 713 Forrest St | 0.49mi | 2/1.0 (-1) | 1,513 (+4%) | 22mo | $255,000 | $169 | 47 |
| 1610 Johnson St | 0.53mi | 3/2.5 | 1,312 (-10%) | 11mo | $75,000 | $57 | 44 |
| 205 Guilford Ave | 0.56mi | 3/1.5 | 1,255 (-13%) | 17mo | $164,000 | $131 | 35 |
| 406 E Lexington Ave | 0.39mi | 4/3.0 (+1) | 1,634 (+13%) | 16mo | $260,000 | $159 | 34 |
Match score weights: distance 35% · size 25% · config 20% · recency 20%. Top-matched comps best support the ARV.
Projected returns pro-forma
-3.0% appreciation · 0.9% rent growth · sell at horizon
- IRR
- -10.0%
- Equity multiple
- 0.64×
- Total profit
- $-17,497
- Equity at exit
- $26,093
- IRR
- -3.5%
- Equity multiple
- 0.79×
- Total profit
- $-10,388
- Equity at exit
- $15,131
Cash invested: $49,000 (down + closing). Projections, not guarantees.
Landlord ↔ Tenant lean methodology
- Overall (STATE)
- 85 Strongly Landlord-Friendly
- State North Carolina
- 85 Strongly Landlord-Friendly · R+3
- County
- — inherits STATE
- City
- — inherits STATE
ZIP-level market 27262
- Rents YoY
- 0.9%
- Active inventory
- 120
- Price-to-rent
- 8.9×
Monthly cashflow live
- Estimated rent
- $1,637 high interval (Pro) →
- Mortgage (P&I)
- −$918
- Tax from tax record
- −$78 /mo · $933/yr
- Insurance
- −$73
- HOA
- −$0
- Vacancy / Maint / Mgmt
- −$344
- Net cashflow
- $225
Break-even live
UW: 25.0% down · 7.5% · 30yr · 1.5% tax · 5.0% vac · 8.0% maint · 8.0% mgmt
Financing live
Cash to close
- Down payment
- $43,750
- Closing costs
- $5,250
- Reserves months
- —
- Total cash needed
- —
Loan-product check · same deal, 3 products live
Conventional
25% down · 7.5% · 30yr
- Down + closing
- —
- Monthly P&I
- —
- Monthly cashflow
- —
- DSCR
- —
- Eligible?
- —
Personal DTI + credit; lowest rate.
DSCR
20% down · 8.5% · 30yr
- Down + closing
- —
- Monthly P&I
- —
- Monthly cashflow
- —
- DSCR
- —
- Eligible?
- —
No personal income docs; deal must DSCR.
Hard money
10% down · 12.0% · 12mo
- Down + closing
- —
- Monthly P&I
- —
- Monthly cashflow
- —
- DSCR
- —
- Eligible?
- —
Short-term bridge; refi at stabilization.
Rent comps 18 comps
| Address | Beds | Baths | Sqft | Rent | $/sqft | DOM | Units | Dist |
|---|---|---|---|---|---|---|---|---|
| 704 E Lexington Ave High Point, NC | 2.0 | 1.0 | 984 | $1,495 | $1.52 | 21d | 1 | 0.03mi |
| 829 Putnam St High Point, NC | 4.0 | 1.0 | 1013 | $1,695 | $1.67 | 23d | 1 | 0.25mi |
| 1208 Madison St High Point, NC | 4.0 | 2.5 | 1550 | $1,745 | $1.13 | 23d | 1 | 0.41mi |
| 1503 Larkin St High Point, NC | 4.0 | 3.0 | 1688 | $2,250 | $1.33 | 23d | 1 | 0.48mi |
| 409 Woodrow Ave High Point, NC | 4.0 | 2.0 | 1863 | $2,650 | $1.42 | 19d | 1 | 0.53mi |
| 205 Guilford Ave High Point, NC | 3.0 | 1.5 | 1255 | $1,350 | $1.08 | 19d | 1 | 0.54mi |
| 2120 Chester Ridge Dr High Point, NC | 1.0–3.0 | 1.0–2.0 | 1001 | $1,443 | $1.44 | 14d | 7 | 0.67mi |
| 313 4th St Unit B High Point, NC | 2.0 | 1.0 | 900 | $995 | $1.11 | 23d | 1 | 0.97mi |
| 511 Saunders Pl Unit B High Point, NC | 2.0 | 1.0 | 913 | $1,050 | $1.15 | 23d | 1 | 0.99mi |
| 1533 Beaucrest Ave Unit B High Point, NC | 2.0 | 1.0 | 950 | $995 | $1.05 | 23d | 1 | 1.02mi |
| 511 Jeanette Ave High Point, NC | 3.0 | 1.5 | 1664 | $1,950 | $1.17 | 23d | 1 | 1.06mi |
| 509 Ashburn St High Point, NC | 3.0 | 1.0 | 1000 | $795 | $0.80 | 23d | 1 | 1.17mi |
| 1508 Whitehall St High Point, NC | 3.0 | 2.0 | 1616 | $1,800 | $1.11 | 23d | 1 | 1.21mi |
| 1910 Whitehall St High Point, NC | 3.0 | 1.0 | 925 | $1,095 | $1.18 | 23d | 1 | 1.24mi |
| 150 James Rd Unit 3D High Point, NC | 2.0 | 2.0 | 1200 | $1,225 | $1.02 | 14d | 1 | 1.36mi |
| 1620 Stoneybrook Dr High Point, NC | 3.0 | 2.0 | 1250 | $1,825 | $1.46 | 19d | 1 | 1.39mi |
| 2522 Suffolk Ave High Point, NC | 1.0–3.0 | 1.0–2.0 | 870 | $1,250 | $1.44 | 23d | 1 | 1.45mi |
| 1408 E Martin Luther King Jr Dr High Point, NC | 3.0 | 2.0 | 1456 | $1,450 | $1.00 | 23d | 1 | 1.47mi |
Listing history 14 events
-
2026-06-14statusdays on market $175,000 Pending 93 DOM
-
2026-06-10days on market $175,000 Due Diligence Period 90 DOM
-
2026-06-09days on market $175,000 Due Diligence Period 89 DOM
-
2026-06-08days on market $175,000 Due Diligence Period 88 DOM
-
2026-06-07days on market $175,000 Due Diligence Period 87 DOM
-
2026-06-03days on market $175,000 Due Diligence Period 83 DOM
-
2026-06-02days on market $175,000 Due Diligence Period 82 DOM
-
2026-06-01days on market $175,000 Due Diligence Period 81 DOM
-
2026-05-31days on market $175,000 Due Diligence Period 80 DOM
-
2026-05-31days on market $175,000 Due Diligence Period 79 DOM
-
2026-04-28price $175,000
-
2026-03-27price $189,000
-
2026-03-12$199,000 Active
-
1993-12-01soldstatus $43,050
ⓘ Source: listings_history table (triggers on properties + properties_extension) + one-shot
backfill from property_details.listing_events for pre-trigger history.
Tax reassessment forecast NC · Resets to sale price
- Current annual tax
- $933 · $78/mo
- Projected year-2 tax
- $1,435 · $120/mo
- Expected delta
- +$502/yr (+$42/mo · 53.9%)
ⓘ Screening estimate from a state-policy table — verify with the county assessor before closing.
Climate risk First Street
- Flood 1/10 Low FEMA zone X (unshaded) · 0% chance over 30 yrs
- Wildfire 1/10 Low
- Heat 5/10 Major 7 d/yr ≥104°F today · 17 d/yr by 30 yrs out
- Wind 4/10 Moderate 15% chance of damaging wind over 30 yrs
- Air quality 2/10 Low 1 unhealthy d/yr today · 1 by 30 yrs out
Nearby sold comps map
Loading sold comps map…
Walkable amenities ~0.75 mi
Loading nearby amenities…
Taxation est. · year 1
- Rental income
- $19,641
- − Mortgage interest
- −$9,803
- − Property taxes
- −$933
- − Insurance
- −$875
- − Repairs & maintenance
- −$1,571
- − Management
- −$1,571
- − Depreciation
- −$5,091
- Taxable loss
- −$203
- Est. tax savings @ 24.0%
- +$49
- After-tax cash flow
- $2,745/yr
For passive investors: Depreciation is non-cash, so a rental often shows a tax loss while cash-flowing — sheltering income. Rental losses are passive: they offset passive income freely, and up to $25,000/yr can offset ordinary (W-2) income if you actively participate and your MAGI is under $100k (phasing out to $0 by $150k); unused losses carry forward. On sale, claimed depreciation is recaptured at up to 25%, and gains may owe capital-gains tax (a 1031 exchange can defer both). Figures are a year-1 estimate at your 24.0% rate — not tax advice; consult a CPA.
Schools (NCES district)
- District
- Guilford County Schools
- NCES district ID
- 3701920
- Math proficiency
- 39% ▲ 1.00%
- Reading proficiency
- 45% ▲ 1.00%
- Median HH income
- $46,315
- Composite
- 35.78/100
- National rank
- #4842
- State rank
- #99 of 178 in NC
Livability — High Point
- Score
- 77/100
- State rank
- #31
- US rank
- #3084
Category grades
Schools grade is shown separately in the Schools card above.
Census & demographics
- Census place
- High Point, NC
- County
- Guilford County · 487,190 people
- City population
- 102,450
- Metro
- Greensboro-High Point, NC
- Population (ZIP)
- 28,353
- Household income
- $65,006
- Rent vs Own
- Severe rent burden
- 1046.0
Population outlook (Guilford County) Hauer SSP2
- Today (2025)
- 584,596 people
- By 2030
- 616,851 · +5.5%
- By 2040
- 678,451 · +16.1%
- By 2050
- 734,788 · +25.7%
- By 2075
- 862,985 · +47.6%
- By 2100
- 948,704 · +62.3%
Race, ethnicity, and origin ACS 2023
- Neighborhood character
- Diverse neighborhood (Simpson 0.65)
- Race & ethnicity
- White 50% Black 30% Hispanic / Latino 12% Two or more races 7% Asian 4%
- Hispanic origin (detail)
- Mexican 8% Puerto Rican 1%
- Common ancestry
- Slovak 4% Italian 2% Lithuanian 1%
- Foreign-born
- 14% · Canada
- Languages at home
- 80% English-only · Spanish 10% Other Indo-European 5% Other Asian/Pacific 1%
Political lean MEDSL · Guilford
- 2024 margin
- Strong D (+21.8) · D 60.2% · R 38.4% · Other 1.4%
- 2008→2024 swing
- +3.5pp toward D · 2008: 18.4pp · 2024: 21.8pp
- All cycles
- 2024: D+21.8 2020: D+23.1 2016: D+20.0 2012: D+16.5 2008: D+18.4
Not yet ingested
- Civics
- —
Market trends
- HPI YoY
- ▼ -279.14%
- Current HPI
- 205.6152
- Rent YoY
- ▲ 0.90%
- Metro
- Greensboro-High Point, NC
- State GDP YoY
- ▲ 3.28%
- F500 in state
- 26
Industry mix (Fortune 500 HQ in NC)
| Industry | F500 HQs | Revenue |
|---|---|---|
| Financial Services | 2 | $213B |
|
||
| Retail | 2 | $95B |
|
||
| Industrial Conglomerate | 1 | $38B |
|
||
| Metals / Steel | 1 | $35B |
|
||
| Utilities | 1 | $30B |
|
||
| Industrial Machinery | 1 | $19B |
|
||
Price history
+306.5% since first listed4 events — show timeline
- 2026-04-28 Price Changed $175,000 Triad MLS
- 2026-03-27 Price Changed $189,000 Triad MLS
- 2026-03-12 Listed $199,000 Triad MLS
- 1993-12-01 Sold (Public Records) $43,050 Public Records
Property tax history
-0.4%/yrLatest (2025): $933 · -0.8% YoY. Source: county tax records.
Cash-flow waterfall
monthlySold comps — $/sqft
last 12 mo · ≤1 miLoading sold comps…