 38-Plex
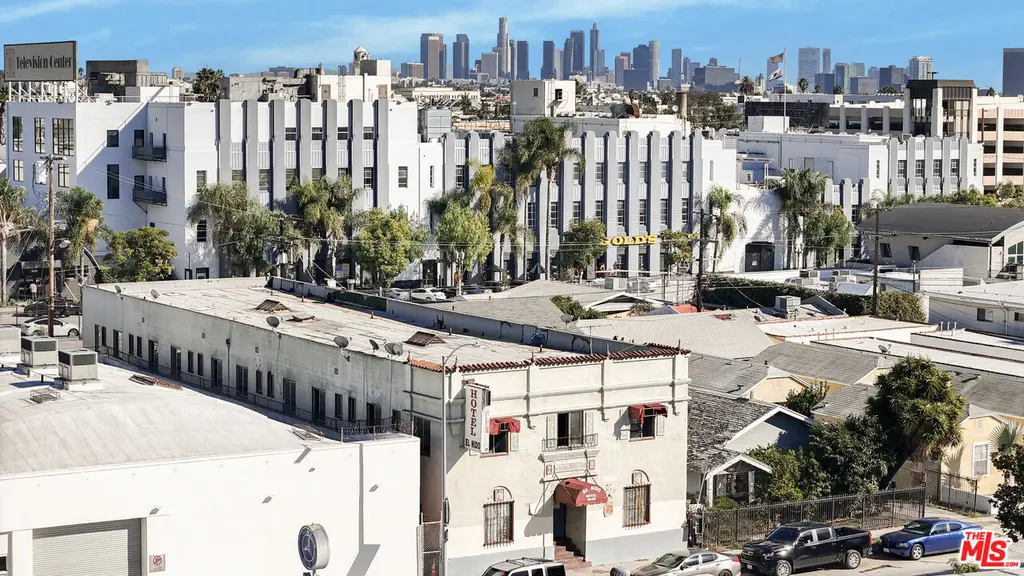
1042 Wilcox Ave · Los Angeles, CA
Flood risk No data
- FEMA flood zone
- —
- Chance of flooding over 30 yrs
- —
- Est. flood insurance / yr
- —
Fire risk No data
- Est. fire insurance / yr
- —
Heat risk No data
- Hot days now (above threshold)
- —
- Hot days in 30 yrs
- —
Wind risk No data
- Chance of severe wind over 30 yrs
- —
Air-quality risk No data
- Unhealthy air days now
- —
- Unhealthy air days in 30 yrs
- —
Risk factors via First Street. Map © Google.
Why this score? — see what drove the C+ grade
The composite is a weighted blend of 9 inputs, each scored 0–100. Each bar is that input's sub-score; the figure is the points it added to the 100-point composite (weight × sub-score).
- Cash flow +30.0/30.0
- 1% rule +10.0/10.0
- DSCR +10.0/10.0
- Schools +3.6/10.0
- Livability +3.4/5.0
- Rent growth +2.7/5.0
- Condition / age +1.0/5.0
- ARV discount +0.0/15.0
- Appreciation +0.0/10.0
$3,600,000
🖨 Deal sheet (PDF) 📄 Offer letter ✓ Due diligence
Multi-family units
County records classify this as Multi-Family (5+ Unit). Listing-text estimate: 38 units. confirmed
5+ unit building — per-unit beds/baths from public records are typically unavailable; the breakdown below (if shown) is an estimate from the listing text.
Listing remarks MLS
1042 Wilcox Ave, a FULLY VACANT 38 unit apartment building located in the heart of Hollywood, a highly desirable neighborhood in Los Angeles, California. Cap rate and GRM are based on the post rennovation scheduled income of the property. The property offers flexibility to operate as a hotel or multifamily building, with potential for short-term rentals. Built in 1928, the property consists of (38) bachelor units. The building is 9,880 gross square feet and sits on a 6,131 square foot lot.
Key facts
- Heart of hollywood
- 6,133 sq ft lot
- Built 1928
Tags
Neighborhood map
What this means for you Summary
Snapshot
- This is a 38 × 1-bed/1-bath units multifamily listed at $3.60M. Condition is rated poor.
Deal economics
- At list price, monthly cash flow is $26k ($307k/yr) — positive. Per door: $673/mo.
- The deal already cash-flows at list — no discount required.
- Meets the 1% rule at list price ($64k rent vs $3.60M).
- Recommended offer: $3.38M (6.0% below list) — sets the bar for market timing.
- Cap rate 14.8% vs local median 2.1% in Los Angeles — top-decile yield for the area; either an underpriced asset or a hidden risk that comps aren't pricing in. Stress-test before assuming the spread holds.
Location & tenants
- Location reads 68/100 on livability (#273 in CA) — a middle-class / working-renter tenant base. Strengths: amenities A+, commute A+, employment B; Watch: health & safety C-, crime F, cost of living F.
- Los Angeles Unified (urban): math 29% / reading 54% proficiency, ranked #223 of 517 in CA (top 43%) — families likely to look elsewhere, expect single-tenant / working-renter base with shorter leases; 67% free/reduced lunch — lower-income household profile, screen leases tightly.
- Zoned schools: Vine Street Elementary (251 students, 92% FRL); Hubert Howe Bancroft Middle (446 students, 92% FRL); Fairfax Senior High (math 40% / reading 61%, grade D+, #324 of 1,170 statewide, top 28%, 1,632 students, 81% FRL) — zoned schools average 89% FRL vs 67% district-wide (21 pts higher); higher-poverty schools than district average — tighter screening recommended.
- Market conditions: Rents flat; 88 active listings in the ZIP; 19,697 units permitted in Los Angeles County in 2024 (9,426 in 5+ unit buildings).
- At $63,861/mo this rent would consume 1247% of the median local household income ($61k/yr) (locally 4038% of renters already pay >50% of income on rent) — very limited rent-growth headroom before tenants either downsize or default.
Forward outlook
- Local home prices are declining (-3.0%/yr); year-one equity from $25k of loan paydown is wiped out by about $108k of value loss. Plan a longer hold.
- Los Angeles County population projected at +9% by 2050 — modest demand growth; plan on rents tracking national, not racing it.
- At projected returns (-3.0% appreciation + 0.7% rent growth), your $1.01M cash investment doubles in ~5 years — after that, you're playing with house money.
Negotiation context
- It's been on market 63 days — a 6% lower offer ($3.38M) is reasonable based on typical stale-listing flexibility.
- 3 sale attempts since 2y ago with the ask held roughly flat each time — persistent listings suggest the price (not the market) is what's stuck; bring a comps-based counter.
- Current owner paid $3.03M; 19% above their basis — modest negotiation headroom, anchor on the comps not their cost.
Risks & watch-outs
- Watch-outs: built in 1928 — expect roof / HVAC / electrical / plumbing capex.
Questions for the listing agent
- It's been on market 63 days. Have you received any prior offers? Is the seller open to a 6% concession, seller financing, or rate buy-down credit?
- Can we see the unit-by-unit rent roll, current vacancy, and any below-market leases? What's the average tenancy length?
- What capital expenditures (roof, boiler, parking lot, exteriors) have been made in the last 5 years, and what's planned in the next 2?
- Have any recent inspections been done? Can we get a copy of the seller's disclosures and any deferred-maintenance estimates?
- Built in 1928 — when were the roof, HVAC, electrical panel, plumbing, and water heater last replaced?
- Why hasn't it sold? Are there any deal-killer items the seller is aware of (foundation, flood, title, zoning, code violations)?
- Is there a deadline driving the sale (1031 exchange, divorce, estate, relocation)? That informs how much negotiation room exists.
- Schools are D-rated, which usually means shorter tenancies and higher turnover. Who's the typical renter profile here, and what's been the actual vacancy rate?
- Crime grade is F in this area — have there been break-ins, vandalism, or insurance claims at this property in the last 3 years? What carrier currently insures it and at what premium?
- What's the average days-on-market for RENTAL listings here right now (not sales)? A rising rental-DOM trend means longer vacancies and softer asking-rent achievability than the comps imply.
- What's the recent tenant-quality profile in this submarket — average credit score on applications, eviction rate, late-payment / NSF rate, and stable-employment percentage? A property-management company in the area should have these aggregated.
- How much new apartment / multifamily construction is in the pipeline within 1–3 miles? Heavy new supply (>2% of stock underway) typically softens rents 12–24 months out; light construction supports rent growth.
Investment metrics
- 1% rule
- 1.77% ✓
- Cap rate
- 14.82%
- Cash-on-cash
- 30.44%
- DSCR
- 2.35
- GRM
- 4.7
CMA / ARV
- ARV (median comp)
- $3,070,088
- List price
- $3,600,000
- Delta
- 17.26%
- Verdict
- OVERPRICED
- Comps
- 15 within 1.0 mi
Projected returns pro-forma
-3.0% appreciation · 0.67% rent growth · sell at horizon
- IRR
- 22.5%
- Equity multiple
- 1.89×
- Total profit
- $899,948
- Equity at exit
- $536,772
- IRR
- 28.9%
- Equity multiple
- 3.29×
- Total profit
- $2,311,731
- Equity at exit
- $311,262
Cash invested: $1,008,000 (down + closing). Projections, not guarantees.
Landlord ↔ Tenant lean methodology
- Overall (CITY)
- 0 Strongly Tenant-Friendly
- State California
- 18 Strongly Tenant-Friendly · D+13
- County
- — inherits STATE
- City Los Angeles
- 0 Strongly Tenant-Friendly · D+22
ZIP-level market 90038
- Rents YoY
- 0.7%
- Active inventory
- 88
- Price-to-rent
- 178.5×
Monthly cashflow live
- Estimated rent
- $63,861 high interval (Pro) →
- Mortgage (P&I)
- −$18,879
- Tax est. 1.5%
- −$4,500 /mo · $54,000/yr
- Insurance
- −$1,500
- HOA
- −$0
- Vacancy / Maint / Mgmt
- −$13,411
- Net cashflow
- $25,571
Break-even live
Sensitivity live
| Price | -10% $28,059 | -5% $26,815 | +0% $25,571 | +5% $24,327 | +10% $23,084 |
|---|---|---|---|---|---|
| Rent | -10% $20,526 | -5% $23,049 | +0% $25,571 | +5% $28,094 | +10% $30,616 |
| Rate | -1.0pp $27,384 | -0.5pp $26,487 | base $25,571 | +0.5pp $24,639 | +1.0pp $23,690 |
38-unit breakdown (identical units grouped — click to expand)
| Units | Beds | Baths | Est. rent |
|---|---|---|---|
| 38× units | 1 | 1 | $63,878 |
| #1 | 1 | 1 | $1,681 |
| #2 | 1 | 1 | $1,681 |
| #3 | 1 | 1 | $1,681 |
| #4 | 1 | 1 | $1,681 |
| #5 | 1 | 1 | $1,681 |
| #6 | 1 | 1 | $1,681 |
| #7 | 1 | 1 | $1,681 |
| #8 | 1 | 1 | $1,681 |
| #9 | 1 | 1 | $1,681 |
| #10 | 1 | 1 | $1,681 |
| #11 | 1 | 1 | $1,681 |
| #12 | 1 | 1 | $1,681 |
| #13 | 1 | 1 | $1,681 |
| #14 | 1 | 1 | $1,681 |
| #15 | 1 | 1 | $1,681 |
| #16 | 1 | 1 | $1,681 |
| #17 | 1 | 1 | $1,681 |
| #18 | 1 | 1 | $1,681 |
| #19 | 1 | 1 | $1,681 |
| #20 | 1 | 1 | $1,681 |
| #21 | 1 | 1 | $1,681 |
| #22 | 1 | 1 | $1,681 |
| #23 | 1 | 1 | $1,681 |
| #24 | 1 | 1 | $1,681 |
| #25 | 1 | 1 | $1,681 |
| #26 | 1 | 1 | $1,681 |
| #27 | 1 | 1 | $1,681 |
| #28 | 1 | 1 | $1,681 |
| #29 | 1 | 1 | $1,681 |
| #30 | 1 | 1 | $1,681 |
| #31 | 1 | 1 | $1,681 |
| #32 | 1 | 1 | $1,681 |
| #33 | 1 | 1 | $1,681 |
| #34 | 1 | 1 | $1,681 |
| #35 | 1 | 1 | $1,681 |
| #36 | 1 | 1 | $1,681 |
| #37 | 1 | 1 | $1,681 |
| #38 | 1 | 1 | $1,681 |
| Total (38 units) | $63,861 | ||
UW: 25.0% down · 7.5% · 30yr · 1.5% tax · 5.0% vac · 8.0% maint · 8.0% mgmt
Financing live
Cash to close
- Down payment
- $900,000
- Closing costs
- $108,000
- Reserves months
- —
- Total cash needed
- —
Loan-product check · same deal, 3 products live
Conventional
25% down · 7.5% · 30yr
- Down + closing
- —
- Monthly P&I
- —
- Monthly cashflow
- —
- DSCR
- —
- Eligible?
- —
Personal DTI + credit; lowest rate.
DSCR
20% down · 8.5% · 30yr
- Down + closing
- —
- Monthly P&I
- —
- Monthly cashflow
- —
- DSCR
- —
- Eligible?
- —
No personal income docs; deal must DSCR.
Hard money
10% down · 12.0% · 12mo
- Down + closing
- —
- Monthly P&I
- —
- Monthly cashflow
- —
- DSCR
- —
- Eligible?
- —
Short-term bridge; refi at stabilization.
Listing history 16 events
-
2026-06-09days on market $3,600,000 Active 63 DOM
-
2026-06-08days on market $3,600,000 Active 62 DOM
-
2026-06-07days on market $3,600,000 Active 61 DOM
-
2026-06-04days on market $3,600,000 Active 58 DOM
-
2026-06-03days on market $3,600,000 Active 57 DOM
-
2026-06-02days on market $3,600,000 Active 56 DOM
-
2026-06-01days on market $3,600,000 Active 55 DOM
-
2026-05-31days on market $3,600,000 Active 54 DOM
-
2026-04-07$3,600,000 Active 494-char remark
Show marketing remark (494 chars)
1042 Wilcox Ave, a FULLY VACANT 38 unit apartment building located in the heart of Hollywood, a highly desirable neighborhood in Los Angeles, California. Cap rate and GRM are based on the post rennovation scheduled income of the property. The property offers flexibility to operate as a hotel or multifamily building, with potential for short-term rentals. Built in 1928, the property consists of (38) bachelor units. The building is 9,880 gross square feet and sits on a 6,131 square foot lot.
-
2025-10-30Active
-
2024-09-30soldstatus $3,030,000 Sold
-
2024-08-07price $2,750,000
-
2024-07-24historical Backup Offers Accepted
-
2024-06-04price $4,100,000
-
2024-05-14price $4,700,000
-
2024-04-09$5,300,000 Active
ⓘ Source: listings_history table (triggers on properties + properties_extension) + one-shot
backfill from property_details.listing_events for pre-trigger history.
Nearby sold comps map
Loading sold comps map…
Walkable amenities ~0.75 mi
Loading nearby amenities…
Taxation est. · year 1
- Rental income
- $766,332
- − Mortgage interest
- −$201,656
- − Property taxes
- −$54,000
- − Insurance
- −$18,000
- − Repairs & maintenance
- −$61,307
- − Management
- −$61,307
- − Depreciation
- −$104,727
- Taxable income
- $265,336
- Est. tax owed @ 24.0%
- −$63,681
- After-tax cash flow
- $243,176/yr
For passive investors: Depreciation is non-cash, so a rental often shows a tax loss while cash-flowing — sheltering income. Rental losses are passive: they offset passive income freely, and up to $25,000/yr can offset ordinary (W-2) income if you actively participate and your MAGI is under $100k (phasing out to $0 by $150k); unused losses carry forward. On sale, claimed depreciation is recaptured at up to 25%, and gains may owe capital-gains tax (a 1031 exchange can defer both). Figures are a year-1 estimate at your 24.0% rate — not tax advice; consult a CPA.
Condition & rehab AI · 12 photos
This property requires extensive renovation, including exterior siding, roof, flooring, and HVAC systems. Significant repairs and maintenance are needed to bring the property up to a livable condition.
Repairs flagged
- Major exterior siding — Significant wear and tear
- Major roof — Visible signs of damage
- Major flooring — Worn and in need of replacement
- Major HVAC/mechanicals — No visible systems
Value-add opportunities
- Both exterior renovation — Enhances curb appeal and property value
- Both HVAC upgrade — Improves comfort and energy efficiency
- Both landscaping — Enhances curb appeal and property value
Renovation cost estimate screening
| Repair item | Severity | Est. cost |
|---|---|---|
| exterior siding · Significant wear and tear | Major | $15,000–50,000 |
| roof · Visible signs of damage | Major | $15,000–50,000 |
| flooring · Worn and in need of replacement | Major | $15,000–50,000 |
| HVAC/mechanicals · No visible systems | Major | $15,000–50,000 |
| Total estimated repair cost · 4 items | $60,000–200,000 |
Value-add ROI direction
- Both exterior renovation — Enhances curb appeal and property value ↑
- Both HVAC upgrade — Improves comfort and energy efficiency ↑
- Both landscaping — Enhances curb appeal and property value ↑
ⓘ Cost ranges are severity-bucket heuristics (US national rule-of-thumb). Get contractor quotes + a written scope before underwriting a rehab budget.
Schools (NCES district)
- District
- Los Angeles Unified
- NCES district ID
- 0622710
- Math proficiency
- 29% ▼ -4.00%
- Reading proficiency
- 54% ▲ 10.00%
- Median HH income
- $50,403
- Composite
- 35.67/100
- National rank
- #4875
- State rank
- #223 of 517 in CA
Livability — Los Angeles
- Score
- 68/100
- State rank
- #273
- US rank
- #9237
Category grades
Schools grade is shown separately in the Schools card above.
Census & demographics
- Census place
- Los Angeles, CA
- County
- Los Angeles County · 9,444,647 people
- City population
- 3,838,149
- Metro
- Los Angeles-Long Beach-Anaheim, CA
- Population (ZIP)
- 27,127
- Household income
- $61,454
- Rent vs Own
- Severe rent burden
- 4038.0
Population outlook (Los Angeles County) Hauer SSP2
- Today (2025)
- 10,940,515 people
- By 2030
- 11,256,481 · +2.9%
- By 2040
- 11,729,929 · +7.2%
- By 2050
- 11,948,407 · +9.2%
- By 2075
- 11,818,114 · +8.0%
- By 2100
- 10,842,928 · -0.9%
Race, ethnicity, and origin ACS 2023
- Neighborhood character
- Diverse neighborhood (Simpson 0.66)
- Race & ethnicity
- Hispanic / Latino 49% White 31% Two or more races 15% Asian 7% Black 7% Native American 2%
- Hispanic origin (detail)
- Mexican 21%
- Common ancestry
- Romanian 2% Scotch-Irish 1% Lithuanian 1%
- Foreign-born
- 39% · Canada, South Korea, Jamaica
- Languages at home
- 44% English-only · Spanish 43% Other Indo-European 4% Tagalog/Filipino 2%
Political lean MEDSL · Los Angeles
- 2024 margin
- Solid D (+32.9) · D 64.8% · R 31.9% · Other 3.3%
- 2008→2024 swing
- -7.4pp toward R · 2008: 40.4pp · 2024: 32.9pp
- All cycles
- 2024: D+32.9 2020: D+44.2 2016: D+48.0 2012: D+40.0 2008: D+40.4
Not yet ingested
- Civics
- —
Market trends
- HPI YoY
- ▼ -461.01%
- Current HPI
- 349.1001
- Rent YoY
- ▲ 0.67%
- Metro
- Los Angeles-Long Beach-Anaheim, CA
- State GDP YoY
- ▲ 3.21%
- F500 in state
- 116
Industry mix (Fortune 500 HQ in CA)
| Industry | F500 HQs | Revenue |
|---|---|---|
| Technology | 27 | $1,492B |
|
||
| Financial Services | 3 | $174B |
|
||
| Retail | 3 | $44B |
|
||
| Insurance | 3 | $26B |
|
||
| Media / Entertainment | 2 | $115B |
|
||
| Pharmaceuticals / Biotech | 2 | $62B |
|
||
Price history
-32.1% since first listed8 events — show timeline
- 2026-04-07 Listed $3,600,000 TheMLS
- 2025-10-30 Listed — TheMLS
- 2024-09-30 Sold (MLS) $3,030,000 TheMLS
- 2024-08-07 Price Changed $2,750,000 TheMLS
- 2024-07-24 Contingent — TheMLS
- 2024-06-04 Price Changed $4,100,000 TheMLS
- 2024-05-14 Price Changed $4,700,000 TheMLS
- 2024-04-09 Listed $5,300,000 TheMLS
Cash-flow waterfall
monthlySold comps — $/sqft
last 12 mo · ≤1 miLoading sold comps…