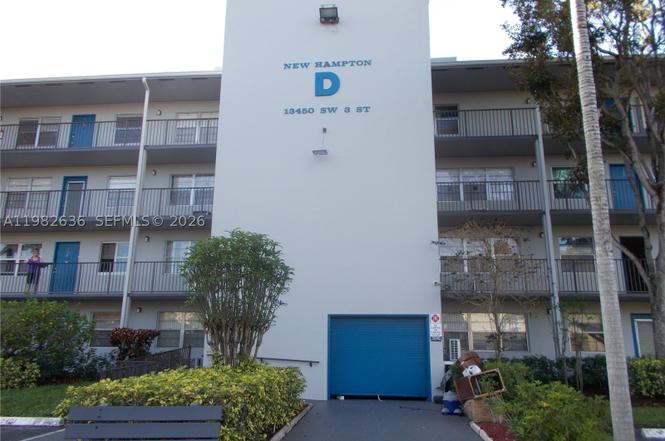
13450 SW 3rd St Unit 310D · Pembroke Pines, FL
Flood risk No data
- FEMA flood zone
- —
- Chance of flooding over 30 yrs
- —
- Est. flood insurance / yr
- —
Fire risk No data
- Est. fire insurance / yr
- —
Heat risk No data
- Hot days now (above threshold)
- —
- Hot days in 30 yrs
- —
Wind risk No data
- Chance of severe wind over 30 yrs
- —
Air-quality risk No data
- Unhealthy air days now
- —
- Unhealthy air days in 30 yrs
- —
Risk factors via First Street. Map © Google.
Why this score? — see what drove the B grade
The composite is a weighted blend of 9 inputs, each scored 0–100. Each bar is that input's sub-score; the figure is the points it added to the 100-point composite (weight × sub-score).
- Cash flow +28.7/30.0
- 1% rule +10.0/10.0
- DSCR +10.0/10.0
- ARV discount +7.5/15.0
- Livability +4.2/5.0
- Schools +4.1/10.0
- Appreciation +4.0/10.0
- Rent growth +2.5/5.0
- Condition / age +2.5/5.0
$105,000
🖨 Deal sheet 📄 Offer letter ✓ Due diligence
Listing remarks
NICE AND COZY WITH LAKE AND GULF VIEWS, ONE BEDROON, ONE BATHROOM. THIS IS AN ADULT COMMUNITY ONE RESIDENT MUST BE 55+ YEARS OF AGE AND ANY OTHER RESIDENT 18+ YEARS OF AGE, AS PER THE CONDOMINIUM ASSOCIATION RULES AND REGULATIONS. THIS COMMUNITY OFFERS FREE TRANSPORTATION, STATE OF THE ART CLUBHOUSE WITH MOVIE THEATER, POOL TABLES, BINGO AND CARDS ROOM, RESTAURANT, MEDICAL BUILDING, 24 HOURS SECURITY PATROL AND MUCH MORE. REALTORS PLEASE USE FAR/BAR-7 CONTRACTS ONLY, PREAPPROVAL LETTER, SOURCE OF FUNDS AND DEPOSIT WITH ALL YOUR OFFERS. REQUIRED AND AS PER THE SELLERS. EASY TO SHOW. PRICE TO SELL!!!!!!
Key facts
- Pool tables
- Bingo and cards room
- Lake views
Tags
Property features AI
Finance
- Other: Pets allowed with restrictions or conditional approval
- HOA & community: Monthly association fee (listed); Association covers amenities, common areas, cable TV, insurance, internet, laundry, grounds maintenance, structure maintenance, parking, pools, recreation facilities, reserve fund and roof; Association amenities include billiard room and business center; Senior community
Exterior
- Parking: Assigned parking; Guest parking; One assigned space
- Security: Complex fenced; Security guard
- Utilities: Cable available
- Home design: Condominium/attached property; Single-level unit (1 story); Building has 4 total stories; Entry level: 3
- Construction: Block construction; Resale property; Builder model with lake & gulf views
- Exterior features: Balcony; Screened balcony; On golf course; Lakefront; Has view; Faces north; Property attached; Complex fenced; Security guard
Interior
- Kitchen: Electric range; Refrigerator; Pantry
- Bedrooms: Storage room
- Flooring: Hardwood; Tile; Vinyl; Wood
- Bathrooms: 1 full bathroom
- Heating & cooling: Electric heating; Wall furnace; Ceiling fans; Electric cooling; Wall/window unit(s)
- Interior features: First-floor entry; High ceilings; Living/dining room; Main living area on entry level; Pantry; Unfurnished; Accessible elevator installed; Wheelchair access; Double-hung, metal and sliding windows
- Laundry & utility: Electric water heater
Neighborhood map
What this means for you Summary
Snapshot
- This is a 1-bed/1.0-bath condo listed at $105k.
Deal economics
- At list price, monthly cash flow is $349 ($4k/yr) — positive.
- The deal already cash-flows at list — no discount required.
- Meets the 1% rule at list price ($2k rent vs $105k).
- Recommended offer: $96k (9.0% below list) — sets the bar for market timing.
- Cap rate 10.3% vs local median 4.0% in Pembroke Pines — top-decile yield for the area; either an underpriced asset or a hidden risk that comps aren't pricing in. Stress-test before assuming the spread holds.
Location & tenants
- Location reads 83/100 on livability (#54 in FL, #933 nationally) — a professional / high-income tenant draw. Strengths: housing A+, health & safety A+, schools A-; Watch: amenities D+, cost of living D+.
- Broward (suburban): math 42% / reading 53% proficiency, ranked #46 of 73 in FL (top 63%) — families likely to look elsewhere, expect single-tenant / working-renter base with shorter leases.
- Market conditions: Rents soft (-0.2%/yr); 543 active listings in the ZIP; 21 comparable units currently listed for rent nearby; rentals at typical pace (median 15d on market — plan ~3-4 weeks tenant-placement turnaround); solid renter incomes; 2,111 units permitted in Broward County in 2024 (1,265 in 5+ unit buildings).
Forward outlook
- Local home prices are declining (-2.0%/yr); year-one equity from $726 of loan paydown is wiped out by about $2k of value loss. Plan a longer hold.
- Broward County population projected at +34% by 2050 — long-run rental-demand tailwind backs the buy-and-hold thesis.
Negotiation context
- It's been on market 97 days — a 9% lower offer ($96k) is reasonable based on typical stale-listing flexibility.
- Current owner paid $57k; list at $105k implies a 84% gain — meaningful room to come down on a strong offer.
Questions for the listing agent
- It's been on market 97 days. Have you received any prior offers? Is the seller open to a 9% concession, seller financing, or rate buy-down credit?
- What does the HOA fee cover, when was the last increase, and are there any pending special assessments or reserve-fund shortfalls?
- Any open or pending special assessments — roof, HVAC, plumbing, elevator, façade? What's the per-unit balance and payoff schedule, and is the seller paying it off at close or rolling it to the buyer?
- Why hasn't it sold? Are there any deal-killer items the seller is aware of (foundation, flood, title, zoning, code violations)?
- Is there a deadline driving the sale (1031 exchange, divorce, estate, relocation)? That informs how much negotiation room exists.
- Schools are A-rated — typically a magnet for longer-tenancy family renters. What's the average tenant stay here, and is there a school-zone premium baked into asking?
- What's the average days-on-market for RENTAL listings here right now (not sales)? A rising rental-DOM trend means longer vacancies and softer asking-rent achievability than the comps imply.
- What's the recent tenant-quality profile in this submarket — average credit score on applications, eviction rate, late-payment / NSF rate, and stable-employment percentage? A property-management company in the area should have these aggregated.
- How much new apartment / multifamily construction is in the pipeline within 1–3 miles? Heavy new supply (>2% of stock underway) typically softens rents 12–24 months out; light construction supports rent growth.
Investment metrics
- 1% rule
- 1.74% ✓
- Cap rate
- 10.28%
- Cash-on-cash
- 14.26%
- DSCR
- 1.63
- GRM
- 4.8
CMA / ARV
No comps found within radius.
Projected returns pro-forma
-2.01% appreciation · 0.0% rent growth · sell at horizon
- IRR
- 3.9%
- Equity multiple
- 1.15×
- Total profit
- $4,518
- Equity at exit
- $20,332
- IRR
- 7.9%
- Equity multiple
- 1.57×
- Total profit
- $16,799
- Equity at exit
- $17,318
Cash invested: $29,400 (down + closing). Projections, not guarantees.
Landlord ↔ Tenant lean methodology
- Overall (STATE)
- 87 Strongly Landlord-Friendly
- State Florida
- 87 Strongly Landlord-Friendly · R+3
- County
- — inherits STATE
- City
- — inherits STATE
ZIP-level market 33027
- Home prices YoY
- -0.6%
- Rents YoY
- -0.2%
- Active inventory
- 543
- Price-to-rent
- 4.8×
Monthly cashflow live
- Estimated rent
- $1,831 high interval (Pro) →
- Mortgage (P&I)
- −$551
- Tax from tax record
- −$194 /mo · $2,327/yr
- Insurance
- −$44
- HOA
- −$309
- Vacancy / Maint / Mgmt
- −$385
- Net cashflow
- $349
Break-even live
UW: 25.0% down · 7.5% · 30yr · 1.5% tax · 5.0% vac · 8.0% maint · 8.0% mgmt
Financing live
Cash to close
- Down payment
- $26,250
- Closing costs
- $3,150
- Reserves months
- —
- Total cash needed
- —
Loan-product check · same deal, 3 products live
Conventional
25% down · 7.5% · 30yr
- Down + closing
- —
- Monthly P&I
- —
- Monthly cashflow
- —
- DSCR
- —
- Eligible?
- —
Personal DTI + credit; lowest rate.
DSCR
20% down · 8.5% · 30yr
- Down + closing
- —
- Monthly P&I
- —
- Monthly cashflow
- —
- DSCR
- —
- Eligible?
- —
No personal income docs; deal must DSCR.
Hard money
10% down · 12.0% · 12mo
- Down + closing
- —
- Monthly P&I
- —
- Monthly cashflow
- —
- DSCR
- —
- Eligible?
- —
Short-term bridge; refi at stabilization.
Rent comps 21 comps
| Address | Beds | Baths | Sqft | Rent | $/sqft | DOM | Units | Dist |
|---|---|---|---|---|---|---|---|---|
| 151 SW 135th Ter Unit 108T Pembroke Pines, FL | 1.0 | 1.0 | 685 | $1,600 | $2.34 | 3d | 1 | 0.11mi |
| 800 SW 137th Ave Unit G404 Pembroke Pines, FL | 1.0 | 1.0 | 540 | $1,590 | $2.94 | 24d | 1 | 0.31mi |
| 13475 SW 9th St Unit 407A Pembroke Pines, FL | 1.0 | 1.0 | 685 | $1,550 | $2.26 | 24d | 1 | 0.33mi |
| 500 SW 145th Ave Pembroke Pines, FL | 1.0–3.0 | 1.0–2.0 | 1044 | $2,327 | $2.23 | 1d | 21 | 0.49mi |
| 1551 SW 135th Ter Pembroke Pines, FL | 1.0–2.0 | 1.5 | 752 | $1,650 | $2.19 | 14d | 2 | 0.74mi |
| 1300 SW 130th Ave Pembroke Pines, FL | 1.0–2.0 | 1.0–2.0 | 885 | $1,700 | $1.92 | 24d | 2 | 0.74mi |
| 1400 SW 124th Ter Unit 111Q Pembroke Pines, FL | — | 1.0 | 514 | $1,450 | $2.82 | 14d | 1 | 1.09mi |
| 1400 SW 124th Ter Pembroke Pines, FL | — | 1.0 | 514 | $1,500 | $2.92 | 4d | 3 | 1.09mi |
| 1400 SW 124th Ter Pembroke Pines, FL | — | 1.0 | 514 | $1,450 | $2.82 | 1d | 3 | 1.09mi |
| 1400 SW 124th Ter Pembroke Pines, FL | — | 1.0 | 514 | $1,525 | $2.97 | 5d | 2 | 1.09mi |
| 11730 SW 2nd St #12103 Pembroke Pines, FL | 1.0 | 1.0 | 690 | $2,100 | $3.04 | 8d | 1 | 1.37mi |
| 11730 SW 2nd St #12103 Pembroke Pines, FL | 1.0 | 1.0 | 690 | $2,200 | $3.19 | 21d | 1 | 1.37mi |
| 11730 SW 2nd St #12204 Pembroke Pines, FL | 1.0 | 1.0 | 690 | $2,100 | $3.04 | 24d | 1 | 1.37mi |
| 12148 Saint Andrews Pl #101 Miramar, FL | 1.0 | 1.0 | 618 | $1,800 | $2.91 | 17d | 1 | 1.39mi |
| 12148 Saint Andrews Pl #102 Miramar, FL | 1.0 | 1.0 | 618 | $1,925 | $3.11 | 8d | 1 | 1.39mi |
| 12172 Saint Andrews Pl #211 Miramar, FL | 1.0 | 1.0 | 618 | $1,950 | $3.16 | 15d | 1 | 1.40mi |
| 220 SW 116th Ave #15203 Pembroke Pines, FL | 1.0 | 1.0 | 690 | $2,000 | $2.90 | 24d | 1 | 1.44mi |
| 220 SW 116th Ave #15203 Pembroke Pines, FL | 1.0 | 1.0 | 690 | $2,000 | $2.90 | 5d | 1 | 1.44mi |
| 151 SW 117th Ave #9306 Pembroke Pines, FL | 1.0 | 1.0 | 690 | $1,900 | $2.75 | 24d | 1 | 1.46mi |
| 12136 Saint Andrews Pl #103 Miramar, FL | 1.0 | 1.0 | 600 | $1,750 | $2.92 | 19d | 1 | 1.46mi |
| 2061 Renaissance Blvd #107 Miramar, FL | 1.0 | 1.0 | 700 | $1,925 | $2.75 | 8d | 1 | 1.49mi |
HOA detail condo
- Monthly dues
- $309 · $3,708/yr
- Likely covers
- poolsecurity
- Assessments
- None detected in remarks — confirm with the listing agent.
Listing history 20 events
-
2026-06-18days on market $105,000 Active 97 DOM
-
2026-06-17days on market $105,000 Active 96 DOM
-
2026-06-16days on market $105,000 Active 95 DOM
-
2026-06-15days on market $105,000 Active 94 DOM
-
2026-06-13days on market $105,000 Active 92 DOM
-
2026-06-09days on market $105,000 Active 88 DOM
-
2026-06-08days on market $105,000 Active 87 DOM
-
2026-06-07pricedays on market $105,000 Active 86 DOM
-
2026-06-04days on market $120,000 Active 83 DOM
-
2026-06-03days on market $120,000 Active 82 DOM
-
2026-06-02days on market $120,000 Active 81 DOM
-
2026-06-01days on market $120,000 Active 80 DOM
-
2026-05-31days on market $120,000 Active 79 DOM
-
2026-04-26price $120,000
-
2026-04-21price $125,000
-
2026-04-17price $130,000
-
2026-03-27price $135,000
-
2026-03-13$140,000 Active
-
2004-03-09soldstatus $57,000
-
1998-05-13soldstatus $32,000
ⓘ Source: listings_history table (triggers on properties + properties_extension) + one-shot
backfill from property_details.listing_events for pre-trigger history.
Tax reassessment forecast FL · Resets to sale price
- Current annual tax
- $2,327 · $194/mo
- Projected year-2 tax
- $2,327 · $194/mo
- Expected delta
- $0/yr ($0/mo · 0.0%)
ⓘ Screening estimate from a state-policy table — verify with the county assessor before closing.
Nearby sold comps map
Loading sold comps map…
Walkable amenities ~0.75 mi
Loading nearby amenities…
Taxation est. · year 1
- Rental income
- $21,974
- − Mortgage interest
- −$5,882
- − Property taxes
- −$2,327
- − Insurance
- −$525
- − Repairs & maintenance
- −$1,758
- − Management
- −$1,758
- − HOA
- −$3,708
- − Depreciation
- −$3,055
- Taxable income
- $2,962
- Est. tax owed @ 24.0%
- −$711
- After-tax cash flow
- $3,481/yr
For passive investors: Depreciation is non-cash, so a rental often shows a tax loss while cash-flowing — sheltering income. Rental losses are passive: they offset passive income freely, and up to $25,000/yr can offset ordinary (W-2) income if you actively participate and your MAGI is under $100k (phasing out to $0 by $150k); unused losses carry forward. On sale, claimed depreciation is recaptured at up to 25%, and gains may owe capital-gains tax (a 1031 exchange can defer both). Figures are a year-1 estimate at your 24.0% rate — not tax advice; consult a CPA.
Schools (NCES district)
- District
- Broward
- NCES district ID
- 1200180
- Math proficiency
- 42% ▼ -18.00%
- Reading proficiency
- 53% ▼ -5.00%
- Median HH income
- $52,139
- Composite
- 40.88/100
- National rank
- #3621
- State rank
- #46 of 73 in FL
Livability — Pembroke Pines
- Score
- 83/100
- State rank
- #54
- US rank
- #933
Category grades
Schools grade is shown separately in the Schools card above.
Census & demographics
- Census place
- Pembroke Pines, FL
- County
- Broward County · 1,963,430 people
- City population
- 180,224
- Metro
- Miami-Fort Lauderdale-Pompano Beach, FL
- Population (ZIP)
- 65,116
- Household income
- $76,561
- Rent vs Own
- Severe rent burden
- 1728.0
Population outlook (Broward County) Hauer SSP2
- Today (2025)
- 2,207,033 people
- By 2030
- 2,360,704 · +7.0%
- By 2040
- 2,661,208 · +20.6%
- By 2050
- 2,946,698 · +33.5%
- By 2075
- 3,602,273 · +63.2%
- By 2100
- 3,970,984 · +79.9%
Race, ethnicity, and origin ACS 2023
- Neighborhood character
- Diverse neighborhood (Simpson 0.65)
- Race & ethnicity
- Hispanic / Latino 52% Two or more races 23% Black 22% White 16% Asian 6%
- Hispanic origin (detail)
- Puerto Rican 6% Cuban 19% Dominican 3%
- Common ancestry
- Hispanic 6% Romanian 1% Scotch-Irish 1%
- Foreign-born
- 47% · Canada, Jamaica, Vietnam
- Languages at home
- 40% English-only · Spanish 47% French/Haitian/Cajun 5% Other Indo-European 2%
Political lean MEDSL · Broward
- 2024 margin
- D (+17.0) · D 58.0% · R 41.0%
- 2008→2024 swing
- -17.8pp toward R · 2008: 34.7pp · 2024: 17.0pp
- All cycles
- 2024: D+17.0 2020: D+29.8 2016: D+35.0 2012: D+34.9 2008: D+34.7
Not yet ingested
- Civics
- —
Market trends
- HPI YoY
- ▼ -2.01%
- Current HPI
- 359.5973
- Rent YoY
- ▼ -0.20%
- Metro
- Miami-Fort Lauderdale-Pompano Beach, FL
- State GDP YoY
- ▲ 3.28%
- F500 in state
- 36
Industry mix (Fortune 500 HQ in FL)
| Industry | F500 HQs | Revenue |
|---|---|---|
| Industrial Technology | 2 | $29B |
|
||
| Insurance | 2 | $17B |
|
||
| Retail | 1 | $60B |
|
||
| Technology Distribution | 1 | $58B |
|
||
| Homebuilding | 1 | $35B |
|
||
| Technology Manufacturing | 1 | $35B |
|
||
Price history
+275.0% since first listed7 events — show timeline
- 2026-04-26 Price Changed $120,000 MARMLS
- 2026-04-21 Price Changed $125,000 MARMLS
- 2026-04-17 Price Changed $130,000 MARMLS
- 2026-03-27 Price Changed $135,000 MARMLS
- 2026-03-13 Listed $140,000 MARMLS
- 2004-03-09 Sold (Public Records) $57,000 Public Records
- 1998-05-13 Sold (Public Records) $32,000 Public Records
Property tax history
+7.4%/yrLatest (2025): $2,327 · -3.7% YoY. Source: county tax records.
Cash-flow waterfall
monthlySold comps — $/sqft
last 12 mo · ≤1 miLoading sold comps…