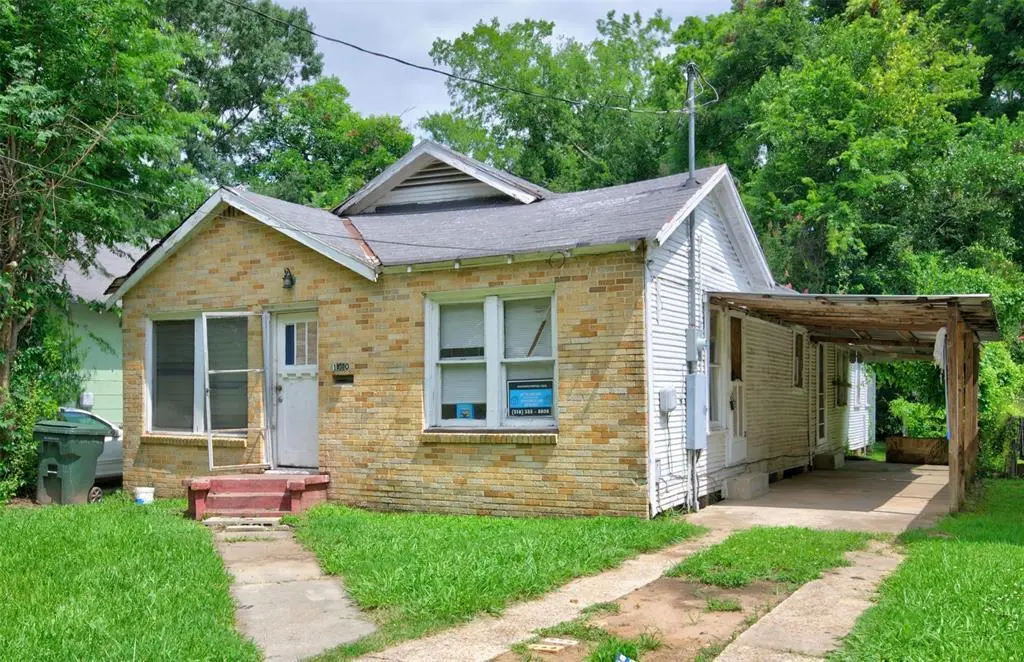
1920 Abbie St · Shreveport, LA
Flood risk 6/10 · Moderate
- FEMA flood zone
- AE
- Chance of flooding over 30 yrs
- 0.69%
- Est. flood insurance / yr
- $1,737 – $8,500
Fire risk 1/10 · Minimal
- Est. fire insurance / yr
- $1,269 – $2,357
Heat risk 7/10 · Major
- Hot days now (above 110°F)
- 7 days/yr
- Hot days in 30 yrs
- 22 days/yr
Wind risk 6/10 · Moderate
- Chance of severe wind over 30 yrs
- 66.0%
Air-quality risk 2/10 · Minimal
- Unhealthy air days now
- 1 days/yr
- Unhealthy air days in 30 yrs
- 1 days/yr
Risk factors via First Street. Map © Google.
Why this score? — see what drove the C+ grade
The composite is a weighted blend of 9 inputs, each scored 0–100. Each bar is that input's sub-score; the figure is the points it added to the 100-point composite (weight × sub-score).
- Cash flow +29.2/30.0
- DSCR +10.0/10.0
- 1% rule +8.2/10.0
- Appreciation +4.9/10.0
- Livability +3.0/5.0
- Rent growth +2.5/5.0
- Condition / age +2.5/5.0
- Schools +2.2/10.0
- ARV discount +0.0/15.0
$64,000
🖨 Deal sheet 📄 Offer letter ✓ Due diligence
Listing remarks
3 bedroom, 1 bath. 1,355 sq. ft. Potential for rental property.
Key facts
- 5,009 sq ft lot
- Parking
- Built 1950
Property features AI
Finance
- Other: Property listed as active and for sale; Listing broker: Century 21 Elite
- Financial info: Treat as clear loan type; No second mortgage
- HOA & community: No homeowners association
Exterior
- Parking: 1 covered/carport space; Driveway
- Utilities: City water; City sewer; Not in a municipal utility district
- Home design: Single family residence; Residential property; Attached: Yes; Built in 1950
- Construction: Year built: 1950
- Exterior features: Lot smaller than 0.5 acre (about 0.115 acres); Subdivision: Mayfair Sub
Interior
- Kitchen: No appliances listed
- Bedrooms: 3 bedrooms (all on the main level)
- Bathrooms: 1 full bathroom
- Heating & cooling: Heating: Other; No cooling system
- Interior features: One-level layout; One living area and one dining area; Other interior features
- Laundry & utility: No laundry appliances listed
Neighborhood map
What this means for you Summary
Snapshot
- This is a 3-bed/1.0-bath single-family listed at $64k.
Deal economics
- At list price, monthly cash flow is $-203 ($-2k/yr) — negative.
- To cash-flow at today's rent, offer at most $35k (45.8% below list).
- Meets the 1% rule at list price ($843 rent vs $64k).
- Recommended offer: $35k (45.8% below list) — sets the bar for cash-flow.
- Cap rate 10.5% vs local median 5.7% in Shreveport — top-decile yield for the area; either an underpriced asset or a hidden risk that comps aren't pricing in. Stress-test before assuming the spread holds.
Location & tenants
- Location reads 59/100 on livability (#270 in LA) — a working-class tenant base; expect higher turnover. Strengths: cost of living A+, housing A; Watch: schools D+, crime F, amenities F.
- Caddo Parish (urban): math 21% / reading 32% proficiency, ranked #53 of 98 in LA (top 54%) — low school quality limits family demand, transient renter base, plan for 1-2y turnover; 64% free/reduced lunch — lower-income household profile, screen leases tightly.
- Market conditions: 69 active listings in the ZIP; 9 comparable units currently listed for rent nearby; rentals at typical pace (median 21d on market — plan ~3-4 weeks tenant-placement turnaround); 44% of comp listings sitting > 30 days — soft ceiling on asking rent; 221 units permitted in Caddo Parish in 2024 (0 in 5+ unit buildings).
Forward outlook
- In year one you build about $336 of equity ($442 loan paydown + $-106 appreciation (-0.2% local appreciation)).
- Caddo County population projected at -15% by 2050 — secular population decline; favor cash flow + early exit over multi-decade hold.
Negotiation context
- Only 1 days on market — expect competitive offers; lowballing is unlikely to land.
Risks & watch-outs
- Watch-outs: flood insurance adds $427/mo; built in 1950 — expect roof / HVAC / electrical / plumbing capex.
- Climate carrying-cost: in FEMA flood zone AE (mandatory federal flood insurance); major wind risk, 66% chance of damaging wind over 30y; extreme-heat days projected 7→22/yr by 2055 (HVAC capex compounding) — expect insurance premiums to compound above CPI over the hold.
Questions for the listing agent
- What do current leases actually rent for vs. the listed asking? Can we see a recent rent roll and the last 12 months of T-12 income?
- Built in 1950 — when were the roof, HVAC, electrical panel, plumbing, and water heater last replaced?
- What's the actual annual flood-insurance premium (NFIP or private), and is the property in a SFHA with mandatory coverage?
- Is there a deadline driving the sale (1031 exchange, divorce, estate, relocation)? That informs how much negotiation room exists.
- Schools are D-rated, which usually means shorter tenancies and higher turnover. Who's the typical renter profile here, and what's been the actual vacancy rate?
- Crime grade is F in this area — have there been break-ins, vandalism, or insurance claims at this property in the last 3 years? What carrier currently insures it and at what premium?
- What's the average days-on-market for RENTAL listings here right now (not sales)? A rising rental-DOM trend means longer vacancies and softer asking-rent achievability than the comps imply.
- What's the recent tenant-quality profile in this submarket — average credit score on applications, eviction rate, late-payment / NSF rate, and stable-employment percentage? A property-management company in the area should have these aggregated.
- How much new for-sale + rental construction is in the pipeline within 1–3 miles? Heavy new supply typically softens prices + rents 12–24 months out; constrained supply supports both.
Investment metrics
- 1% rule
- 1.32% ✓
- Cap rate
- 10.49%
- Cash-on-cash
- 15.00%
- DSCR
- 1.67
- GRM
- 6.3
CMA / ARV
- ARV (on-the-fly)
- $46,070
- Comps found
- 6
Show comp detail 6 sales within ~0.75 mi
| Address | Dist | Beds/Ba | Sqft | Sold | Price | $/sf | Match |
|---|---|---|---|---|---|---|---|
| 2031 Ashton St | 0.31mi | 3/1.0 | 1,279 (-6%) | 1mo | $17,000 | $13 | 75 |
| 2105 Wyoming Cir | 0.25mi | 3/2.0 | 1,438 (+6%) | 10mo | $96,500 | $67 | 66 |
| 2209 Murphy St | 0.48mi | 3/1.5 | 1,187 (-12%) | 3mo | $40,000 | $34 | 53 |
| 1658 Ashton St | 0.39mi | 2/1.0 (-1) | 1,200 (-11%) | 12mo | $12,000 | $10 | 47 |
| 2751 Looney St | 0.71mi | 3/2.0 | 1,235 (-9%) | 2mo | $19,000 | $15 | 46 |
| 1514 Gary St | 0.67mi | 3/1.5 | 1,531 (+13%) | 6mo | $70,000 | $46 | 40 |
Match score weights: distance 35% · size 25% · config 20% · recency 20%. Top-matched comps best support the ARV.
Projected returns pro-forma
-0.17% appreciation · 3.0% rent growth · sell at horizon
- IRR
- -18.4%
- Equity multiple
- 0.16×
- Total profit
- $-14,998
- Equity at exit
- $18,056
- IRR
- -11.2%
- Equity multiple
- -0.16×
- Total profit
- $-20,719
- Equity at exit
- $21,287
Cash invested: $17,920 (down + closing). Projections, not guarantees.
Landlord ↔ Tenant lean methodology
- Overall (STATE)
- 90 Strongly Landlord-Friendly
- State Louisiana
- 90 Strongly Landlord-Friendly · R+12
- County
- — inherits STATE
- City
- — inherits STATE
ZIP-level market 71103
- Home prices YoY
- -0.6%
- Active inventory
- 69
- Price-to-rent
- 6.3×
Monthly cashflow live
- Estimated rent
- $843 high interval (Pro) →
- Mortgage (P&I)
- −$336
- Tax est. 1.5%
- −$80 /mo · $960/yr
- Insurance
- −$27
- Flood insurance flood zone
- −$427 /mo · $5,118/yr
- HOA
- −$0
- Vacancy / Maint / Mgmt
- −$177
- Net cashflow
- $-203
Break-even live
UW: 25.0% down · 7.5% · 30yr · 1.5% tax · 5.0% vac · 8.0% maint · 8.0% mgmt
Financing live
Cash to close
- Down payment
- $16,000
- Closing costs
- $1,920
- Reserves months
- —
- Total cash needed
- —
Loan-product check · same deal, 3 products live
Conventional
25% down · 7.5% · 30yr
- Down + closing
- —
- Monthly P&I
- —
- Monthly cashflow
- —
- DSCR
- —
- Eligible?
- —
Personal DTI + credit; lowest rate.
DSCR
20% down · 8.5% · 30yr
- Down + closing
- —
- Monthly P&I
- —
- Monthly cashflow
- —
- DSCR
- —
- Eligible?
- —
No personal income docs; deal must DSCR.
Hard money
10% down · 12.0% · 12mo
- Down + closing
- —
- Monthly P&I
- —
- Monthly cashflow
- —
- DSCR
- —
- Eligible?
- —
Short-term bridge; refi at stabilization.
Rent comps 9 comps
| Address | Beds | Baths | Sqft | Rent | $/sqft | DOM | Units | Dist |
|---|---|---|---|---|---|---|---|---|
| 1818 Perrin St Shreveport, LA | 3.0 | 1.5 | 1129 | $895 | $0.79 | 43d | 1 | 0.29mi |
| 1928 Alston St Shreveport, LA | 3.0 | 2.0 | 1100 | $750 | $0.68 | 43d | 1 | 0.48mi |
| 2712 Ashton St Shreveport, LA | 2.0 | 1.0 | 875 | $700 | $0.80 | 13d | 1 | 0.70mi |
| 2042 Laurel St Shreveport, LA | 3.0 | 1.0 | 1100 | $800 | $0.73 | 43d | 1 | 0.72mi |
| 1719 Lakeshore Dr Shreveport, LA | 3.0 | 1.5 | 1200 | $950 | $0.79 | 43d | 1 | 0.98mi |
| 624 Texas St Shreveport, LA | 2.0 | 1.5 | 953 | $2,358 | $2.47 | 13d | 2 | 1.14mi |
| 3022 Lillian St Shreveport, LA | 2.0 | 1.0 | 1115 | $695 | $0.62 | 20d | 1 | 1.34mi |
| 719 Edwards St Shreveport, LA | 1.0–2.0 | 1.0 | 810 | $1,275 | $1.57 | 20d | 7 | 1.43mi |
| 1101 College St Shreveport, LA | 2.0 | 2.0 | 1100 | $850 | $0.77 | 13d | 1 | 1.43mi |
Listing history 3 events
-
2026-06-19remarks 63-char remark
-
2026-06-18remarks 17-char remark
-
2026-06-18$64,000 Active 1 DOM
ⓘ Source: listings_history table (triggers on properties + properties_extension) + one-shot
backfill from property_details.listing_events for pre-trigger history.
Climate risk First Street
- Flood 6/10 Major FEMA zone AE · 69% chance over 30 yrs
- Wildfire 1/10 Low
- Heat 7/10 Severe 7 d/yr ≥110°F today · 22 d/yr by 30 yrs out
- Wind 6/10 Major 66% chance of damaging wind over 30 yrs
- Air quality 2/10 Low 1 unhealthy d/yr today · 1 by 30 yrs out
Nearby sold comps map
Loading sold comps map…
Walkable amenities ~0.75 mi
Loading nearby amenities…
Taxation est. · year 1
- Rental income
- $10,120
- − Mortgage interest
- −$3,585
- − Property taxes
- −$960
- − Insurance
- −$5,438
- − Repairs & maintenance
- −$810
- − Management
- −$810
- − Depreciation
- −$1,862
- Taxable loss
- −$3,345
- Est. tax savings @ 24.0%
- +$803
- After-tax cash flow
- $-1,629/yr
For passive investors: Depreciation is non-cash, so a rental often shows a tax loss while cash-flowing — sheltering income. Rental losses are passive: they offset passive income freely, and up to $25,000/yr can offset ordinary (W-2) income if you actively participate and your MAGI is under $100k (phasing out to $0 by $150k); unused losses carry forward. On sale, claimed depreciation is recaptured at up to 25%, and gains may owe capital-gains tax (a 1031 exchange can defer both). Figures are a year-1 estimate at your 24.0% rate — not tax advice; consult a CPA.
Schools (NCES district)
- District
- Caddo Parish
- NCES district ID
- 2200300
- Math proficiency
- 21% ▼ -33.00%
- Reading proficiency
- 32% ▼ -30.00%
- Median HH income
- $39,227
- Composite
- 22.23/100
- National rank
- #8148
- State rank
- #53 of 98 in LA
Livability — Shreveport
- Score
- 59/100
- State rank
- #270
- US rank
- #19730
Category grades
Schools grade is shown separately in the Schools card above.
Census & demographics
- Census place
- Shreveport, LA
- City population
- 164,123
- Population (ZIP)
- 6,142
Population outlook (Caddo County) Hauer SSP2
- Today (2025)
- 243,190 people
- By 2030
- 237,231 · -2.5%
- By 2040
- 222,502 · -8.5%
- By 2050
- 206,516 · -15.1%
- By 2075
- 165,706 · -31.9%
- By 2100
- 122,262 · -49.7%
Race, ethnicity, and origin ACS 2023
- Neighborhood character
- Predominantly Black (81%)
- Race & ethnicity
- Black 81% White 17% Hispanic / Latino 1%
- Common ancestry
- Slovak 3% Hispanic 1%
- Languages at home
- 99% English-only · Spanish 1%
Political lean MEDSL · Caddo
- 2024 margin
- Toss-up / Even · D 51.6% · R 47.0% · Other 1.4%
- 2008→2024 swing
- +1.6pp toward D · 2008: 3.0pp · 2024: 4.6pp
- All cycles
- 2024: D+4.6 2020: D+6.8 2016: D+4.2 2012: D+4.9 2008: D+3.0
Not yet ingested
- Civics
- —
Market trends
- HPI YoY
- ▼ -0.17%
- Current HPI
- 26.3904
- Rent YoY
- —
- Metro
- —
- State GDP YoY
- ▲ 3.29%
- F500 in state
- 10
Industry mix (Fortune 500 HQ in LA)
| Industry | F500 HQs | Revenue |
|---|---|---|
| Telecommunications | 2 | $23B |
|
||
| Utilities | 1 | $12B |
|
||
| Wholesale / Distribution | 1 | $5B |
|
||
| Advertising | 1 | $2B |
|
||
Price history
3 events — show timeline
- 2026-06-18 Listed $64,000 NTREIS
- 2005-07-01 Sold (Public Records) — Public Records
- 2003-07-10 Sold (Public Records) — Public Records
Property tax history
-10.5%/yrLatest (2025): $120 · +0.4% YoY. Source: county tax records.
Cash-flow waterfall
monthlySold comps — $/sqft
last 12 mo · ≤1 miLoading sold comps…