 Duplex
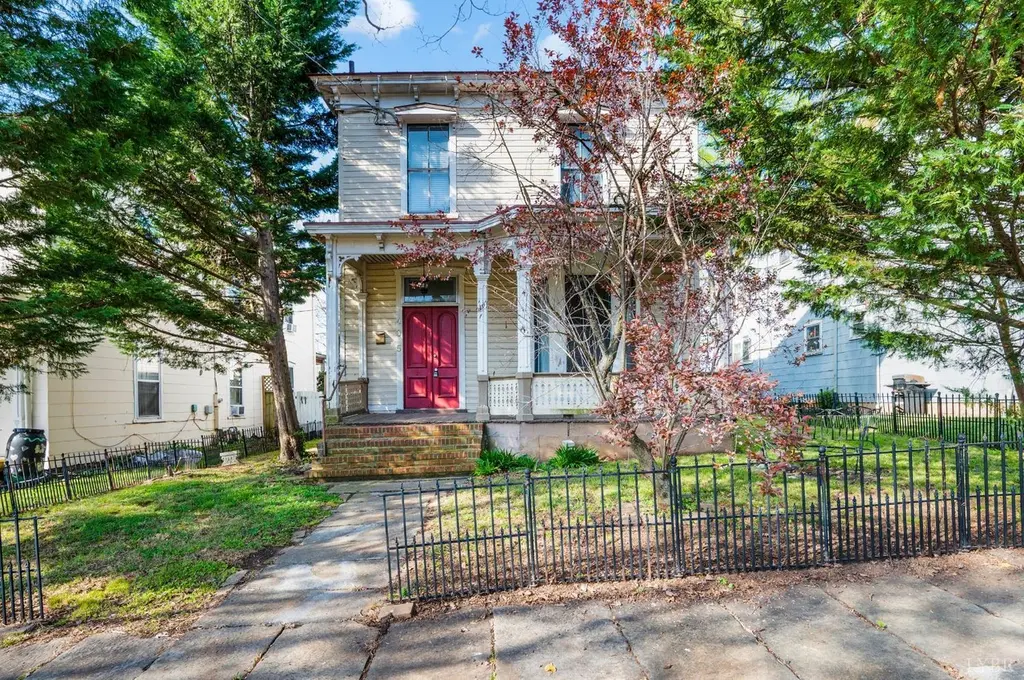
405 Harrison St · Lynchburg, VA
Flood risk 1/10 · Minimal
- FEMA flood zone
- X (unshaded)
- Chance of flooding over 30 yrs
- 0.0%
- Est. flood insurance / yr
- $507 – $1,088
Fire risk 3/10 · Minor
- Est. fire insurance / yr
- $666 – $1,236
Heat risk 6/10 · Moderate
- Hot days now (above 102°F)
- 7 days/yr
- Hot days in 30 yrs
- 19 days/yr
Wind risk 2/10 · Minimal
- Chance of severe wind over 30 yrs
- 2.0%
Air-quality risk 2/10 · Minimal
- Unhealthy air days now
- 0 days/yr
- Unhealthy air days in 30 yrs
- 1 days/yr
Risk factors via First Street. Map © Google.
Why this score? — see what drove the C- grade
The composite is a weighted blend of 9 inputs, each scored 0–100. Each bar is that input's sub-score; the figure is the points it added to the 100-point composite (weight × sub-score).
- Cash flow +18.6/30.0
- ARV discount +7.5/15.0
- DSCR +5.9/10.0
- Livability +4.5/5.0
- Schools +4.0/10.0
- 1% rule +3.8/10.0
- Rent growth +3.6/5.0
- Condition / age +2.5/5.0
- Appreciation +0.0/10.0
$339,900
🖨 Deal sheet 📄 Offer letter ✓ Due diligence
Multi-family units
County records classify this as Multi-Family (2-4 Unit). Listing-text estimate: 2 units. confirmed
Listing remarks MLS
This rare historic duplex in Garland Hill Historic District is an amazing opportunity to live in one unit and rent out the other OR own a tenant ready investment property in Downtown Lynchburg. Built in 1885 this home is full of original restored charm including refinished heart pine floors, arched doorways, and sky high ceilings, all with the modern updates you're looking for including: new standing seam metal roof, updated electrical, heat pumps, new hot water heaters, modern kitchens with granite counters and stainless steel appliances and in unit laundry! Each Unit is over 1000 square feet, the first floor with 3 bedrooms and 2 full baths, and upstairs with 3 bedrooms and 3 full baths. Each unit has its own expansive primary suite with tub and walk in shower. Don't miss the first floor's access to large back porch! the backyard also features a garage space perfect for storage. The cherry on top is this home has reduced taxes through the city rehab program through 6/20/2034!
Key facts
- Arched doorways
- Sky high ceilings
- Historic duplex
Tags
Neighborhood map
What this means for you Summary
Snapshot
- This is a 2 × 3-bed/2-bath units multifamily listed at $340k.
Deal economics
- At list price, monthly cash flow is $332 ($4k/yr) — positive. Per door: $166/mo.
- The deal already cash-flows at list — no discount required.
- To meet the 1% rule (rent ≥ 1% of price), the offer needs to be $298k (12.4% below list).
- Recommended offer: $298k (12.4% below list) — sets the bar for 1% rule.
- Cap rate 7.5% vs local median 4.0% in Lynchburg — top-decile yield for the area; either an underpriced asset or a hidden risk that comps aren't pricing in. Stress-test before assuming the spread holds.
Location & tenants
- Location reads 91/100 on livability (#1 in VA, #58 nationally) — a professional / high-income tenant draw. Strengths: amenities A+, commute A+, cost of living A+; Watch: crime C-, employment D+.
- Lynchburg City Public School District (urban): math 36% / reading 61% proficiency, ranked #104 of 131 in VA (top 79%) — families likely to look elsewhere, expect single-tenant / working-renter base with shorter leases; 61% free/reduced lunch — lower-income household profile, screen leases tightly.
- Market conditions: Rents rising fast (+4.6%/yr); 105 active listings in the ZIP; 472 units permitted in Lynchburg city in 2024 (240 in 5+ unit buildings).
- At $2,977/mo this rent would consume 68% of the median local household income ($53k/yr) (locally 552% of renters already pay >50% of income on rent) — very limited rent-growth headroom before tenants either downsize or default.
Forward outlook
- Local home prices are declining (-3.0%/yr); year-one equity from $2k of loan paydown is wiped out by about $10k of value loss. Plan a longer hold.
- Lynchburg County population projected at +37% by 2050 — long-run rental-demand tailwind backs the buy-and-hold thesis.
Negotiation context
- It's been on market 79 days — a 6% lower offer ($320k) is reasonable based on typical stale-listing flexibility.
- 4 sale attempts since 20y ago with the ask held roughly flat each time — persistent listings suggest the price (not the market) is what's stuck; bring a comps-based counter.
- Current owner paid $91k; list at $340k implies a 272% gain — meaningful room to come down on a strong offer.
Risks & watch-outs
- Watch-outs: built in 1885 — expect roof / HVAC / electrical / plumbing capex.
- Climate carrying-cost: extreme-heat days projected 7→19/yr by 2055 (HVAC capex compounding) — expect insurance premiums to compound above CPI over the hold.
Questions for the listing agent
- It's been on market 79 days. Have you received any prior offers? Is the seller open to a 12% concession, seller financing, or rate buy-down credit?
- Can we see the unit-by-unit rent roll, current vacancy, and any below-market leases? What's the average tenancy length?
- What capital expenditures (roof, boiler, parking lot, exteriors) have been made in the last 5 years, and what's planned in the next 2?
- Built in 1885 — when were the roof, HVAC, electrical panel, plumbing, and water heater last replaced?
- Why hasn't it sold? Are there any deal-killer items the seller is aware of (foundation, flood, title, zoning, code violations)?
- Is there a deadline driving the sale (1031 exchange, divorce, estate, relocation)? That informs how much negotiation room exists.
- Schools are A-rated — typically a magnet for longer-tenancy family renters. What's the average tenant stay here, and is there a school-zone premium baked into asking?
- What's the average days-on-market for RENTAL listings here right now (not sales)? A rising rental-DOM trend means longer vacancies and softer asking-rent achievability than the comps imply.
- What's the recent tenant-quality profile in this submarket — average credit score on applications, eviction rate, late-payment / NSF rate, and stable-employment percentage? A property-management company in the area should have these aggregated.
- How much new apartment / multifamily construction is in the pipeline within 1–3 miles? Heavy new supply (>2% of stock underway) typically softens rents 12–24 months out; light construction supports rent growth.
Investment metrics
- 1% rule
- 0.88% ✗
- Cap rate
- 7.47%
- Cash-on-cash
- 4.19%
- DSCR
- 1.19
- GRM
- 9.5
CMA / ARV
- ARV (median comp)
- $199,423
- List price
- $339,900
- Delta
- 70.44%
- Verdict
- OVERPRICED
- Comps
- 15 within 1.0 mi
Show comp detail 2 sales within ~0.75 mi
| Address | Dist | Beds/Ba | Sqft | Sold | Price | $/sf | Match |
|---|---|---|---|---|---|---|---|
| 507 Victoria Ave | 0.50mi | 6/— (+1) | 3,278 (-2%) | 6mo | $239,900 | $73 | 64 |
| 1314 Harrison St | 0.65mi | 6/— (+1) | 3,070 (-8%) | 19mo | $321,000 | $105 | 36 |
Match score weights: distance 35% · size 25% · config 20% · recency 20%. Top-matched comps best support the ARV.
Projected returns pro-forma
-3.0% appreciation · 4.56% rent growth · sell at horizon
- IRR
- -8.3%
- Equity multiple
- 0.69×
- Total profit
- $-29,334
- Equity at exit
- $50,680
- IRR
- 2.9%
- Equity multiple
- 1.22×
- Total profit
- $21,162
- Equity at exit
- $29,388
Cash invested: $95,172 (down + closing). Projections, not guarantees.
Landlord ↔ Tenant lean methodology
- Overall (STATE)
- 55 Moderately Landlord-Leaning
- State Virginia
- 55 Moderately Landlord-Leaning · D+2
- County
- — inherits STATE
- City
- — inherits STATE
ZIP-level market 24504
- Home prices YoY
- -12.7%
- Rents YoY
- 4.6%
- Active inventory
- 105
- Price-to-rent
- 19.0×
Monthly cashflow live
- Estimated rent
- $2,977 high interval (Pro) →
- Mortgage (P&I)
- −$1,782
- Tax from tax record
- −$96 /mo · $1,147/yr
- Insurance
- −$142
- HOA
- −$0
- Vacancy / Maint / Mgmt
- −$625
- Net cashflow
- $332
Break-even live
2-unit breakdown (identical units grouped — click to expand)
| Units | Beds | Baths | Est. rent |
|---|---|---|---|
| 2× units | 3 | 2 | $2,976 |
| #1 | 3 | 2 | $1,488 |
| #2 | 3 | 2 | $1,488 |
| Total (2 units) | $2,977 | ||
UW: 25.0% down · 7.5% · 30yr · 1.5% tax · 5.0% vac · 8.0% maint · 8.0% mgmt
Financing live
Cash to close
- Down payment
- $84,975
- Closing costs
- $10,197
- Reserves months
- —
- Total cash needed
- —
Loan-product check · same deal, 3 products live
Conventional
25% down · 7.5% · 30yr
- Down + closing
- —
- Monthly P&I
- —
- Monthly cashflow
- —
- DSCR
- —
- Eligible?
- —
Personal DTI + credit; lowest rate.
DSCR
20% down · 8.5% · 30yr
- Down + closing
- —
- Monthly P&I
- —
- Monthly cashflow
- —
- DSCR
- —
- Eligible?
- —
No personal income docs; deal must DSCR.
Hard money
10% down · 12.0% · 12mo
- Down + closing
- —
- Monthly P&I
- —
- Monthly cashflow
- —
- DSCR
- —
- Eligible?
- —
Short-term bridge; refi at stabilization.
Listing history 27 events
-
2026-06-19days on market $339,900 Active 79 DOM
-
2026-06-18days on market $339,900 Active 78 DOM
-
2026-06-17days on market $339,900 Active 77 DOM
-
2026-06-16days on market $339,900 Active 76 DOM
-
2026-06-15days on market $339,900 Active 75 DOM
-
2026-06-14days on market $339,900 Active 73 DOM
-
2026-06-13days on market $339,900 Active 72 DOM
-
2026-06-10days on market $339,900 Active 70 DOM
-
2026-06-09days on market $339,900 Active 69 DOM
-
2026-06-08days on market $339,900 Active 68 DOM
-
2026-06-07days on market $339,900 Active 67 DOM
-
2026-06-03days on market $339,900 Active 63 DOM
-
2026-06-02days on market $339,900 Active 62 DOM
-
2026-06-01days on market $339,900 Active 61 DOM
-
2026-05-31days on market $339,900 Active 60 DOM
-
2026-05-30days on market $339,900 Active 59 DOM
-
2026-05-12price $339,900 993-char remark
Show marketing remark (993 chars)
This rare historic duplex in Garland Hill Historic District is an amazing opportunity to live in one unit and rent out the other OR own a tenant ready investment property in Downtown Lynchburg. Built in 1885 this home is full of original restored charm including refinished heart pine floors, arched doorways, and sky high ceilings, all with the modern updates you're looking for including: new standing seam metal roof, updated electrical, heat pumps, new hot water heaters, modern kitchens with granite counters and stainless steel appliances and in unit laundry! Each Unit is over 1000 square feet, the first floor with 3 bedrooms and 2 full baths, and upstairs with 3 bedrooms and 3 full baths. Each unit has its own expansive primary suite with tub and walk in shower. Don't miss the first floor's access to large back porch! the backyard also features a garage space perfect for storage. The cherry on top is this home has reduced taxes through the city rehab program through 6/20/2034!
-
2026-04-01$354,900 Active 993-char remark
Show marketing remark (993 chars)
This rare historic duplex in Garland Hill Historic District is an amazing opportunity to live in one unit and rent out the other OR own a tenant ready investment property in Downtown Lynchburg. Built in 1885 this home is full of original restored charm including refinished heart pine floors, arched doorways, and sky high ceilings, all with the modern updates you're looking for including: new standing seam metal roof, updated electrical, heat pumps, new hot water heaters, modern kitchens with granite counters and stainless steel appliances and in unit laundry! Each Unit is over 1000 square feet, the first floor with 3 bedrooms and 2 full baths, and upstairs with 3 bedrooms and 3 full baths. Each unit has its own expansive primary suite with tub and walk in shower. Don't miss the first floor's access to large back porch! the backyard also features a garage space perfect for storage. The cherry on top is this home has reduced taxes through the city rehab program through 6/20/2034!
-
2019-06-04soldstatus $91,350 312-char remark
Show marketing remark (312 chars)
Great opportunity located in the Garland Hill Historic district. Large home listed for well below tax assessment and longing to be restored to it's once splendor in the neighborhood. This is a dual marketed property with Auction.com. All buyer's and agents are directed to submit offers directly to the web site.
-
2019-04-11$80,000 312-char remark
Show marketing remark (312 chars)
Great opportunity located in the Garland Hill Historic district. Large home listed for well below tax assessment and longing to be restored to it's once splendor in the neighborhood. This is a dual marketed property with Auction.com. All buyer's and agents are directed to submit offers directly to the web site.
-
2007-04-30historical
-
2006-10-23historical
-
2006-10-16$349,900
-
2006-10-16$349,900
-
2005-05-03soldstatus $75,000
-
2003-10-17soldstatus $68,000
-
2002-03-01soldstatus $57,000
ⓘ Source: listings_history table (triggers on properties + properties_extension) + one-shot
backfill from property_details.listing_events for pre-trigger history.
Tax reassessment forecast VA · Resets to sale price
- Current annual tax
- $1,147 · $96/mo
- Projected year-2 tax
- $2,787 · $232/mo
- Expected delta
- +$1,641/yr (+$137/mo · 143.1%)
ⓘ Screening estimate from a state-policy table — verify with the county assessor before closing.
Climate risk First Street
- Flood 1/10 Low FEMA zone X (unshaded) · 0% chance over 30 yrs
- Wildfire 3/10 Moderate
- Heat 6/10 Major 7 d/yr ≥102°F today · 19 d/yr by 30 yrs out
- Wind 2/10 Low 2% chance of damaging wind over 30 yrs
- Air quality 2/10 Low 0 unhealthy d/yr today · 1 by 30 yrs out
Nearby sold comps map
Loading sold comps map…
Walkable amenities ~0.75 mi
Loading nearby amenities…
Taxation est. · year 1
- Rental income
- $35,724
- − Mortgage interest
- −$19,040
- − Property taxes
- −$1,147
- − Insurance
- −$1,700
- − Repairs & maintenance
- −$2,858
- − Management
- −$2,858
- − Depreciation
- −$9,888
- Taxable loss
- −$1,766
- Est. tax savings @ 24.0%
- +$424
- After-tax cash flow
- $4,410/yr
For passive investors: Depreciation is non-cash, so a rental often shows a tax loss while cash-flowing — sheltering income. Rental losses are passive: they offset passive income freely, and up to $25,000/yr can offset ordinary (W-2) income if you actively participate and your MAGI is under $100k (phasing out to $0 by $150k); unused losses carry forward. On sale, claimed depreciation is recaptured at up to 25%, and gains may owe capital-gains tax (a 1031 exchange can defer both). Figures are a year-1 estimate at your 24.0% rate — not tax advice; consult a CPA.
Schools (NCES district)
- District
- Lynchburg City Public School District
- NCES district ID
- 5102340
- Math proficiency
- 36% ▼ -38.00%
- Reading proficiency
- 61% ▼ -8.00%
- Median HH income
- $39,097
- Composite
- 40.4/100
- National rank
- #3730
- State rank
- #104 of 131 in VA
Livability — Lynchburg
- Score
- 91/100
- State rank
- #1
- US rank
- #58
Category grades
Schools grade is shown separately in the Schools card above.
Census & demographics
- Census place
- Lynchburg, VA
- County
- Lynchburg City · 97,036 people
- City population
- 97,036
- Metro
- Lynchburg, VA
- Population (ZIP)
- 9,632
- Household income
- $52,571
- Rent vs Own
- Severe rent burden
- 552.0
Population outlook (Lynchburg County) Hauer SSP2
- Today (2025)
- 87,977 people
- By 2030
- 93,626 · +6.4%
- By 2040
- 106,145 · +20.7%
- By 2050
- 120,783 · +37.3%
- By 2075
- 162,249 · +84.4%
- By 2100
- 191,358 · +117.5%
Race, ethnicity, and origin ACS 2023
- Neighborhood character
- Diverse neighborhood (Simpson 0.57)
- Race & ethnicity
- White 51% Black 40% Two or more races 6% Hispanic / Latino 4%
- Common ancestry
- Italian 3% Lithuanian 1% Serbian 1%
- Foreign-born
- 4% · Canada, China
- Languages at home
- 95% English-only · Spanish 3% Chinese 1%
Political lean MEDSL · Lynchburg
- 2024 margin
- Lean R (+7.9) · D 45.4% · R 53.3% · Other 1.3%
- 2008→2024 swing
- -3.9pp toward R · 2008: -4.0pp · 2024: -7.9pp
- All cycles
- 2024: R+7.9 2020: D+2.6 2016: R+9.0 2012: R+10.6 2008: R+4.0
Not yet ingested
- Civics
- —
Market trends
- HPI YoY
- ▼ -33.39%
- Current HPI
- 229.4423
- Rent YoY
- ▲ 4.56%
- Metro
- Lynchburg, VA
- State GDP YoY
- ▲ 2.40%
- F500 in state
- 50
Industry mix (Fortune 500 HQ in VA)
| Industry | F500 HQs | Revenue |
|---|---|---|
| Aerospace / Defense | 4 | $236B |
|
||
| Technology / Defense | 3 | $32B |
|
||
| Financial Services | 2 | $176B |
|
||
| Utilities | 2 | $27B |
|
||
| Insurance | 2 | $25B |
|
||
| Technology | 2 | $15B |
|
||
Price history
+496.3% since first listed11 events — show timeline
- 2026-05-12 Price Changed $339,900 LMLS
- 2026-04-01 Listed $354,900 LMLS
- 2019-06-04 Sold (MLS) $91,350 LMLS
- 2019-04-11 Listed $80,000 LMLS
- 2007-04-30 Listing Removed — CAAR
- 2006-10-23 Listing Removed — MLSRV
- 2006-10-16 Listed $349,900 MLSRV
- 2006-10-16 Listed $349,900 CAAR
- 2005-05-03 Sold (Public Records) $75,000 Public Records
- 2003-10-17 Sold (Public Records) $68,000 Public Records
- 2002-03-01 Sold (Public Records) $57,000 Public Records
Property tax history
-3.8%/yrLatest (2025): $1,147 · +60.4% YoY. Source: county tax records.
Cash-flow waterfall
monthlySold comps — $/sqft
last 12 mo · ≤1 miLoading sold comps…