 7-Plex
92 W Main St · Rockville, CT
Flood risk 1/10 · Minimal
- FEMA flood zone
- X
- Chance of flooding over 30 yrs
- 0.0%
- Est. flood insurance / yr
- $473 – $860
Fire risk 1/10 · Minimal
- Est. fire insurance / yr
- $829 – $1,539
Heat risk 4/10 · Minor
- Hot days now (above 94°F)
- 8 days/yr
- Hot days in 30 yrs
- 18 days/yr
Wind risk 6/10 · Moderate
- Chance of severe wind over 30 yrs
- 27.0%
Air-quality risk 3/10 · Minor
- Unhealthy air days now
- 3 days/yr
- Unhealthy air days in 30 yrs
- 4 days/yr
Risk factors via First Street. Map © Google.
Why this score? — see what drove the B grade
The composite is a weighted blend of 9 inputs, each scored 0–100. Each bar is that input's sub-score; the figure is the points it added to the 100-point composite (weight × sub-score).
- Cash flow +30.0/30.0
- DSCR +10.0/10.0
- 1% rule +9.6/10.0
- ARV discount +7.5/15.0
- Rent growth +3.7/5.0
- Livability +3.7/5.0
- Schools +3.6/10.0
- Condition / age +2.5/5.0
- Appreciation +0.0/10.0
$925,000
🖨 Deal sheet 📄 Offer letter ✓ Due diligence
Multi-family units
County records classify this as Multi-Family (5+ Unit). Listing-text estimate: 7 units. confirmed
5+ unit building — per-unit beds/baths from public records are typically unavailable; the breakdown below (if shown) is an estimate from the listing text.
Listing remarks
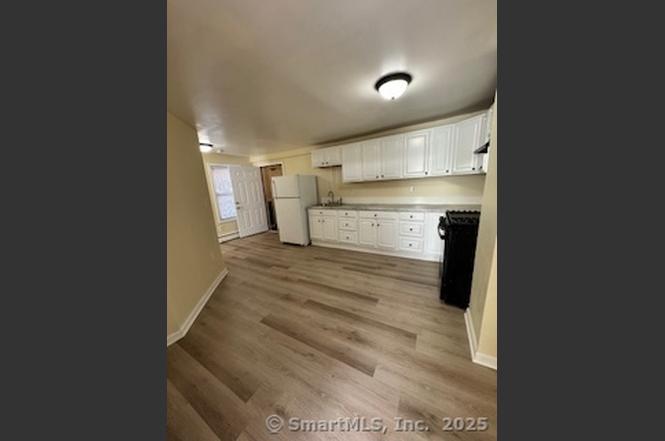
Perfect opportunity to own a fully renovated 7-unit property, with the potential to net over $14,000 a month! This centrally located building offers diverse unit sizes from 1 to 3 bedrooms, with Units 1-2 featuring 1 full bath and 1 bedroom each, Units 3-6 with 3 bedrooms and 1 full bath, and Unit 7 boasting 3 bedrooms, a bonus room and 1.5 baths. Units feature remodeled eat-in kitchens with stainless steel appliances, hardwood cabinetry, ample storage and recessed lighting. Renovations also include new electrical systems and tankless heaters installed in each unit April 2021. Energy efficiency is ensured with newer windows and gas utilities, new roof 2021, gutters 2021. Separate utilities
Key facts
- 0.37 acre lot
- 2 garage spots
- Built 1910
Neighborhood map
What this means for you Summary
Snapshot
- This is a 6×3.0bd/1.5ba + 1×1.0bd/1.0ba units multifamily listed at $925k.
Deal economics
- At list price, monthly cash flow is $5k ($56k/yr) — positive. Per door: $669/mo.
- The deal already cash-flows at list — no discount required.
- Meets the 1% rule at list price ($14k rent vs $925k).
- Recommended offer: $842k (9.0% below list) — sets the bar for market timing.
- Cap rate 12.4% vs local median 3.4% in Rockville — top-decile yield for the area; either an underpriced asset or a hidden risk that comps aren't pricing in. Stress-test before assuming the spread holds.
Location & tenants
- Location reads 73/100 on livability (#73 in CT) — a middle-class / working-renter tenant base. Strengths: health & safety A+, cost of living A, crime B+; Watch: employment D, amenities F, commute F.
- Vernon School District (suburban): math 34% / reading 48% proficiency, ranked #97 of 153 in CT (top 63%) — families likely to look elsewhere, expect single-tenant / working-renter base with shorter leases.
- Zoned schools: Rockville High School (math 22% / reading 52%, grade F, #112 of 194 statewide, top 60%, 932 students, 48% FRL).
- Market conditions: Rents rising fast (+4.7%/yr); 81 active listings in the ZIP; solid renter incomes; 1,867 units permitted in Capitol Planning Region in 2024 (1,399 in 5+ unit buildings).
- At $13,521/mo this rent would consume 190% of the median local household income ($85k/yr) (locally 1140% of renters already pay >50% of income on rent) — very limited rent-growth headroom before tenants either downsize or default.
Forward outlook
- Local home prices are declining (-3.0%/yr); year-one equity from $6k of loan paydown is wiped out by about $28k of value loss. Plan a longer hold.
- At projected returns (-3.0% appreciation + 4.7% rent growth), your $259k cash investment doubles in ~6 years — after that, you're playing with house money.
Negotiation context
- It's been on market 101 days — a 9% lower offer ($842k) is reasonable based on typical stale-listing flexibility.
- 11 sale attempts since 19y ago with the ask held roughly flat each time — persistent listings suggest the price (not the market) is what's stuck; bring a comps-based counter.
- Current owner paid $750k; 23% above their basis — modest negotiation headroom, anchor on the comps not their cost.
Risks & watch-outs
- Watch-outs: built in 1910 — expect roof / HVAC / electrical / plumbing capex.
- Climate carrying-cost: major wind risk, 27% chance of damaging wind over 30y — expect insurance premiums to compound above CPI over the hold.
Questions for the listing agent
- It's been on market 101 days. Have you received any prior offers? Is the seller open to a 9% concession, seller financing, or rate buy-down credit?
- Can we see the unit-by-unit rent roll, current vacancy, and any below-market leases? What's the average tenancy length?
- What capital expenditures (roof, boiler, parking lot, exteriors) have been made in the last 5 years, and what's planned in the next 2?
- Built in 1910 — when were the roof, HVAC, electrical panel, plumbing, and water heater last replaced?
- Why hasn't it sold? Are there any deal-killer items the seller is aware of (foundation, flood, title, zoning, code violations)?
- Is there a deadline driving the sale (1031 exchange, divorce, estate, relocation)? That informs how much negotiation room exists.
- What's the average days-on-market for RENTAL listings here right now (not sales)? A rising rental-DOM trend means longer vacancies and softer asking-rent achievability than the comps imply.
- What's the recent tenant-quality profile in this submarket — average credit score on applications, eviction rate, late-payment / NSF rate, and stable-employment percentage? A property-management company in the area should have these aggregated.
- How much new apartment / multifamily construction is in the pipeline within 1–3 miles? Heavy new supply (>2% of stock underway) typically softens rents 12–24 months out; light construction supports rent growth.
Investment metrics
- 1% rule
- 1.46% ✓
- Cap rate
- 12.37%
- Cash-on-cash
- 21.69%
- DSCR
- 1.97
- GRM
- 5.7
CMA / ARV
No comps found within radius.
Projected returns pro-forma
-3.0% appreciation · 4.73% rent growth · sell at horizon
- IRR
- 16.2%
- Equity multiple
- 1.66×
- Total profit
- $172,167
- Equity at exit
- $137,921
- IRR
- 26.0%
- Equity multiple
- 3.45×
- Total profit
- $635,464
- Equity at exit
- $79,977
Cash invested: $259,000 (down + closing). Projections, not guarantees.
Landlord ↔ Tenant lean methodology
- Overall (STATE)
- 27 Tenant-Leaning
- State Connecticut
- 27 Tenant-Leaning · D+7
- County
- — inherits STATE
- City
- — inherits STATE
ZIP-level market 06066
- Rents YoY
- 4.7%
- Active inventory
- 81
- Price-to-rent
- 38.3×
Monthly cashflow live
- Estimated rent
- $13,521 high interval (Pro) →
- Mortgage (P&I)
- −$4,851
- Tax from tax record
- −$764 /mo · $9,169/yr
- Insurance
- −$385
- HOA
- −$0
- Vacancy / Maint / Mgmt
- −$2,839
- Net cashflow
- $4,681
Break-even live
7-unit breakdown (identical units grouped — click to expand)
| Units | Beds | Baths | Est. rent |
|---|---|---|---|
| 6× units | 3.0 | 1.5 | $12,072 |
| #1 | 3.0 | 1.5 | $2,012 |
| #2 | 3.0 | 1.5 | $2,012 |
| #3 | 3.0 | 1.5 | $2,012 |
| #4 | 3.0 | 1.5 | $2,012 |
| #5 | 3.0 | 1.5 | $2,012 |
| #6 | 3.0 | 1.5 | $2,012 |
| 1× unit | 1.0 | 1 | $1,450 |
| Total (7 units) | $13,521 | ||
UW: 25.0% down · 7.5% · 30yr · 1.5% tax · 5.0% vac · 8.0% maint · 8.0% mgmt
Financing live
Cash to close
- Down payment
- $231,250
- Closing costs
- $27,750
- Reserves months
- —
- Total cash needed
- —
Loan-product check · same deal, 3 products live
Conventional
25% down · 7.5% · 30yr
- Down + closing
- —
- Monthly P&I
- —
- Monthly cashflow
- —
- DSCR
- —
- Eligible?
- —
Personal DTI + credit; lowest rate.
DSCR
20% down · 8.5% · 30yr
- Down + closing
- —
- Monthly P&I
- —
- Monthly cashflow
- —
- DSCR
- —
- Eligible?
- —
No personal income docs; deal must DSCR.
Hard money
10% down · 12.0% · 12mo
- Down + closing
- —
- Monthly P&I
- —
- Monthly cashflow
- —
- DSCR
- —
- Eligible?
- —
Short-term bridge; refi at stabilization.
Listing history 31 events
-
2026-01-29status Under Contract
-
2025-11-18historical Under Contract - Continue to Show
-
2025-10-21$925,000 Active
-
2025-10-17historical $925,000
-
2025-06-09historical
-
2025-04-29status Active
-
2025-04-29price $899,900
-
2025-03-20historical Under Contract - Continue to Show
-
2025-01-27$949,000 Active
-
2024-12-19historical
-
2024-07-30status Under Contract
-
2024-07-01status Active
-
2024-06-24historical Under Contract - Continue to Show
-
2024-06-18status Active
-
2024-06-17historical Under Contract - Continue to Show
-
2024-06-07$949,000 Active
-
2022-02-07soldstatus $750,000
-
2022-01-31soldstatus $750,000 Closed
-
2021-09-30status Active
-
2021-06-10$749,900 Active
-
2019-11-04soldstatus $390,000
-
2019-10-31soldstatus $390,000 Closed
-
2019-09-27status Under Contract
-
2019-09-23historical
-
2019-07-09$405,000 Active
-
2019-01-11historical
-
2018-12-12$499,900 Active
-
2008-12-30soldstatus $600,000
-
2007-11-05soldstatus $125,000
-
2007-10-30soldstatus $125,000
-
2007-09-18$119,900
ⓘ Source: listings_history table (triggers on properties + properties_extension) + one-shot
backfill from property_details.listing_events for pre-trigger history.
Tax reassessment forecast CT · Partial reset (capped growth)
- Current annual tax
- $9,169 · $764/mo
- Projected year-2 tax
- $14,482 · $1,207/mo
- Expected delta
- +$5,313/yr (+$443/mo · 57.9%)
ⓘ Screening estimate from a state-policy table — verify with the county assessor before closing.
Climate risk First Street
- Flood 1/10 Low FEMA zone X · 0% chance over 30 yrs
- Wildfire 1/10 Low
- Heat 4/10 Moderate 8 d/yr ≥94°F today · 18 d/yr by 30 yrs out
- Wind 6/10 Major 27% chance of damaging wind over 30 yrs
- Air quality 3/10 Moderate 3 unhealthy d/yr today · 4 by 30 yrs out
Nearby sold comps map
Loading sold comps map…
Walkable amenities ~0.75 mi
Loading nearby amenities…
Taxation est. · year 1
- Rental income
- $162,252
- − Mortgage interest
- −$51,814
- − Property taxes
- −$9,169
- − Insurance
- −$4,625
- − Repairs & maintenance
- −$12,980
- − Management
- −$12,980
- − Depreciation
- −$26,909
- Taxable income
- $43,774
- Est. tax owed @ 24.0%
- −$10,506
- After-tax cash flow
- $45,670/yr
For passive investors: Depreciation is non-cash, so a rental often shows a tax loss while cash-flowing — sheltering income. Rental losses are passive: they offset passive income freely, and up to $25,000/yr can offset ordinary (W-2) income if you actively participate and your MAGI is under $100k (phasing out to $0 by $150k); unused losses carry forward. On sale, claimed depreciation is recaptured at up to 25%, and gains may owe capital-gains tax (a 1031 exchange can defer both). Figures are a year-1 estimate at your 24.0% rate — not tax advice; consult a CPA.
Schools (NCES district)
- District
- Vernon School District
- NCES district ID
- 0904680
- Math proficiency
- 34% ▼ -11.00%
- Reading proficiency
- 48% ▼ -6.00%
- Median HH income
- $60,342
- Composite
- 36.26/100
- National rank
- #4704
- State rank
- #97 of 153 in CT
Livability — Rockville
- Score
- 73/100
- State rank
- #73
- US rank
- #5355
Category grades
Schools grade is shown separately in the Schools card above.
Census & demographics
- Census place
- Rockville, CT
- County
- Tolland County · 46,815 people
- Metro
- Hartford-East Hartford-Middletown, CT
- Population (ZIP)
- 30,577
- Household income
- $85,356
- Rent vs Own
- Severe rent burden
- 1140.0
Population outlook (Capitol County) Hauer SSP2
- By 2040
- 1,063,519
Race, ethnicity, and origin ACS 2023
- Neighborhood character
- Predominantly White (71%)
- Race & ethnicity
- White 71% Hispanic / Latino 12% Two or more races 7% Asian 6% Black 5%
- Hispanic origin (detail)
- Mexican 1% Puerto Rican 9%
- Common ancestry
- Lithuanian 8% Romanian 7% Slovak 2%
- Foreign-born
- 11% · Canada, China, South Korea
- Languages at home
- 84% English-only · Spanish 6% Other Indo-European 5% Russian/Polish/Slavic 1%
Political lean MEDSL · Capitol
- 2024 margin
- Strong D (+21.9) · D 60.1% · R 38.2% · Other 1.7%
- All cycles
- 2024: D+21.9
Not yet ingested
- Civics
- —
Market trends
- HPI YoY
- ▼ -136.25%
- Current HPI
- 249.7888
- Rent YoY
- ▲ 4.73%
- Metro
- Hartford-East Hartford-Middletown, CT
- State GDP YoY
- ▲ 1.06%
- F500 in state
- 38
Industry mix (Fortune 500 HQ in CT)
| Industry | F500 HQs | Revenue |
|---|---|---|
| Industrial Machinery | 4 | $38B |
|
||
| Insurance | 3 | $71B |
|
||
| Financial Services | 2 | $25B |
|
||
| Transportation / Logistics | 2 | $18B |
|
||
| Healthcare | 1 | $247B |
|
||
| Telecommunications | 1 | $55B |
|
||
Price history
+671.5% since first listed31 events — show timeline
- 2026-01-29 Pending — Smart MLS
- 2025-11-18 Contingent — Smart MLS
- 2025-10-21 Listed $925,000 Smart MLS
- 2025-10-17 Coming Soon $925,000 Smart MLS
- 2025-06-09 Listing Removed — Smart MLS
- 2025-04-29 Relisted — Smart MLS
- 2025-04-29 Price Changed $899,900 Smart MLS
- 2025-03-20 Contingent — Smart MLS
- 2025-01-27 Listed $949,000 Smart MLS
- 2024-12-19 Listing Removed — Smart MLS
- 2024-07-30 Pending — Smart MLS
- 2024-07-01 Relisted — Smart MLS
- 2024-06-24 Contingent — Smart MLS
- 2024-06-18 Relisted — Smart MLS
- 2024-06-17 Contingent — Smart MLS
- 2024-06-07 Listed $949,000 Smart MLS
- 2022-02-07 Sold (Public Records) $750,000 Public Records
- 2022-01-31 Sold (MLS) $750,000 Smart MLS
- 2021-09-30 Relisted — Smart MLS
- 2021-06-10 Listed $749,900 Smart MLS
- 2019-11-04 Sold (Public Records) $390,000 Public Records
- 2019-10-31 Sold (MLS) $390,000 Smart MLS
- 2019-09-27 Pending — Smart MLS
- 2019-09-23 Listing Removed — Smart MLS
- 2019-07-09 Listed $405,000 Smart MLS
- 2019-01-11 Listing Removed — Smart MLS
- 2018-12-12 Listed $499,900 Smart MLS
- 2008-12-30 Sold (Public Records) $600,000 Public Records
- 2007-11-05 Sold (MLS) $125,000 Smart MLS
- 2007-10-30 Sold (Public Records) $125,000 Public Records
- 2007-09-18 Listed $119,900 Smart MLS
Property tax history
-0.1%/yrLatest (2023): $9,169 · +0.0% YoY. Source: county tax records.
Cash-flow waterfall
monthlySold comps — $/sqft
last 12 mo · ≤1 miLoading sold comps…