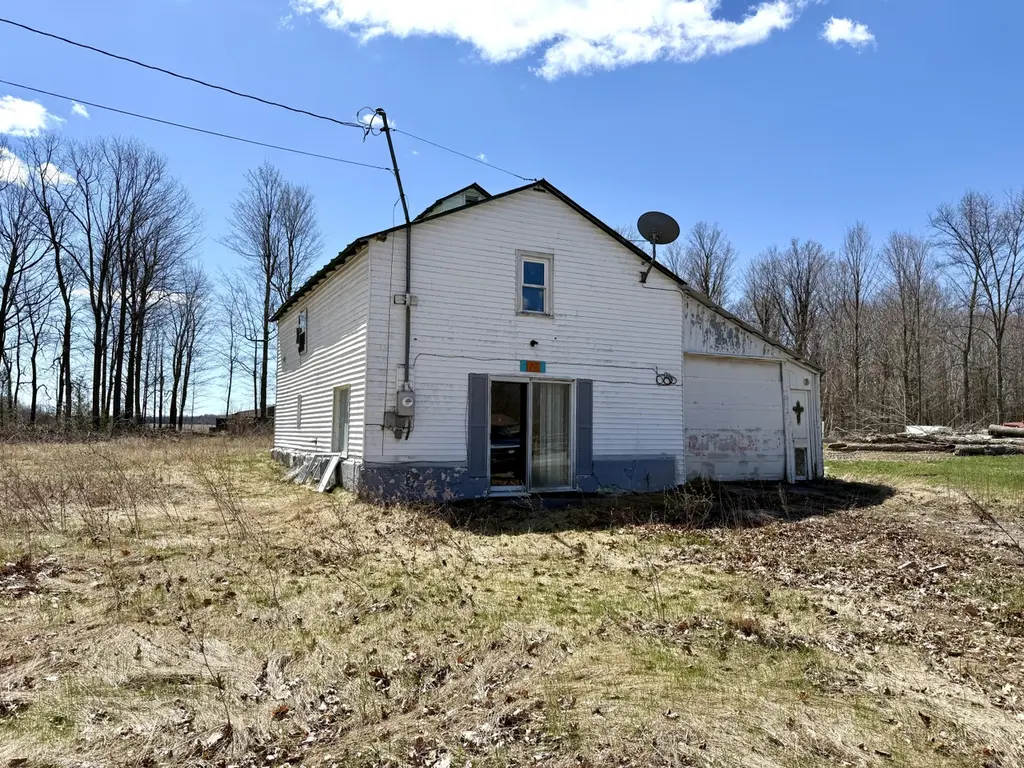
17 Oliver St · Chazy, NY
Flood risk 1/10 · Minimal
- FEMA flood zone
- X (unshaded)
- Chance of flooding over 30 yrs
- 0.0%
- Est. flood insurance / yr
- $507 – $1,088
Fire risk 1/10 · Minimal
- Est. fire insurance / yr
- $691 – $1,283
Heat risk 2/10 · Minimal
- Hot days now (above 94°F)
- 7 days/yr
- Hot days in 30 yrs
- 15 days/yr
Wind risk 1/10 · Minimal
- Chance of severe wind over 30 yrs
- 1.0%
Air-quality risk 2/10 · Minimal
- Unhealthy air days now
- 1 days/yr
- Unhealthy air days in 30 yrs
- 1 days/yr
Risk factors via First Street. Map © Google.
Why this score? — see what drove the B+ grade
The composite is a weighted blend of 9 inputs, each scored 0–100. Each bar is that input's sub-score; the figure is the points it added to the 100-point composite (weight × sub-score).
- Cash flow +30.0/30.0
- 1% rule +10.0/10.0
- DSCR +10.0/10.0
- ARV discount +7.5/15.0
- Appreciation +7.2/10.0
- Schools +6.0/10.0
- Livability +3.4/5.0
- Rent growth +2.5/5.0
- Condition / age +2.5/5.0
$29,000
🖨 Deal sheet 📄 Offer letter ✓ Due diligence
Listing remarks
Opportunity awaits! This property offers an open floor plan and flexible layout with potential for single-level living. The first floor includes a room with a tub/shower combo and laundry hookups, which may serve as a bedroom or utility space. Upstairs features a large bedroom and an additional bonus room. Attached garage/workshop provides storage Property is a true renovation project, and is being sold ''as-is''. Water and power are currently off and will not be activated for inspections. Condition of plumbing, heating, and mechanical systems is unknown; broken pipes are present. Bring your vision and tools to transform this property into something special!
Key facts
- 0.45 acre lot
- Garage
- Built 1950
Property features AI
Exterior
- Parking: Attached garage (1 car)
- Utilities: Shared well (see remarks); Electricity available; 200+ amp electric service with circuit breakers; Sewer: unknown
- Home design: Single family residence; One and one-half stories; Fixer condition
- Construction: Vinyl siding; Wood siding; Metal roof; Slab foundation; Built as residential single-family
- Exterior features: Sliding doors; Open lot
Interior
- Kitchen: Electric water heater
- Bedrooms: 1 main-level bedroom
- Flooring: Carpet; Laminate; Other
- Bathrooms: 1 full bathroom (main level)
- Heating & cooling: Baseboard heating; Electric heating; Other heating; No cooling
- Interior features: Eat-in kitchen; Open floor plan; 6 total rooms; No basement
- Laundry & utility: Laundry on main level
Neighborhood map
What this means for you Summary
Snapshot
- This is a 2-bed/1.0-bath single-family listed at $29k.
Deal economics
- At list price, monthly cash flow is $603 ($7k/yr) — positive.
- The deal already cash-flows at list — no discount required.
- Meets the 1% rule at list price ($1k rent vs $29k).
- Recommended offer: $29k (1.5% below list) — sets the bar for market timing.
Location & tenants
- Location reads 67/100 on livability (#595 in NY) — a middle-class / working-renter tenant base. Strengths: employment A+, cost of living A+, housing A+; Watch: crime F, amenities F, commute F.
- Chazy Union Free School District (rural): math 72% / reading 65% proficiency, ranked #175 of 755 in NY (top 23%) — acceptable for families but not a draw, mixed tenant base, ~2y average lease.
- Market conditions: 18 active listings in the ZIP; 192 units permitted in Clinton County in 2024 (64 in 5+ unit buildings).
Forward outlook
- In year one you build about $2k of equity ($200 loan paydown + $1k appreciation (4.5% local appreciation)).
- Clinton County population projected at -16% by 2050 — secular population decline; favor cash flow + early exit over multi-decade hold.
- At projected returns (4.5% appreciation + 3.0% rent growth), your $8k cash investment doubles in ~1 year — after that, you're playing with house money.
Negotiation context
- It's been on market 27 days — a 2% lower offer ($29k) is reasonable based on typical stale-listing flexibility.
Risks & watch-outs
- Watch-outs: built in 1950 — expect roof / HVAC / electrical / plumbing capex.
Questions for the listing agent
- Built in 1950 — when were the roof, HVAC, electrical panel, plumbing, and water heater last replaced?
- Is there a deadline driving the sale (1031 exchange, divorce, estate, relocation)? That informs how much negotiation room exists.
- Schools are A-rated — typically a magnet for longer-tenancy family renters. What's the average tenant stay here, and is there a school-zone premium baked into asking?
- Crime grade is F in this area — have there been break-ins, vandalism, or insurance claims at this property in the last 3 years? What carrier currently insures it and at what premium?
- What's the average days-on-market for RENTAL listings here right now (not sales)? A rising rental-DOM trend means longer vacancies and softer asking-rent achievability than the comps imply.
- What's the recent tenant-quality profile in this submarket — average credit score on applications, eviction rate, late-payment / NSF rate, and stable-employment percentage? A property-management company in the area should have these aggregated.
- How much new for-sale + rental construction is in the pipeline within 1–3 miles? Heavy new supply typically softens prices + rents 12–24 months out; constrained supply supports both.
Investment metrics
- 1% rule
- 3.51% ✓
- Cap rate
- 31.24%
- Cash-on-cash
- 89.09%
- DSCR
- 4.96
- GRM
- 2.4
CMA / ARV
- ARV (median comp)
- $182,323
- List price
- $29,000
- Delta
- -84.09%
- Verdict
- UNDERPRICED
- Comps
- 4 within 1.0 mi
Projected returns pro-forma
4.48% appreciation · 3.0% rent growth · sell at horizon
- IRR
- 94.4%
- Equity multiple
- 6.45×
- Total profit
- $44,243
- Equity at exit
- $15,529
- IRR
- 93.0%
- Equity multiple
- 13.44×
- Total profit
- $101,015
- Equity at exit
- $26,080
Cash invested: $8,120 (down + closing). Projections, not guarantees.
Landlord ↔ Tenant lean methodology
- Overall (STATE)
- 15 Strongly Tenant-Friendly
- State New York
- 15 Strongly Tenant-Friendly · D+10
- County
- — inherits STATE
- City
- — inherits STATE
ZIP-level market 12921
- Home prices YoY
- 1.7%
- Active inventory
- 18
- Price-to-rent
- 2.4×
Monthly cashflow live
- Estimated rent
- $1,017 medium interval (Pro) →
- Mortgage (P&I)
- −$152
- Tax est. 1.5%
- −$36 /mo · $435/yr
- Insurance
- −$12
- HOA
- −$0
- Vacancy / Maint / Mgmt
- −$214
- Net cashflow
- $603
Break-even live
UW: 25.0% down · 7.5% · 30yr · 1.5% tax · 5.0% vac · 8.0% maint · 8.0% mgmt
Financing live
Cash to close
- Down payment
- $7,250
- Closing costs
- $870
- Reserves months
- —
- Total cash needed
- —
Loan-product check · same deal, 3 products live
Conventional
25% down · 7.5% · 30yr
- Down + closing
- —
- Monthly P&I
- —
- Monthly cashflow
- —
- DSCR
- —
- Eligible?
- —
Personal DTI + credit; lowest rate.
DSCR
20% down · 8.5% · 30yr
- Down + closing
- —
- Monthly P&I
- —
- Monthly cashflow
- —
- DSCR
- —
- Eligible?
- —
No personal income docs; deal must DSCR.
Hard money
10% down · 12.0% · 12mo
- Down + closing
- —
- Monthly P&I
- —
- Monthly cashflow
- —
- DSCR
- —
- Eligible?
- —
Short-term bridge; refi at stabilization.
Listing history 1 events
-
2026-04-29$29,000 Active 666-char remark
ⓘ Source: listings_history table (triggers on properties + properties_extension) + one-shot
backfill from property_details.listing_events for pre-trigger history.
Climate risk First Street
- Flood 1/10 Low FEMA zone X (unshaded) · 0% chance over 30 yrs
- Wildfire 1/10 Low
- Heat 2/10 Low 7 d/yr ≥94°F today · 15 d/yr by 30 yrs out
- Wind 1/10 Low 100% chance of damaging wind over 30 yrs
- Air quality 2/10 Low 1 unhealthy d/yr today · 1 by 30 yrs out
Nearby sold comps map
Loading sold comps map…
Walkable amenities ~0.75 mi
Loading nearby amenities…
Taxation est. · year 1
- Rental income
- $12,201
- − Mortgage interest
- −$1,624
- − Property taxes
- −$435
- − Insurance
- −$145
- − Repairs & maintenance
- −$976
- − Management
- −$976
- − Depreciation
- −$844
- Taxable income
- $7,201
- Est. tax owed @ 24.0%
- −$1,728
- After-tax cash flow
- $5,506/yr
For passive investors: Depreciation is non-cash, so a rental often shows a tax loss while cash-flowing — sheltering income. Rental losses are passive: they offset passive income freely, and up to $25,000/yr can offset ordinary (W-2) income if you actively participate and your MAGI is under $100k (phasing out to $0 by $150k); unused losses carry forward. On sale, claimed depreciation is recaptured at up to 25%, and gains may owe capital-gains tax (a 1031 exchange can defer both). Figures are a year-1 estimate at your 24.0% rate — not tax advice; consult a CPA.
Schools (NCES district)
- District
- Chazy Union Free School District
- NCES district ID
- 3607170
- Math proficiency
- 72% ▲ 2.00%
- Reading proficiency
- 65% ▬ 0.00%
- Median HH income
- $59,672
- Composite
- 60.32/100
- National rank
- #1727
- State rank
- #175 of 755 in NY
Livability — Chazy
- Score
- 67/100
- State rank
- #595
- US rank
- #10841
Category grades
Schools grade is shown separately in the Schools card above.
Census & demographics
- City population
- 2,771
- Population (ZIP)
- 2,771
Population outlook (Clinton County) Hauer SSP2
- Today (2025)
- 78,791 people
- By 2030
- 76,848 · -2.5%
- By 2040
- 71,579 · -9.2%
- By 2050
- 66,471 · -15.6%
- By 2075
- 57,361 · -27.2%
- By 2100
- 47,232 · -40.1%
Race, ethnicity, and origin ACS 2023
- Neighborhood character
- Predominantly White (86%)
- Race & ethnicity
- White 86% Two or more races 9% Hispanic / Latino 5% Black 2%
- Common ancestry
- Lithuanian 13% Italian 2% Romanian 2%
- Foreign-born
- 4% · Canada, China, Jamaica
- Languages at home
- 95% English-only · Spanish 3% French/Haitian/Cajun 1% Chinese 1%
Political lean MEDSL · Clinton
- 2024 margin
- Toss-up / Even · D 48.9% · R 51.1%
- 2008→2024 swing
- -25.1pp toward R · 2008: 22.9pp · 2024: -2.2pp
- All cycles
- 2024: R+2.2 2020: D+5.2 2016: D+0.9 2012: D+25.6 2008: D+22.9
Not yet ingested
- Civics
- —
Market trends
- HPI YoY
- ▲ 4.48%
- Current HPI
- 270.1358
- Rent YoY
- —
- Metro
- —
- State GDP YoY
- ▲ 2.60%
- F500 in state
- 92
Industry mix (Fortune 500 HQ in NY)
| Industry | F500 HQs | Revenue |
|---|---|---|
| Financial Services | 10 | $950B |
|
||
| Consumer Goods | 9 | $162B |
|
||
| Insurance | 4 | $225B |
|
||
| Telecommunications | 2 | $144B |
|
||
| Pharmaceuticals | 2 | $112B |
|
||
| Media / Entertainment | 2 | $69B |
|
||
Price history
2 events — show timeline
- 2026-05-26 Pending — ACVMLS
- 2026-04-29 Listed $29,000 ACVMLS
Property tax history
+6.2%/yrLatest (2025): $2,195 · -9.4% YoY. Source: county tax records.
Cash-flow waterfall
monthlySold comps — $/sqft
last 12 mo · ≤1 miLoading sold comps…