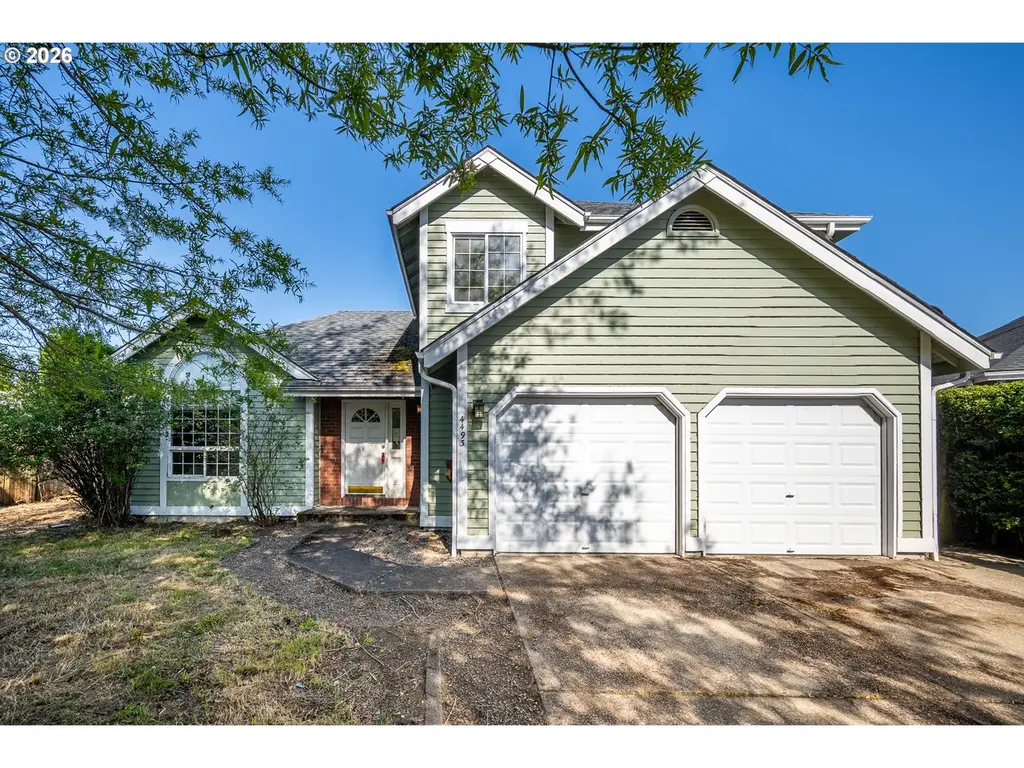
4493 Glacier St · Springfield, OR
Flood risk 1/10 · Minimal
- FEMA flood zone
- X (unshaded)
- Chance of flooding over 30 yrs
- 0.0%
- Est. flood insurance / yr
- $507 – $1,088
Fire risk 5/10 · Moderate
- Est. fire insurance / yr
- $498 – $926
Heat risk 4/10 · Minor
- Hot days now (above 91°F)
- 7 days/yr
- Hot days in 30 yrs
- 16 days/yr
Wind risk 1/10 · Minimal
- Chance of severe wind over 30 yrs
- —
Air-quality risk 10/10 · Severe
- Unhealthy air days now
- 16 days/yr
- Unhealthy air days in 30 yrs
- 19 days/yr
Risk factors via First Street. Map © Google.
Why this score? — see what drove the D grade
The composite is a weighted blend of 9 inputs, each scored 0–100. Each bar is that input's sub-score; the figure is the points it added to the 100-point composite (weight × sub-score).
- ARV discount +15.0/15.0
- Cash flow +8.9/30.0
- Livability +4.2/5.0
- Rent growth +3.3/5.0
- 1% rule +2.7/10.0
- DSCR +2.5/10.0
- Condition / age +2.5/5.0
- Schools +2.4/10.0
- Appreciation +0.0/10.0
$296,000
🖨 Deal sheet (PDF) 📄 Offer letter ✓ Due diligence
Listing remarks MLS
Well maintained home in a quiet cul-de-sac! Easy access to Clearwater Park, trails, and great schools! Large lot, fenced back yard, and newer deck. The interior features family-friendly floor plan: Large living room, formal dining area, separate fireplace/sitting room, and upstairs master suite. Roof & exterior paint just over a year old. Perfect starter or family home-- won't last long! OPEN HOUSE: 2/25, 12 - 2 pm.
Key facts
- Formal dining
- Half bath
- Large family room
Tags
Property features AI
Finance
- Other: Lot approximately 7,000 to 9,999 sq ft (about 0.2 acre); Building area approximately 1,667; No land lease; No green certification
Exterior
- Parking: Attached 2-car garage; Parking for 2 vehicles total
- Utilities: Electricity fuel; Public water; Public sewer
- Home design: Single-family residence; Residential property; Not attached to another unit; Approximately 1993 construction; Main and upper levels (two-level layout)
- Construction: Built in 1993
- Exterior features: Lap siding; Located on a cul-de-sac; Paved road access
Interior
- Kitchen: Kitchen
- Bedrooms: Primary bedroom (Upper level); 2nd bedroom; 3rd bedroom
- Bathrooms: 2 full bathrooms (both on upper level); 1 half bathroom (main level)
- Heating & cooling: Forced air heating; No cooling system listed
- Interior features: Family room; Great room; Dining room; Living room
Neighborhood map
What this means for you Summary
Snapshot
- This is a 3-bed/2.5-bath single-family listed at $296k.
Deal economics
- At list price, monthly cash flow is $-240 ($-3k/yr) — negative.
- To cash-flow at today's rent, offer at most $254k (14.3% below list).
- To meet the 1% rule (rent ≥ 1% of price), the offer needs to be $228k (23.0% below list).
- Recommended offer: $228k (23.0% below list) — sets the bar for 1% rule.
- Cap rate 5.3% vs local median 3.0% in Springfield — top-decile yield for the area; either an underpriced asset or a hidden risk that comps aren't pricing in. Stress-test before assuming the spread holds.
Location & tenants
- Location reads 83/100 on livability (#40 in OR, #934 nationally) — a professional / high-income tenant draw. Strengths: amenities A+, commute A+, housing A+; Watch: crime D+, employment D+.
- Springfield SD 19 (suburban): math 19% / reading 38% proficiency, ranked #48 of 58 in OR (top 83%) — low school quality limits family demand, transient renter base, plan for 1-2y turnover.
- Zoned schools: Mt Vernon Elementary School (math 5% / reading 34%, grade F, #366 of 412 statewide, top 91%, 412 students, 63% FRL); Agnes Stewart Middle School (math 16% / reading 36%, grade F, #101 of 128 statewide, top 80%, 513 students, 63% FRL); Springfield High School (math 30% / reading 54%, grade F, #64 of 143 statewide, top 46%, 1,317 students, 65% FRL).
- Market conditions: Rents rising (+3.4%/yr); 270 active listings in the ZIP; 7 comparable units currently listed for rent nearby; rentals at typical pace (median 16d on market — plan ~3-4 weeks tenant-placement turnaround); solid renter incomes; 1,808 units permitted in Lane County in 2024 (972 in 5+ unit buildings).
- This rent runs 34% of the median local income ($80k/yr) — at the standard rent-burdened threshold; future hikes will face affordability resistance.
Forward outlook
- Local home prices are declining (-3.0%/yr); year-one equity from $2k of loan paydown is wiped out by about $9k of value loss. Plan a longer hold.
- Lane County population projected at +15% by 2050 — long-run rental-demand tailwind backs the buy-and-hold thesis.
Negotiation context
- Only 7 days on market — expect competitive offers; lowballing is unlikely to land.
- 3 sale attempts since 22y ago with the ask held roughly flat each time — persistent listings suggest the price (not the market) is what's stuck; bring a comps-based counter.
Risks & watch-outs
- Climate carrying-cost: moderate wildfire risk — expect insurance premiums to compound above CPI over the hold.
Questions for the listing agent
- What do current leases actually rent for vs. the listed asking? Can we see a recent rent roll and the last 12 months of T-12 income?
- Is there a deadline driving the sale (1031 exchange, divorce, estate, relocation)? That informs how much negotiation room exists.
- Schools are D-rated, which usually means shorter tenancies and higher turnover. Who's the typical renter profile here, and what's been the actual vacancy rate?
- Crime grade is D in this area — have there been break-ins, vandalism, or insurance claims at this property in the last 3 years? What carrier currently insures it and at what premium?
- The area grade is low — what's the realistic commute time and amenity access for the typical tenant pool here? Any planned neighborhood developments (good or bad) we should know about?
- What's the average days-on-market for RENTAL listings here right now (not sales)? A rising rental-DOM trend means longer vacancies and softer asking-rent achievability than the comps imply.
- What's the recent tenant-quality profile in this submarket — average credit score on applications, eviction rate, late-payment / NSF rate, and stable-employment percentage? A property-management company in the area should have these aggregated.
- How much new for-sale + rental construction is in the pipeline within 1–3 miles? Heavy new supply typically softens prices + rents 12–24 months out; constrained supply supports both.
Investment metrics
- 1% rule
- 0.77% ✗
- Cap rate
- 5.32%
- Cash-on-cash
- -3.47%
- DSCR
- 0.85
- GRM
- 10.8
CMA / ARV
- ARV (median comp)
- $440,531
- List price
- $296,000
- Delta
- -32.81%
- Verdict
- UNDERPRICED
- Comps
- 20 within 1.0 mi
Show comp detail 12 sales within ~0.75 mi
| Address | Dist | Beds/Ba | Sqft | Sold | Price | $/sf | Match |
|---|---|---|---|---|---|---|---|
| 955 S 44th St | 0.13mi | 3/2.0 | 1,628 (-2%) | 2mo | $435,000 | $267 | 87 |
| 4908 Holly St | 0.40mi | 3/2.0 | 1,612 (-3%) | 3mo | $432,000 | $268 | 72 |
| 4452 Jessica Dr | 0.16mi | 3/3.0 | 1,476 (-12%) | 2mo | $460,147 | $312 | 70 |
| 1004 S 46th St | 0.19mi | 4/2.0 (+1) | 1,800 (+8%) | 4mo | $559,900 | $311 | 67 |
| 4946 Holly St | 0.48mi | 4/3.0 (+1) | 1,632 (-2%) | 0mo | $443,500 | $272 | 67 |
| 1076 S 40th Pl | 0.66mi | 3/2.0 | 1,657 (-1%) | 2mo | $495,000 | $299 | 65 |
| 1264 S 41st Pl | 0.68mi | 3/2.0 | 1,703 (+2%) | 2mo | $540,000 | $317 | 62 |
| 4155 Stellar Way | 0.59mi | 3/2.0 | 1,572 (-6%) | 2mo | $499,900 | $318 | 60 |
| 4187 Richland St | 0.55mi | 3/2.0 | 1,769 (+6%) | 5mo | $575,000 | $325 | 58 |
| 4217 Cole Way | 0.41mi | 3/3.0 | 1,854 (+11%) | 5mo | $457,625 | $247 | 56 |
| 5142 Holly St | 0.74mi | 3/3.0 | 1,743 (+5%) | 2mo | $493,990 | $283 | 54 |
| 5021 Cedar View Dr | 0.62mi | 3/2.0 | 1,800 (+8%) | 4mo | $549,000 | $305 | 52 |
Match score weights: distance 35% · size 25% · config 20% · recency 20%. Top-matched comps best support the ARV.
Projected returns pro-forma
-3.0% appreciation · 3.38% rent growth · sell at horizon
- IRR
- -21.7%
- Equity multiple
- 0.25×
- Total profit
- $-62,324
- Equity at exit
- $44,135
- IRR
- -14.5%
- Equity multiple
- 0.15×
- Total profit
- $-70,183
- Equity at exit
- $25,593
Cash invested: $82,880 (down + closing). Projections, not guarantees.
Landlord ↔ Tenant lean methodology
- Overall (STATE)
- 28 Tenant-Leaning
- State Oregon
- 28 Tenant-Leaning · D+6
- County
- — inherits STATE
- City
- — inherits STATE
ZIP-level market 97478
- Rents YoY
- 3.4%
- Active inventory
- 270
- Price-to-rent
- 10.8×
Monthly cashflow live
- Estimated rent
- $2,280 high interval (Pro) →
- Mortgage (P&I)
- −$1,552
- Tax from tax record
- −$365 /mo · $4,380/yr
- Insurance
- −$123
- HOA
- −$0
- Vacancy / Maint / Mgmt
- −$479
- Net cashflow
- $-240
Break-even live
Sensitivity live
| Price | -10% $-72 | -5% $-156 | +0% $-240 | +5% $-323 | +10% $-407 |
|---|---|---|---|---|---|
| Rent | -10% $-420 | -5% $-330 | +0% $-240 | +5% $-150 | +10% $-60 |
| Rate | -1.0pp $-91 | -0.5pp $-164 | base $-240 | +0.5pp $-316 | +1.0pp $-394 |
UW: 25.0% down · 7.5% · 30yr · 1.5% tax · 5.0% vac · 8.0% maint · 8.0% mgmt
Financing live
Cash to close
- Down payment
- $74,000
- Closing costs
- $8,880
- Reserves months
- —
- Total cash needed
- —
Loan-product check · same deal, 3 products live
Conventional
25% down · 7.5% · 30yr
- Down + closing
- —
- Monthly P&I
- —
- Monthly cashflow
- —
- DSCR
- —
- Eligible?
- —
Personal DTI + credit; lowest rate.
DSCR
20% down · 8.5% · 30yr
- Down + closing
- —
- Monthly P&I
- —
- Monthly cashflow
- —
- DSCR
- —
- Eligible?
- —
No personal income docs; deal must DSCR.
Hard money
10% down · 12.0% · 12mo
- Down + closing
- —
- Monthly P&I
- —
- Monthly cashflow
- —
- DSCR
- —
- Eligible?
- —
Short-term bridge; refi at stabilization.
Rent comps 7 comps
| Address | Beds | Baths | Sqft | Rent | $/sqft | DOM | Units | Dist |
|---|---|---|---|---|---|---|---|---|
| 1152 S 43rd Pl Springfield, OR | 3.0 | 2.5 | 1539 | $2,595 | $1.69 | 15d | 1 | 0.23mi |
| 4173 Glacier View Dr Springfield, OR | 3.0 | 2.5 | 1250 | $2,175 | $1.74 | 15d | 1 | 0.35mi |
| 339 S 42nd St Unit 317 Springfield, OR | 3.0 | 2.5 | 1444 | $1,895 | $1.31 | 15d | 1 | 0.47mi |
| 617 S 41st Ct Unit 610 Springfield, OR | 3.0 | 2.5 | 1500 | $2,050 | $1.37 | 15d | 1 | 0.48mi |
| 617 S 41st Ct Unit 606 Springfield, OR | 3.0 | 2.5 | 1500 | $2,100 | $1.40 | 15d | 1 | 0.48mi |
| 1135 Laurel Ave Springfield, OR | 4.0 | 2.0 | 1800 | $2,750 | $1.53 | 45d | 1 | 0.94mi |
| 317 30th St Springfield, OR | 2.0–3.0 | 2.0 | 1200 | $2,405 | $2.00 | 15d | 19 | 1.49mi |
Listing history 10 events
-
2026-05-07status Pending 518-char remark
-
2026-04-28$296,000 Active 518-char remark
-
2017-04-25soldstatus $275,000
Show marketing remark (423 chars)
Well maintained home in a quiet cul-de-sac! Easy access to Clearwater Park, trails, and great schools! Large lot, fenced back yard, and newer deck. The interior features family-friendly floor plan: Large living room, formal dining area, separate fireplace/sitting room, and upstairs master suite. Roof & exterior paint just over a year old. Perfect starter or family home-- won't last long! OPEN HOUSE: 2/25, 12 - 2 pm.
-
2017-04-25soldstatus $275,000 Sold 423-char remark
Show marketing remark (423 chars)
Well maintained home in a quiet cul-de-sac! Easy access to Clearwater Park, trails, and great schools! Large lot, fenced back yard, and newer deck. The interior features family-friendly floor plan: Large living room, formal dining area, separate fireplace/sitting room, and upstairs master suite. Roof & exterior paint just over a year old. Perfect starter or family home-- won't last long! OPEN HOUSE: 2/25, 12 - 2 pm.
-
2017-02-28status Pending 423-char remark
Show marketing remark (423 chars)
Well maintained home in a quiet cul-de-sac! Easy access to Clearwater Park, trails, and great schools! Large lot, fenced back yard, and newer deck. The interior features family-friendly floor plan: Large living room, formal dining area, separate fireplace/sitting room, and upstairs master suite. Roof & exterior paint just over a year old. Perfect starter or family home-- won't last long! OPEN HOUSE: 2/25, 12 - 2 pm.
-
2017-02-17$260,000 Active 423-char remark
Show marketing remark (423 chars)
Well maintained home in a quiet cul-de-sac! Easy access to Clearwater Park, trails, and great schools! Large lot, fenced back yard, and newer deck. The interior features family-friendly floor plan: Large living room, formal dining area, separate fireplace/sitting room, and upstairs master suite. Roof & exterior paint just over a year old. Perfect starter or family home-- won't last long! OPEN HOUSE: 2/25, 12 - 2 pm.
-
2004-05-17soldstatus $169,900
-
2004-04-17
-
1993-09-24soldstatus $97,100
-
1992-10-13soldstatus $229,350
ⓘ Source: listings_history table (triggers on properties + properties_extension) + one-shot
backfill from property_details.listing_events for pre-trigger history.
Tax reassessment forecast OR · Resets to sale price
- Current annual tax
- $4,380 · $365/mo
- Projected year-2 tax
- $4,380 · $365/mo
- Expected delta
- $0/yr ($0/mo · 0.0%)
ⓘ Screening estimate from a state-policy table — verify with the county assessor before closing.
Climate risk First Street
- Flood 1/10 Low FEMA zone X (unshaded) · 0% chance over 30 yrs
- Wildfire 5/10 Major
- Heat 4/10 Moderate 7 d/yr ≥91°F today · 16 d/yr by 30 yrs out
- Wind 1/10 Low
- Air quality 10/10 Extreme 16 unhealthy d/yr today · 19 by 30 yrs out
Nearby sold comps map
Loading sold comps map…
Walkable amenities ~0.75 mi
Loading nearby amenities…
Taxation est. · year 1
- Rental income
- $27,355
- − Mortgage interest
- −$16,581
- − Property taxes
- −$4,380
- − Insurance
- −$1,480
- − Repairs & maintenance
- −$2,188
- − Management
- −$2,188
- − Depreciation
- −$8,611
- Taxable loss
- −$8,073
- Est. tax savings @ 24.0%
- +$1,938
- After-tax cash flow
- $-939/yr
For passive investors: Depreciation is non-cash, so a rental often shows a tax loss while cash-flowing — sheltering income. Rental losses are passive: they offset passive income freely, and up to $25,000/yr can offset ordinary (W-2) income if you actively participate and your MAGI is under $100k (phasing out to $0 by $150k); unused losses carry forward. On sale, claimed depreciation is recaptured at up to 25%, and gains may owe capital-gains tax (a 1031 exchange can defer both). Figures are a year-1 estimate at your 24.0% rate — not tax advice; consult a CPA.
Schools (NCES district)
- District
- Springfield SD 19
- NCES district ID
- 4111670
- Math proficiency
- 19% ▼ -13.00%
- Reading proficiency
- 38% ▼ -10.00%
- Median HH income
- $42,236
- Composite
- 24.14/100
- National rank
- #7746
- State rank
- #48 of 58 in OR
Livability — Springfield
- Score
- 83/100
- State rank
- #40
- US rank
- #934
Category grades
Schools grade is shown separately in the Schools card above.
Census & demographics
- Census place
- Springfield, OR
- County
- Lane County · 310,476 people
- City population
- 76,907
- Metro
- Eugene-Springfield, OR
- Population (ZIP)
- 39,373
- Household income
- $80,086
- Rent vs Own
- Severe rent burden
- 904.0
Population outlook (Lane County) Hauer SSP2
- Today (2025)
- 391,933 people
- By 2030
- 405,860 · +3.6%
- By 2040
- 429,386 · +9.6%
- By 2050
- 452,016 · +15.3%
- By 2075
- 508,825 · +29.8%
- By 2100
- 531,208 · +35.5%
Race, ethnicity, and origin ACS 2023
- Neighborhood character
- Predominantly White (79%)
- Race & ethnicity
- White 79% Hispanic / Latino 12% Two or more races 9% Native American 1% Asian 1%
- Hispanic origin (detail)
- Mexican 9%
- Common ancestry
- Slovak 4% Lithuanian 3% Portuguese 3%
- Foreign-born
- 4% · Canada
- Languages at home
- 94% English-only · Spanish 5% Tagalog/Filipino 1%
Political lean MEDSL · Lane
- 2024 margin
- Strong D (+23.1) · D 60.0% · R 36.9% · Other 3.1%
- 2008→2024 swing
- -4.3pp toward R · 2008: 27.4pp · 2024: 23.1pp
- All cycles
- 2024: D+23.1 2020: D+24.3 2016: D+18.9 2012: D+23.4 2008: D+27.4
Not yet ingested
- Civics
- —
Market trends
- HPI YoY
- ▼ -395.83%
- Current HPI
- 302.9203
- Rent YoY
- ▲ 3.38%
- Metro
- Eugene-Springfield, OR
- State GDP YoY
- ▲ 2.05%
- F500 in state
- 2
Industry mix (Fortune 500 HQ in OR)
| Industry | F500 HQs | Revenue |
|---|---|---|
| Consumer Goods | 1 | $51B |
|
||
Price history
+29.1% since first listed10 events — show timeline
- 2026-05-07 Pending — RMLS
- 2026-04-28 Listed $296,000 RMLS
- 2017-04-25 Sold (Public Records) $275,000 Public Records
- 2017-04-25 Sold (MLS) $275,000 RMLS
- 2017-02-28 Pending — RMLS
- 2017-02-17 Listed $260,000 RMLS
- 2004-05-17 Sold (Public Records) $169,900 Public Records
- 2004-04-17 Listed — RMLS
- 1993-09-24 Sold (Public Records) $97,100 Public Records
- 1992-10-13 Sold (Public Records) $229,350 Public Records
Property tax history
+3.1%/yrLatest (2025): $4,380 · +1.6% YoY. Source: county tax records.
Cash-flow waterfall
monthlySold comps — $/sqft
last 12 mo · ≤1 miLoading sold comps…