8098 Mcgowan Rd · Copenhagen, NY
Flood risk 1/10 · Minimal
- FEMA flood zone
- —
- Chance of flooding over 30 yrs
- 0.0%
- Est. flood insurance / yr
- —
Fire risk 3/10 · Minor
- Est. fire insurance / yr
- $691 – $1,283
Heat risk 1/10 · Minimal
- Hot days now (above 87°F)
- 7 days/yr
- Hot days in 30 yrs
- 16 days/yr
Wind risk 1/10 · Minimal
- Chance of severe wind over 30 yrs
- —
Air-quality risk 2/10 · Minimal
- Unhealthy air days now
- 0 days/yr
- Unhealthy air days in 30 yrs
- 1 days/yr
Risk factors via First Street. Map © Google.
Why this score? — see what drove the C- grade
The composite is a weighted blend of 9 inputs, each scored 0–100. Each bar is that input's sub-score; the figure is the points it added to the 100-point composite (weight × sub-score).
- Cash flow +15.0/30.0
- ARV discount +7.5/15.0
- Appreciation +6.6/10.0
- 1% rule +5.0/10.0
- DSCR +5.0/10.0
- Schools +4.5/10.0
- Livability +3.1/5.0
- Rent growth +2.5/5.0
- Condition / age +2.5/5.0
$30,000
🖨 Deal sheet 📄 Offer letter ✓ Due diligence
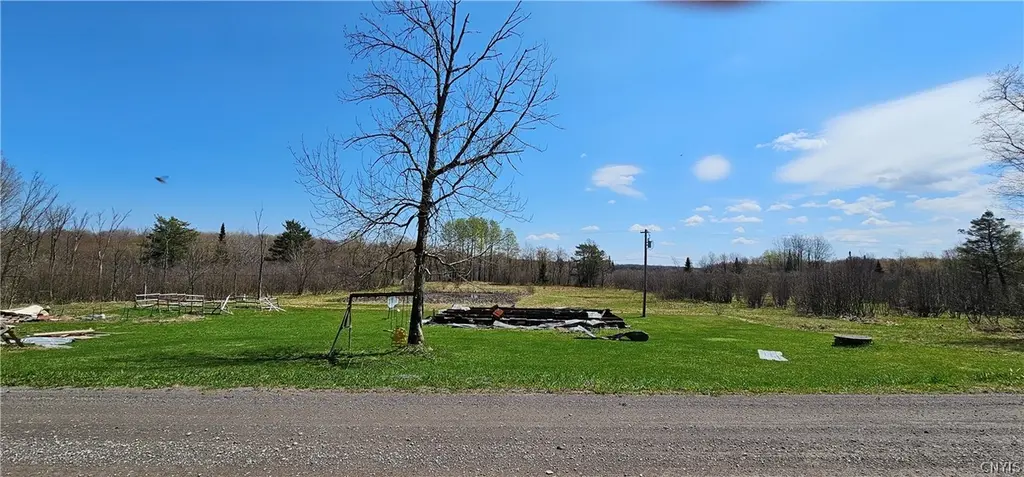
Listing remarks
Vacant land with a pond. This property is a foreclosure. Has nice scenic views. Rural Road. Excellent area for privacy.
Key facts
- Privacy
- Rural road
- Scenic views
Tags
Property features AI
Finance
- Other: Possible use: agricultural or horses
Exterior
- Parking: No driveway
- Utilities: Electricity available; High-speed internet available; Well water; Septic system
- Home design: Single-story property
- Exterior features: Rectangular, rural lot with a pond; County road frontage
Interior
- Bathrooms: 1 full bathroom
- Interior features: Level topography
Neighborhood map
What this means for you Summary
Snapshot
- This is a 3-bed/1.0-bath manufactured listed at $30k.
Deal economics
- At list price, monthly cash flow is $870 ($10k/yr) — positive.
- The deal already cash-flows at list — no discount required.
- Meets the 1% rule at list price ($1k rent vs $30k).
- Recommended offer: $29k (3.0% below list) — sets the bar for market timing.
Location & tenants
- Location reads 61/100 on livability (#914 in NY) — a middle-class / working-renter tenant base. Strengths: cost of living A+, housing A+; Watch: health & safety D, crime F, amenities F.
- Lowville Academy & Central School District (town): math 51% / reading 54% proficiency, ranked #345 of 590 in NY (top 58%) — acceptable for families but not a draw, mixed tenant base, ~2y average lease.
- Market conditions: 17 active listings in the ZIP; 110 units permitted in Lewis County in 2024 (0 in 5+ unit buildings).
Forward outlook
- In year one you build about $1k of equity ($207 loan paydown + $940 appreciation (3.1% local appreciation)).
- Lewis County population projected at -20% by 2050 — secular population decline; favor cash flow + early exit over multi-decade hold.
- At projected returns (3.1% appreciation + 3.0% rent growth), your $8k cash investment doubles in ~1 year — after that, you're playing with house money.
Negotiation context
- It's been on market 34 days — a 3% lower offer ($29k) is reasonable based on typical stale-listing flexibility.
Questions for the listing agent
- It's been on market 34 days. Have you received any prior offers? Is the seller open to a 3% concession, seller financing, or rate buy-down credit?
- Is there a deadline driving the sale (1031 exchange, divorce, estate, relocation)? That informs how much negotiation room exists.
- Crime grade is F in this area — have there been break-ins, vandalism, or insurance claims at this property in the last 3 years? What carrier currently insures it and at what premium?
- What's the average days-on-market for RENTAL listings here right now (not sales)? A rising rental-DOM trend means longer vacancies and softer asking-rent achievability than the comps imply.
- What's the recent tenant-quality profile in this submarket — average credit score on applications, eviction rate, late-payment / NSF rate, and stable-employment percentage? A property-management company in the area should have these aggregated.
- How much new for-sale + rental construction is in the pipeline within 1–3 miles? Heavy new supply typically softens prices + rents 12–24 months out; constrained supply supports both.
Investment metrics
- 1% rule
- 4.55% ✓
- Cap rate
- 41.09%
- Cash-on-cash
- 124.28%
- DSCR
- 6.53
- GRM
- 1.8
CMA / ARV
No comps found within radius.
Projected returns pro-forma
3.13% appreciation · 3.0% rent growth · sell at horizon
- IRR
- —
- Equity multiple
- 8.05×
- Total profit
- $59,254
- Equity at exit
- $13,715
- IRR
- —
- Equity multiple
- 16.84×
- Total profit
- $133,058
- Equity at exit
- $21,313
Cash invested: $8,400 (down + closing). Projections, not guarantees.
Landlord ↔ Tenant lean methodology
- Overall (STATE)
- 15 Strongly Tenant-Friendly
- State New York
- 15 Strongly Tenant-Friendly · D+10
- County
- — inherits STATE
- City
- — inherits STATE
ZIP-level market 13626
- Home prices YoY
- 1.0%
- Active inventory
- 17
- Price-to-rent
- 1.8×
Monthly cashflow live
- Estimated rent
- $1,364 medium interval (Pro) →
- Mortgage (P&I)
- −$157
- Tax est. 1.5%
- −$38 /mo · $450/yr
- Insurance
- −$12
- HOA
- −$0
- Vacancy / Maint / Mgmt
- −$286
- Net cashflow
- $870
Break-even live
UW: 25.0% down · 7.5% · 30yr · 1.5% tax · 5.0% vac · 8.0% maint · 8.0% mgmt
Financing live
Cash to close
- Down payment
- $7,500
- Closing costs
- $900
- Reserves months
- —
- Total cash needed
- —
Loan-product check · same deal, 3 products live
Conventional
25% down · 7.5% · 30yr
- Down + closing
- —
- Monthly P&I
- —
- Monthly cashflow
- —
- DSCR
- —
- Eligible?
- —
Personal DTI + credit; lowest rate.
DSCR
20% down · 8.5% · 30yr
- Down + closing
- —
- Monthly P&I
- —
- Monthly cashflow
- —
- DSCR
- —
- Eligible?
- —
No personal income docs; deal must DSCR.
Hard money
10% down · 12.0% · 12mo
- Down + closing
- —
- Monthly P&I
- —
- Monthly cashflow
- —
- DSCR
- —
- Eligible?
- —
Short-term bridge; refi at stabilization.
Listing history 17 events
-
2026-06-17status $30,000 Pending 34 DOM
-
2026-06-16days on market $30,000 Active 34 DOM
-
2026-06-15days on market $30,000 Active 33 DOM
-
2026-06-14days on market $30,000 Active 31 DOM
-
2026-06-12days on market $30,000 Active 30 DOM
-
2026-06-09days on market $30,000 Active 27 DOM
-
2026-06-08days on market $30,000 Active 26 DOM
-
2026-06-07days on market $30,000 Active 25 DOM
-
2026-06-05days on market $30,000 Active 22 DOM
-
2026-06-03days on market $30,000 Active 21 DOM
-
2026-06-02days on market $30,000 Active 20 DOM
-
2026-06-01days on market $30,000 Active 19 DOM
-
2026-05-31days on market $30,000 Active 18 DOM
-
2026-05-30days on market $30,000 Active 17 DOM
-
2026-05-13$30,000 Active
-
2018-05-07soldstatus $83,000
-
2013-06-03soldstatus $29,000
ⓘ Source: listings_history table (triggers on properties + properties_extension) + one-shot
backfill from property_details.listing_events for pre-trigger history.
Climate risk First Street
- Flood 1/10 Low 0% chance over 30 yrs
- Wildfire 3/10 Moderate
- Heat 1/10 Low 7 d/yr ≥87°F today · 16 d/yr by 30 yrs out
- Wind 1/10 Low
- Air quality 2/10 Low 0 unhealthy d/yr today · 1 by 30 yrs out
Nearby sold comps map
Loading sold comps map…
Walkable amenities ~0.75 mi
Loading nearby amenities…
Taxation est. · year 1
- Rental income
- $16,364
- − Mortgage interest
- −$1,680
- − Property taxes
- −$450
- − Insurance
- −$150
- − Repairs & maintenance
- −$1,309
- − Management
- −$1,309
- − Depreciation
- −$873
- Taxable income
- $10,592
- Est. tax owed @ 24.0%
- −$2,542
- After-tax cash flow
- $7,897/yr
For passive investors: Depreciation is non-cash, so a rental often shows a tax loss while cash-flowing — sheltering income. Rental losses are passive: they offset passive income freely, and up to $25,000/yr can offset ordinary (W-2) income if you actively participate and your MAGI is under $100k (phasing out to $0 by $150k); unused losses carry forward. On sale, claimed depreciation is recaptured at up to 25%, and gains may owe capital-gains tax (a 1031 exchange can defer both). Figures are a year-1 estimate at your 24.0% rate — not tax advice; consult a CPA.
Schools (NCES district)
- District
- Lowville Academy & Central School District
- NCES district ID
- 3617820
- Math proficiency
- 51% ▼ -9.00%
- Reading proficiency
- 54% ▼ -7.00%
- Median HH income
- $47,554
- Composite
- 44.62/100
- National rank
- #2773
- State rank
- #345 of 590 in NY
Livability — Copenhagen
- Score
- 61/100
- State rank
- #914
- US rank
- #17891
Category grades
Schools grade is shown separately in the Schools card above.
Census & demographics
- Population (ZIP)
- 2,322
Population outlook (Lewis County) Hauer SSP2
- Today (2025)
- 26,126 people
- By 2030
- 25,354 · -3.0%
- By 2040
- 23,359 · -10.6%
- By 2050
- 20,927 · -19.9%
- By 2075
- 15,533 · -40.5%
- By 2100
- 10,215 · -60.9%
Race, ethnicity, and origin ACS 2023
- Neighborhood character
- Predominantly White (91%)
- Race & ethnicity
- White 91% Two or more races 5% Hispanic / Latino 4%
- Common ancestry
- Lithuanian 7% Romanian 6% Polish 2%
- Foreign-born
- 1% · Canada, China
- Languages at home
- 93% English-only · German/W. Germanic 5% Spanish 2%
Political lean MEDSL · Lewis
- 2024 margin
- Solid R (+44.4) · D 27.8% · R 72.2%
- 2008→2024 swing
- -35.6pp toward R · 2008: -8.8pp · 2024: -44.4pp
- All cycles
- 2024: R+44.4 2020: R+39.2 2016: R+39.6 2012: R+8.7 2008: R+8.8
Not yet ingested
- Civics
- —
Market trends
- HPI YoY
- ▲ 3.13%
- Current HPI
- 303.3172
- Rent YoY
- —
- Metro
- —
- State GDP YoY
- ▲ 2.60%
- F500 in state
- 92
Industry mix (Fortune 500 HQ in NY)
| Industry | F500 HQs | Revenue |
|---|---|---|
| Financial Services | 10 | $950B |
|
||
| Consumer Goods | 9 | $162B |
|
||
| Insurance | 4 | $225B |
|
||
| Telecommunications | 2 | $144B |
|
||
| Pharmaceuticals | 2 | $112B |
|
||
| Media / Entertainment | 2 | $69B |
|
||
Price history
+3.4% since first listed3 events — show timeline
- 2026-05-13 Listed $30,000 CNYIS
- 2018-05-07 Sold (Public Records) $83,000 Public Records
- 2013-06-03 Sold (Public Records) $29,000 Public Records
Property tax history
+1.0%/yrLatest (2025): $1,835 · +2.9% YoY. Source: county tax records.
Cash-flow waterfall
monthlySold comps — $/sqft
last 12 mo · ≤1 miLoading sold comps…