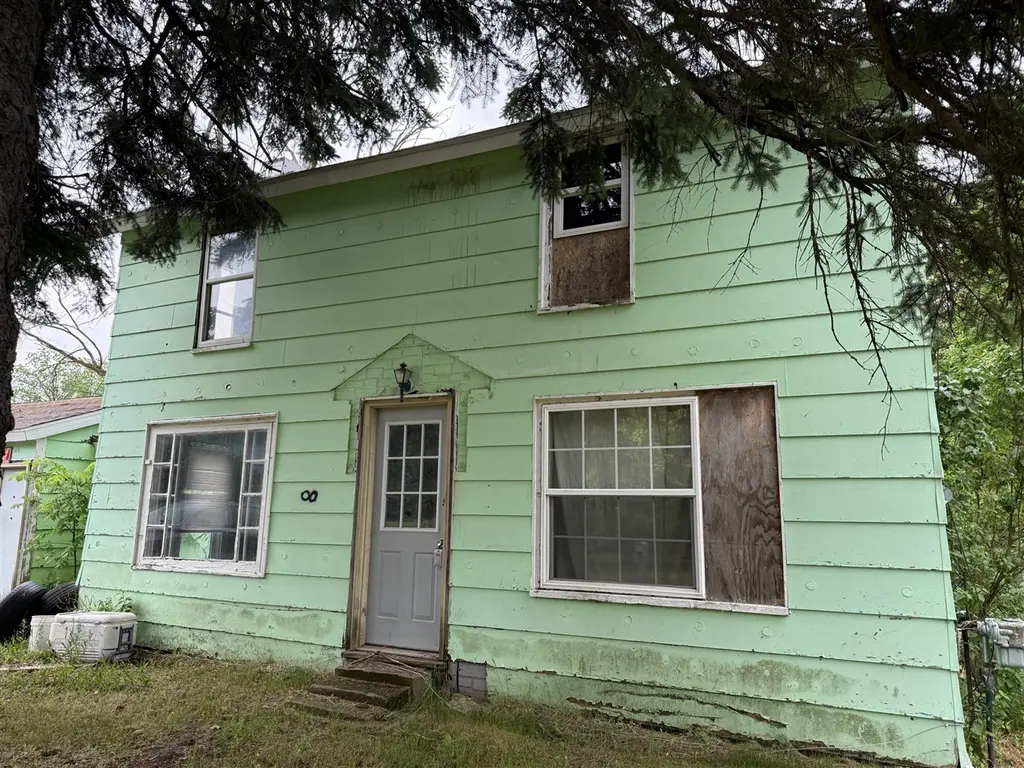
108 E North St · Edmore, MI
Flood risk 1/10 · Minimal
- FEMA flood zone
- —
- Chance of flooding over 30 yrs
- 0.0%
- Est. flood insurance / yr
- —
Fire risk 1/10 · Minimal
- Est. fire insurance / yr
- $784 – $1,456
Heat risk 2/10 · Minimal
- Hot days now (above 96°F)
- 7 days/yr
- Hot days in 30 yrs
- 14 days/yr
Wind risk 1/10 · Minimal
- Chance of severe wind over 30 yrs
- —
Air-quality risk 2/10 · Minimal
- Unhealthy air days now
- 1 days/yr
- Unhealthy air days in 30 yrs
- 3 days/yr
Risk factors via First Street. Map © Google.
Why this score? — see what drove the B+ grade
The composite is a weighted blend of 9 inputs, each scored 0–100. Each bar is that input's sub-score; the figure is the points it added to the 100-point composite (weight × sub-score).
- Cash flow +30.0/30.0
- 1% rule +10.0/10.0
- DSCR +10.0/10.0
- Appreciation +10.0/10.0
- ARV discount +7.5/15.0
- Livability +3.4/5.0
- Rent growth +2.5/5.0
- Condition / age +2.5/5.0
- Schools +2.4/10.0
$50,000
🖨 Deal sheet 📄 Offer letter ✓ Due diligence
Listing remarks MLS
This 3-bedroom, 1-bath home sits on a spacious corner lot and offers a great opportunity for buyers ready to bring their vision and tools. The property needs significant work throughout, but its layout, natural light, and lot size provide a solid foundation for renovation. Whether you're looking to restore it for personal use or add value as an investment, this home has the potential to become something special.
Key facts
- 0.8 acre lot
- Garage
- Listed 11 days
Property features AI
Exterior
- Parking: Attached garage (1 car)
- Utilities: Public water
- Home design: Single-family residence; Residential property
- Construction: Wood siding exterior; Asphalt roof; Year built not specified
- Exterior features: Corner lot; Wooded lot; Paved road access; Public water
Interior
- Bathrooms: 1 full bathroom
- Heating & cooling: Forced air heating
- Interior features: 8 total rooms; Crawl space basement
Neighborhood map
What this means for you Summary
Snapshot
- This is a 3-bed/1.0-bath single-family listed at $50k.
Deal economics
- At list price, monthly cash flow is $721 ($9k/yr) — positive.
- The deal already cash-flows at list — no discount required.
- Meets the 1% rule at list price ($1k rent vs $50k).
Location & tenants
- Location reads 67/100 on livability (#380 in MI) — a middle-class / working-renter tenant base. Strengths: cost of living A+, housing A+, crime A-; Watch: employment D, schools F, amenities F.
- Montabella Community Schools (rural): math 20% / reading 36% proficiency, ranked #396 of 540 in MI (top 73%) — low school quality limits family demand, transient renter base, plan for 1-2y turnover.
- Market conditions: 17 active listings in the ZIP; 1 comparable units currently listed for rent nearby; 273 units permitted in Montcalm County in 2024 (5 in 5+ unit buildings).
Forward outlook
- In year one you build about $5k of equity ($346 loan paydown + $5k appreciation (10.0% local appreciation)).
- Montcalm County population projected at -17% by 2050 — secular population decline; favor cash flow + early exit over multi-decade hold.
- At projected returns (10.0% appreciation + 3.0% rent growth), your $14k cash investment doubles in ~2 years — after that, you're playing with house money.
- By year 6, paydown + projected appreciation supports a ~$31k cash-out refi (75% LTV) — recoverable capital for the next deal without selling this one.
Negotiation context
- Only 12 days on market — expect competitive offers; lowballing is unlikely to land.
- 4 sale attempts since 18y ago with the ask held roughly flat each time — persistent listings suggest the price (not the market) is what's stuck; bring a comps-based counter.
Questions for the listing agent
- Is there a deadline driving the sale (1031 exchange, divorce, estate, relocation)? That informs how much negotiation room exists.
- Schools are F-rated, which usually means shorter tenancies and higher turnover. Who's the typical renter profile here, and what's been the actual vacancy rate?
- What's the average days-on-market for RENTAL listings here right now (not sales)? A rising rental-DOM trend means longer vacancies and softer asking-rent achievability than the comps imply.
- What's the recent tenant-quality profile in this submarket — average credit score on applications, eviction rate, late-payment / NSF rate, and stable-employment percentage? A property-management company in the area should have these aggregated.
- How much new for-sale + rental construction is in the pipeline within 1–3 miles? Heavy new supply typically softens prices + rents 12–24 months out; constrained supply supports both.
Investment metrics
- 1% rule
- 2.70% ✓
- Cap rate
- 23.60%
- Cash-on-cash
- 61.80%
- DSCR
- 3.75
- GRM
- 3.1
CMA / ARV
- ARV (on-the-fly)
- $153,924
- Comps found
- 12
Show comp detail 12 sales within ~0.75 mi
| Address | Dist | Beds/Ba | Sqft | Sold | Price | $/sf | Match |
|---|---|---|---|---|---|---|---|
| 203 E Home St | 0.16mi | 2/1.0 (-1) | 1,214 (+0%) | 10mo | $72,000 | $59 | 79 |
| 311 E Pine St | 0.38mi | 3/1.0 | 1,156 (-5%) | 1mo | $175,000 | $151 | 74 |
| 525 S 1st St | 0.57mi | 3/1.0 | 1,200 (-1%) | 5mo | $80,000 | $67 | 68 |
| 209 W Pine St | 0.40mi | 2/1.0 (-1) | 1,200 (-1%) | 11mo | $135,000 | $113 | 65 |
| 116 Forrest St | 0.44mi | 3/1.0 | 1,120 (-8%) | 13mo | $50,500 | $45 | 56 |
| 322 S Third St | 0.40mi | 3/1.0 | 1,075 (-11%) | 14mo | $149,900 | $139 | 51 |
| 422 W Pine St | 0.44mi | 3/2.0 | 1,344 (+11%) | 8mo | $200,000 | $149 | 51 |
| 510 E Gilson St | 0.40mi | 3/1.0 | 1,367 (+13%) | 12mo | $165,000 | $121 | 50 |
| 430 S 1st St | 0.51mi | 3/1.0 | 1,300 (+7%) | 23mo | $165,000 | $127 | 45 |
| 210 E Gilson St | 0.32mi | 3/2.0 | 1,044 (-14%) | 20mo | $135,000 | $129 | 41 |
| 661 E Main St | 0.46mi | 2/1.5 (-1) | 1,060 (-12%) | 13mo | $52,900 | $50 | 40 |
| 420 S Second St | 0.49mi | 2/2.0 (-1) | 1,104 (-9%) | 24mo | $242,000 | $219 | 34 |
Match score weights: distance 35% · size 25% · config 20% · recency 20%. Top-matched comps best support the ARV.
Projected returns pro-forma
10.0% appreciation · 3.0% rent growth · sell at horizon
- IRR
- 73.8%
- Equity multiple
- 6.23×
- Total profit
- $73,170
- Equity at exit
- $45,044
- IRR
- 67.7%
- Equity multiple
- 13.81×
- Total profit
- $179,404
- Equity at exit
- $97,139
Cash invested: $14,000 (down + closing). Projections, not guarantees.
Landlord ↔ Tenant lean methodology
- Overall (STATE)
- 62 Landlord-Friendly
- State Michigan
- 62 Landlord-Friendly · EVEN
- County
- — inherits STATE
- City
- — inherits STATE
ZIP-level market 48829
- Home prices YoY
- 3.6%
- Active inventory
- 17
- Price-to-rent
- 3.1×
Monthly cashflow live
- Estimated rent
- $1,350 medium interval (Pro) →
- Mortgage (P&I)
- −$262
- Tax est. 1.5%
- −$62 /mo · $750/yr
- Insurance
- −$21
- HOA
- −$0
- Vacancy / Maint / Mgmt
- −$284
- Net cashflow
- $721
Break-even live
UW: 25.0% down · 7.5% · 30yr · 1.5% tax · 5.0% vac · 8.0% maint · 8.0% mgmt
Financing live
Cash to close
- Down payment
- $12,500
- Closing costs
- $1,500
- Reserves months
- —
- Total cash needed
- —
Loan-product check · same deal, 3 products live
Conventional
25% down · 7.5% · 30yr
- Down + closing
- —
- Monthly P&I
- —
- Monthly cashflow
- —
- DSCR
- —
- Eligible?
- —
Personal DTI + credit; lowest rate.
DSCR
20% down · 8.5% · 30yr
- Down + closing
- —
- Monthly P&I
- —
- Monthly cashflow
- —
- DSCR
- —
- Eligible?
- —
No personal income docs; deal must DSCR.
Hard money
10% down · 12.0% · 12mo
- Down + closing
- —
- Monthly P&I
- —
- Monthly cashflow
- —
- DSCR
- —
- Eligible?
- —
Short-term bridge; refi at stabilization.
Rent comps 1 comps
| Address | Beds | Baths | Sqft | Rent | $/sqft | DOM | Units | Dist |
|---|---|---|---|---|---|---|---|---|
| 1260 E Main St Apt 21 Edmore, MI | 3.0 | 1.0 | 1275 | $1,350 | $1.06 | 21d | 1 | 0.81mi |
Listing history 10 events
-
2026-06-19days on market $50,000 Active 12 DOM
-
2026-06-18days on market $50,000 Active 11 DOM
-
2026-06-17days on market $50,000 Active 10 DOM
-
2026-06-16days on market $50,000 Active 9 DOM
-
2026-06-15days on market $50,000 Active 8 DOM
-
2026-06-14days on market $50,000 Active 6 DOM
-
2026-06-12days on market $50,000 Active 5 DOM
-
2026-06-09days on market $50,000 Active 2 DOM
-
2026-06-07remarks 415-char remark
-
2026-06-07$50,000 Active 1 DOM
ⓘ Source: listings_history table (triggers on properties + properties_extension) + one-shot
backfill from property_details.listing_events for pre-trigger history.
Climate risk First Street
- Flood 1/10 Low 0% chance over 30 yrs
- Wildfire 1/10 Low
- Heat 2/10 Low 7 d/yr ≥96°F today · 14 d/yr by 30 yrs out
- Wind 1/10 Low
- Air quality 2/10 Low 1 unhealthy d/yr today · 3 by 30 yrs out
Nearby sold comps map
Loading sold comps map…
Walkable amenities ~0.75 mi
Loading nearby amenities…
Taxation est. · year 1
- Rental income
- $16,200
- − Mortgage interest
- −$2,801
- − Property taxes
- −$750
- − Insurance
- −$250
- − Repairs & maintenance
- −$1,296
- − Management
- −$1,296
- − Depreciation
- −$1,455
- Taxable income
- $8,353
- Est. tax owed @ 24.0%
- −$2,005
- After-tax cash flow
- $6,647/yr
For passive investors: Depreciation is non-cash, so a rental often shows a tax loss while cash-flowing — sheltering income. Rental losses are passive: they offset passive income freely, and up to $25,000/yr can offset ordinary (W-2) income if you actively participate and your MAGI is under $100k (phasing out to $0 by $150k); unused losses carry forward. On sale, claimed depreciation is recaptured at up to 25%, and gains may owe capital-gains tax (a 1031 exchange can defer both). Figures are a year-1 estimate at your 24.0% rate — not tax advice; consult a CPA.
Schools (NCES district)
- District
- Montabella Community Schools
- NCES district ID
- 2612960
- Math proficiency
- 20% ▼ -6.00%
- Reading proficiency
- 36% ▼ -6.00%
- Median HH income
- $39,806
- Composite
- 23.51/100
- National rank
- #7867
- State rank
- #396 of 540 in MI
Livability — Edmore
- Score
- 67/100
- State rank
- #380
- US rank
- #10120
Category grades
Schools grade is shown separately in the Schools card above.
Census & demographics
- Census place
- Edmore, MI
- Population (ZIP)
- 3,461
Population outlook (Montcalm County) Hauer SSP2
- Today (2025)
- 61,011 people
- By 2030
- 59,467 · -2.5%
- By 2040
- 55,427 · -9.2%
- By 2050
- 50,517 · -17.2%
- By 2075
- 38,731 · -36.5%
- By 2100
- 26,770 · -56.1%
Race, ethnicity, and origin ACS 2023
- Neighborhood character
- Predominantly White (93%)
- Race & ethnicity
- White 93% Two or more races 4% Hispanic / Latino 3%
- Common ancestry
- Iranian 4% Romanian 3% Lithuanian 2%
- Foreign-born
- 2% · Canada
- Languages at home
- 94% English-only · Spanish 4% Arabic 1% French/Haitian/Cajun 0%
Political lean MEDSL · Montcalm
- 2024 margin
- Solid R (+39.0) · D 29.8% · R 68.7% · Other 1.5%
- 2008→2024 swing
- -38.7pp toward R · 2008: -0.3pp · 2024: -39.0pp
- All cycles
- 2024: R+39.0 2020: R+37.7 2016: R+34.0 2012: R+8.6 2008: R+0.3
Not yet ingested
- Civics
- —
Market trends
- HPI YoY
- ▲ 11.78%
- Current HPI
- 335.1335
- Rent YoY
- —
- Metro
- —
- State GDP YoY
- ▲ 1.37%
- F500 in state
- 28
Industry mix (Fortune 500 HQ in MI)
| Industry | F500 HQs | Revenue |
|---|---|---|
| Automotive Parts | 3 | $48B |
|
||
| Automotive | 2 | $372B |
|
||
| Chemicals | 1 | $45B |
|
||
| Automotive Retail | 1 | $29B |
|
||
| Healthcare / Medical Devices | 1 | $23B |
|
||
| Automotive Technology | 1 | $20B |
|
||
Price history
+525.0% since first listed5 events — show timeline
- 2026-06-02 Listed $50,000 MiRealSource-MiMLS
- 2026-06-02 Listed $50,000 REALCOMP
- 2026-06-02 Listed $50,000 SW Michigan MLS
- 2014-09-25 Listing Removed — SW Michigan MLS
- 2008-04-12 Listed $8,000 SW Michigan MLS
Cash-flow waterfall
monthlySold comps — $/sqft
last 12 mo · ≤1 miLoading sold comps…