412 S County Road 21 · Interlachen, FL
Flood risk 1/10 · Minimal
- FEMA flood zone
- X (unshaded)
- Chance of flooding over 30 yrs
- 0.0%
- Est. flood insurance / yr
- $507 – $1,088
Fire risk 7/10 · Major
- Est. fire insurance / yr
- $947 – $1,759
Heat risk 8/10 · Major
- Hot days now (above 110°F)
- 7 days/yr
- Hot days in 30 yrs
- 21 days/yr
Wind risk 9/10 · Severe
- Chance of severe wind over 30 yrs
- 99.0%
Air-quality risk 2/10 · Minimal
- Unhealthy air days now
- 2 days/yr
- Unhealthy air days in 30 yrs
- 2 days/yr
Risk factors via First Street. Map © Google.
Why this score? — see what drove the D+ grade
The composite is a weighted blend of 9 inputs, each scored 0–100. Each bar is that input's sub-score; the figure is the points it added to the 100-point composite (weight × sub-score).
- ARV discount +15.0/15.0
- Cash flow +13.1/30.0
- DSCR +3.9/10.0
- Livability +3.4/5.0
- 1% rule +3.3/10.0
- Schools +3.0/10.0
- Rent growth +2.5/5.0
- Condition / age +2.5/5.0
- Appreciation +0.0/10.0
$157,600
🖨 Deal sheet (PDF) 📄 Offer letter ✓ Due diligence
Listing remarks
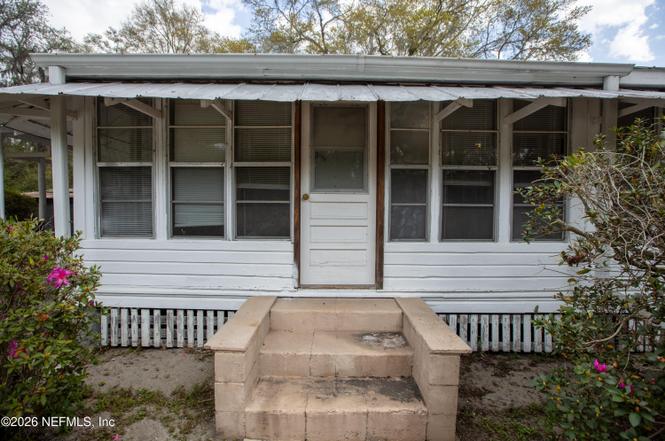
Step back in time with this charming Camp Blanding home, where character and history greet you at the door. Original hardwood floors stretch throughout the living spaces, complemented by oversized wood baseboards that showcase the craftsmanship of a bygone era. The home offers three inviting bedrooms, a beautifully remodeled bathroom, and a sun filled front porch wrapped in windows -- the perfect spot to enjoy morning coffee or quiet evenings. Set on a generous lot, the property includes a versatile shed/pole barn and a unique bonus feature: a former sand mine home at the back of the land. Currently used for storage, this expansive space offers endless possibilities -- transform it into a w
Key facts
- Ample room for rv
- 0.67 acre lot
- 2 parking spots
Tags
Property features AI
Exterior
- Parking: Carport (2 spaces); Off-street parking; Additional unspecified parking
- Utilities: Septic tank; Electricity available and connected; Water connected
- Home design: Single family residence; One-story
- Construction: Metal roof; Shed(s) and workshop
- Exterior features: Cleared lot; City street frontage; Asphalt road access; Front porch (glass enclosed)
Interior
- Kitchen: Electric oven; Electric range; Refrigerator
- Bedrooms: 3 bedrooms (single-level)
- Flooring: Vinyl flooring; Wood flooring
- Bathrooms: 1 full bathroom
- Heating & cooling: Central heating; Central air conditioning; Other cooling
- Interior features: Front porch with a glass-enclosed area; Shed(s) and workshop on lot
Neighborhood map
What this means for you Summary
Snapshot
- This is a 2-bed/1.0-bath single-family listed at $158k.
Deal economics
- At list price, monthly cash flow is $-5 ($-55/yr) — negative.
- To cash-flow at today's rent, offer at most $157k (0.5% below list).
- To meet the 1% rule (rent ≥ 1% of price), the offer needs to be $130k (17.4% below list).
- Recommended offer: $130k (17.4% below list) — sets the bar for 1% rule.
- Cap rate 6.3% vs local median 5.1% in Interlachen — meaningfully above typical; check what's discounted (condition, days-on-market, listing class) to confirm the premium yield is real.
Location & tenants
- Location reads 67/100 on livability (#540 in FL) — a middle-class / working-renter tenant base. Strengths: crime A+, cost of living A+, housing A+; Watch: amenities F, commute F, employment F.
- Putnam (town): math 34% / reading 39% proficiency, ranked #66 of 73 in FL (top 90%) — families likely to look elsewhere, expect single-tenant / working-renter base with shorter leases; 71% free/reduced lunch — lower-income household profile, screen leases tightly.
- Zoned schools: Ochwilla Elementary School (math 27% / reading 32%, grade F, #1,896 of 2,144 statewide, top 90%, 410 students, 64% FRL); Putnam Academy of Arts And Sciences (math 42% / reading 52%, grade D+, #291 of 571 statewide, top 52%, 177 students, 75% FRL, charter); Interlachen Jr-Sr High School (math 16% / reading 32%, grade F, #529 of 667 statewide, top 80%, 1,097 students, 71% FRL) — zoned schools at 70% FRL track the district average.
- Market conditions: 300 active listings in the ZIP; 113 units permitted in Putnam County in 2024 (0 in 5+ unit buildings).
Forward outlook
- Local home prices are declining (-3.0%/yr); year-one equity from $1k of loan paydown is wiped out by about $5k of value loss. Plan a longer hold.
- Putnam County population projected at -31% by 2050 — secular population decline; favor cash flow + early exit over multi-decade hold.
Negotiation context
- It's been on market 103 days — a 9% lower offer ($143k) is reasonable based on typical stale-listing flexibility.
Risks & watch-outs
- Watch-outs: built in 1951 — expect roof / HVAC / electrical / plumbing capex.
- Climate carrying-cost: severe wind risk, 99% chance of damaging wind over 30y; major wildfire risk; extreme-heat days projected 7→21/yr by 2055 (HVAC capex compounding) — expect insurance premiums to compound above CPI over the hold.
Questions for the listing agent
- What do current leases actually rent for vs. the listed asking? Can we see a recent rent roll and the last 12 months of T-12 income?
- It's been on market 103 days. Have you received any prior offers? Is the seller open to a 17% concession, seller financing, or rate buy-down credit?
- Built in 1951 — when were the roof, HVAC, electrical panel, plumbing, and water heater last replaced?
- Why hasn't it sold? Are there any deal-killer items the seller is aware of (foundation, flood, title, zoning, code violations)?
- Is there a deadline driving the sale (1031 exchange, divorce, estate, relocation)? That informs how much negotiation room exists.
- Schools are D-rated, which usually means shorter tenancies and higher turnover. Who's the typical renter profile here, and what's been the actual vacancy rate?
- The area grade is low — what's the realistic commute time and amenity access for the typical tenant pool here? Any planned neighborhood developments (good or bad) we should know about?
- What's the average days-on-market for RENTAL listings here right now (not sales)? A rising rental-DOM trend means longer vacancies and softer asking-rent achievability than the comps imply.
- What's the recent tenant-quality profile in this submarket — average credit score on applications, eviction rate, late-payment / NSF rate, and stable-employment percentage? A property-management company in the area should have these aggregated.
- How much new for-sale + rental construction is in the pipeline within 1–3 miles? Heavy new supply typically softens prices + rents 12–24 months out; constrained supply supports both.
Investment metrics
- 1% rule
- 0.83% ✗
- Cap rate
- 6.26%
- Cash-on-cash
- -0.12%
- DSCR
- 0.99
- GRM
- 10.1
CMA / ARV
- ARV (on-the-fly)
- $191,100
- Comps found
- 1
Show comp detail 1 sale within ~0.75 mi
| Address | Dist | Beds/Ba | Sqft | Sold | Price | $/sf | Match |
|---|---|---|---|---|---|---|---|
| 778 Keuka Rd | 0.27mi | 3/2.0 (+1) | 1,000 (+2%) | 24mo | $195,000 | $195 | 55 |
Match score weights: distance 35% · size 25% · config 20% · recency 20%. Top-matched comps best support the ARV.
Projected returns pro-forma
-3.0% appreciation · 3.0% rent growth · sell at horizon
- IRR
- -16.5%
- Equity multiple
- 0.41×
- Total profit
- $-25,845
- Equity at exit
- $23,499
- IRR
- -8.3%
- Equity multiple
- 0.48×
- Total profit
- $-22,943
- Equity at exit
- $13,626
Cash invested: $44,128 (down + closing). Projections, not guarantees.
Landlord ↔ Tenant lean methodology
- Overall (STATE)
- 87 Strongly Landlord-Friendly
- State Florida
- 87 Strongly Landlord-Friendly · R+3
- County
- — inherits STATE
- City
- — inherits STATE
ZIP-level market 32640
- Home prices YoY
- -5.3%
- Active inventory
- 300
- Price-to-rent
- 10.1×
Monthly cashflow live
- Estimated rent
- $1,301 medium interval (Pro) →
- Mortgage (P&I)
- −$826
- Tax from tax record
- −$140 /mo · $1,685/yr
- Insurance
- −$66
- HOA
- −$0
- Vacancy / Maint / Mgmt
- −$273
- Net cashflow
- $-5
Break-even live
Sensitivity live
| Price | -10% $85 | -5% $40 | +0% $-5 | +5% $-49 | +10% $-94 |
|---|---|---|---|---|---|
| Rent | -10% $-107 | -5% $-56 | +0% $-5 | +5% $47 | +10% $98 |
| Rate | -1.0pp $75 | -0.5pp $36 | base $-5 | +0.5pp $-45 | +1.0pp $-87 |
UW: 25.0% down · 7.5% · 30yr · 1.5% tax · 5.0% vac · 8.0% maint · 8.0% mgmt
Financing live
Cash to close
- Down payment
- $39,400
- Closing costs
- $4,728
- Reserves months
- —
- Total cash needed
- —
Loan-product check · same deal, 3 products live
Conventional
25% down · 7.5% · 30yr
- Down + closing
- —
- Monthly P&I
- —
- Monthly cashflow
- —
- DSCR
- —
- Eligible?
- —
Personal DTI + credit; lowest rate.
DSCR
20% down · 8.5% · 30yr
- Down + closing
- —
- Monthly P&I
- —
- Monthly cashflow
- —
- DSCR
- —
- Eligible?
- —
No personal income docs; deal must DSCR.
Hard money
10% down · 12.0% · 12mo
- Down + closing
- —
- Monthly P&I
- —
- Monthly cashflow
- —
- DSCR
- —
- Eligible?
- —
Short-term bridge; refi at stabilization.
Listing history 15 events
-
2026-06-21days on market $157,600 Active 103 DOM
-
2026-06-18days on market $157,600 Active 100 DOM
-
2026-06-17days on market $157,600 Active 99 DOM
-
2026-06-16days on market $157,600 Active 98 DOM
-
2026-06-15days on market $157,600 Active 97 DOM
-
2026-06-13days on market $157,600 Active 95 DOM
-
2026-06-10days on market $157,600 Active 91 DOM
-
2026-06-08days on market $157,600 Active 90 DOM
-
2026-06-07days on market $157,600 Active 89 DOM
-
2026-06-05days on market $157,600 Active 86 DOM
-
2026-06-03days on market $157,600 Active 85 DOM
-
2026-06-02days on market $157,600 Active 84 DOM
-
2026-06-01days on market $157,600 Active 83 DOM
-
2026-05-31days on market $157,600 Active 82 DOM
-
2026-03-10$157,600 Active
ⓘ Source: listings_history table (triggers on properties + properties_extension) + one-shot
backfill from property_details.listing_events for pre-trigger history.
Tax reassessment forecast FL · Resets to sale price
- Current annual tax
- $1,685 · $140/mo
- Projected year-2 tax
- $1,685 · $140/mo
- Expected delta
- $0/yr ($0/mo · 0.0%)
ⓘ Screening estimate from a state-policy table — verify with the county assessor before closing.
Climate risk First Street
- Flood 1/10 Low FEMA zone X (unshaded) · 0% chance over 30 yrs
- Wildfire 7/10 Severe
- Heat 8/10 Severe 7 d/yr ≥110°F today · 21 d/yr by 30 yrs out
- Wind 9/10 Extreme 99% chance of damaging wind over 30 yrs
- Air quality 2/10 Low 2 unhealthy d/yr today · 2 by 30 yrs out
Nearby sold comps map
Loading sold comps map…
Walkable amenities ~0.75 mi
Loading nearby amenities…
Taxation est. · year 1
- Rental income
- $15,614
- − Mortgage interest
- −$8,828
- − Property taxes
- −$1,685
- − Insurance
- −$788
- − Repairs & maintenance
- −$1,249
- − Management
- −$1,249
- − Depreciation
- −$4,585
- Taxable loss
- −$2,769
- Est. tax savings @ 24.0%
- +$665
- After-tax cash flow
- $610/yr
For passive investors: Depreciation is non-cash, so a rental often shows a tax loss while cash-flowing — sheltering income. Rental losses are passive: they offset passive income freely, and up to $25,000/yr can offset ordinary (W-2) income if you actively participate and your MAGI is under $100k (phasing out to $0 by $150k); unused losses carry forward. On sale, claimed depreciation is recaptured at up to 25%, and gains may owe capital-gains tax (a 1031 exchange can defer both). Figures are a year-1 estimate at your 24.0% rate — not tax advice; consult a CPA.
Schools (NCES district)
- District
- Putnam
- NCES district ID
- 1201620
- Math proficiency
- 34% ▼ -10.00%
- Reading proficiency
- 39% ▼ -4.00%
- Median HH income
- $33,350
- Composite
- 29.99/100
- National rank
- #6361
- State rank
- #66 of 73 in FL
Livability — Interlachen
- Score
- 67/100
- State rank
- #540
- US rank
- #10162
Category grades
Schools grade is shown separately in the Schools card above.
Census & demographics
- City population
- 11,580
- Population (ZIP)
- 10,780
Population outlook (Putnam County) Hauer SSP2
- Today (2025)
- 65,299 people
- By 2030
- 61,255 · -6.2%
- By 2040
- 52,930 · -18.9%
- By 2050
- 45,051 · -31.0%
- By 2075
- 28,720 · -56.0%
- By 2100
- 15,852 · -75.7%
Race, ethnicity, and origin ACS 2023
- Neighborhood character
- Predominantly White (69%)
- Race & ethnicity
- White 69% Black 24% Two or more races 4% Hispanic / Latino 4%
- Common ancestry
- Slovak 2% Lithuanian 2% Serbian 1%
- Foreign-born
- 3% · Canada
- Languages at home
- 98% English-only · Spanish 2%
Political lean MEDSL · Putnam
- 2024 margin
- Solid R (+47.8) · D 25.8% · R 73.6%
- 2008→2024 swing
- -28.5pp toward R · 2008: -19.3pp · 2024: -47.8pp
- All cycles
- 2024: R+47.8 2020: R+41.2 2016: R+36.6 2012: R+24.5 2008: R+19.3
Not yet ingested
- Civics
- —
Market trends
- HPI YoY
- ▼ -15.68%
- Current HPI
- 278.0079
- Rent YoY
- —
- Metro
- —
- State GDP YoY
- ▲ 3.28%
- F500 in state
- 36
Industry mix (Fortune 500 HQ in FL)
| Industry | F500 HQs | Revenue |
|---|---|---|
| Industrial Technology | 2 | $29B |
|
||
| Insurance | 2 | $17B |
|
||
| Retail | 1 | $60B |
|
||
| Technology Distribution | 1 | $58B |
|
||
| Homebuilding | 1 | $35B |
|
||
| Technology Manufacturing | 1 | $35B |
|
||
Price history
1 event — show timeline
- 2026-03-10 Listed $157,600 realMLS
Property tax history
+5.0%/yrLatest (2025): $1,685 · +9.8% YoY. Source: county tax records.
Cash-flow waterfall
monthlySold comps — $/sqft
last 12 mo · ≤1 miLoading sold comps…