4001 Hillcrest Dr #609 · Hollywood, FL
Flood risk 1/10 · Minimal
- FEMA flood zone
- AH
- Chance of flooding over 30 yrs
- 0.0%
- Est. flood insurance / yr
- $1,142 – $2,507
Fire risk 1/10 · Minimal
- Est. fire insurance / yr
- $947 – $1,759
Heat risk 10/10 · Severe
- Hot days now (above 105°F)
- 6 days/yr
- Hot days in 30 yrs
- 22 days/yr
Wind risk 10/10 · Severe
- Chance of severe wind over 30 yrs
- 99.0%
Air-quality risk 2/10 · Minimal
- Unhealthy air days now
- 2 days/yr
- Unhealthy air days in 30 yrs
- 2 days/yr
Risk factors via First Street. Map © Google.
Why this score? — see what drove the B- grade
The composite is a weighted blend of 9 inputs, each scored 0–100. Each bar is that input's sub-score; the figure is the points it added to the 100-point composite (weight × sub-score).
- Cash flow +27.8/30.0
- 1% rule +10.0/10.0
- DSCR +9.8/10.0
- ARV discount +7.5/15.0
- Schools +4.1/10.0
- Livability +3.8/5.0
- Rent growth +3.1/5.0
- Condition / age +2.5/5.0
- Appreciation +0.0/10.0
$107,500
🖨 Deal sheet 📄 Offer letter ✓ Due diligence
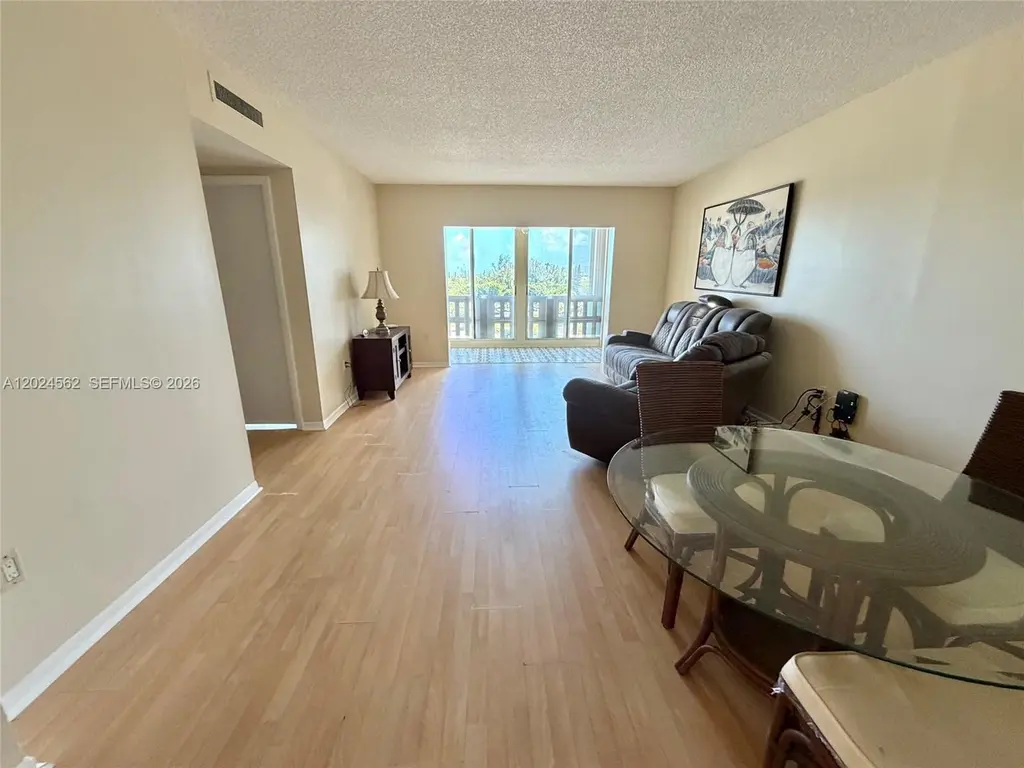
Listing remarks
WONDERFUL EASTERN BREEZES FROM THIS SPACIOUS 1 BEDROOM !. 5 BATH IN THE DESIRABLE HILLCREST COMMUNITY! BRAND NEW BOSCH A/C UNIT, NEW DISHWASHER AND NEW RANGE. FRESHLY PAINTED. ENCLOSED BALCONY WITH FLOOR TO CEILING GLASS SLIDERS MAKES FOR A GREAT OFFICE OR DEN. LARGE MASTER BEDROOM WITH WALK-IN CLOSETS. VERY WELL RUN BUILDING WITH MAJOR UPDATES INCLUDING COMPLETED SIRS AND 40 YEAR INSPECTIONS, FIRE SPRINKLERS, A NEWER ROOF AND NEW ELEVATORS. STEPS TO MILES OF PRIVATE WALKING PATHS AND COMMUNITY ROOM W/ KITCHEN & BARBEQUES. HILLCREST IS IN CLOSE PROXIMITY TO SHOPPING, RESTAURANTS, DINING, BEACHES, FT. LAUDERDALE AIRPORT, ALL MAJOR HIGHWAYS, HARDROCK HOTEL & CASINO, GULFSTREAM PA
Key facts
- Enclosed balcony
- New range
- New dishwasher
Tags
Property features AI
Finance
- Financial info: Pets not allowed
- HOA & community: Monthly association fee; Association fee covers cable TV, insurance, internet, laundry, maintenance of grounds, pest control, pool(s), reserve fund, sewer, security, trash, and water; Building amenities include bike storage, clubhouse, elevators, laundry, pool, shuffleboard court, spa/hot tub, storage, trails, and trash service; Senior community
Exterior
- Parking: One assigned parking space
- Security: Closed circuit camera(s); Doorman
- Utilities: Water included in association; Sewer included in association; Cable and internet included in association
- Home design: Condominium/Apartment (attached property); 12-story building; Entry on level 6
- Construction: Block construction; Resale unit
- Exterior features: Heated pool; Closed circuit camera(s); Doorman
Interior
- Kitchen: Dishwasher; Disposal; Microwave
- Bedrooms: Entry located on level 6
- Flooring: Laminate
- Bathrooms: 1 full bathroom; 1 half bathroom
- Heating & cooling: Central heating; Central air conditioning
- Interior features: Walk-in closet(s); Other interior features
- Laundry & utility: Common area laundry; Electric water heater
Neighborhood map
What this means for you Summary
Snapshot
- This is a 1-bed/2.0-bath condo listed at $108k.
Deal economics
- At list price, monthly cash flow is $176 ($2k/yr) — positive.
- The deal already cash-flows at list — no discount required.
- Meets the 1% rule at list price ($2k rent vs $108k).
- Recommended offer: $106k (1.5% below list) — sets the bar for market timing.
- Cap rate 10.0% vs local median 3.2% in Hollywood — top-decile yield for the area; either an underpriced asset or a hidden risk that comps aren't pricing in. Stress-test before assuming the spread holds.
Location & tenants
- Location reads 76/100 on livability (#232 in FL, #3,548 nationally) — a middle-class / working-renter tenant base. Strengths: commute A+, housing A+, crime B+; Watch: amenities D.
- Broward (suburban): math 42% / reading 53% proficiency, ranked #46 of 73 in FL (top 63%) — families likely to look elsewhere, expect single-tenant / working-renter base with shorter leases.
- Market conditions: Rents rising (+2.4%/yr); 529 active listings in the ZIP; 40 comparable units currently listed for rent nearby; rentals at typical pace (median 20d on market — plan ~3-4 weeks tenant-placement turnaround); 2,111 units permitted in Broward County in 2024 (1,265 in 5+ unit buildings).
- This rent runs 33% of the median local income ($71k/yr) — at the standard rent-burdened threshold; future hikes will face affordability resistance.
Forward outlook
- Local home prices are declining (-3.0%/yr); year-one equity from $743 of loan paydown is wiped out by about $3k of value loss. Plan a longer hold.
- Broward County population projected at +34% by 2050 — long-run rental-demand tailwind backs the buy-and-hold thesis.
Negotiation context
- It's been on market 25 days — a 2% lower offer ($106k) is reasonable based on typical stale-listing flexibility.
- 2 sale attempts with the ask held roughly flat each time — persistent listings suggest the price (not the market) is what's stuck; bring a comps-based counter.
- Current owner paid $35k; list at $108k implies a 207% gain — meaningful room to come down on a strong offer.
Risks & watch-outs
- Watch-outs: flood insurance adds $152/mo; HOA is 27% of rent.
- Climate carrying-cost: in FEMA flood zone AH (mandatory federal flood insurance); severe wind risk, 99% chance of damaging wind over 30y; extreme-heat days projected 6→22/yr by 2055 (HVAC capex compounding) — expect insurance premiums to compound above CPI over the hold.
Questions for the listing agent
- Built in 1979 — when were the roof, HVAC, electrical panel, plumbing, and water heater last replaced?
- What's the actual annual flood-insurance premium (NFIP or private), and is the property in a SFHA with mandatory coverage?
- What does the HOA fee cover, when was the last increase, and are there any pending special assessments or reserve-fund shortfalls?
- Any open or pending special assessments — roof, HVAC, plumbing, elevator, façade? What's the per-unit balance and payoff schedule, and is the seller paying it off at close or rolling it to the buyer?
- Is there a deadline driving the sale (1031 exchange, divorce, estate, relocation)? That informs how much negotiation room exists.
- What's the average days-on-market for RENTAL listings here right now (not sales)? A rising rental-DOM trend means longer vacancies and softer asking-rent achievability than the comps imply.
- What's the recent tenant-quality profile in this submarket — average credit score on applications, eviction rate, late-payment / NSF rate, and stable-employment percentage? A property-management company in the area should have these aggregated.
- How much new apartment / multifamily construction is in the pipeline within 1–3 miles? Heavy new supply (>2% of stock underway) typically softens rents 12–24 months out; light construction supports rent growth.
Investment metrics
- 1% rule
- 1.82% ✓
- Cap rate
- 9.95%
- Cash-on-cash
- 13.07%
- DSCR
- 1.58
- GRM
- 4.6
CMA / ARV
No comps found within radius.
Projected returns pro-forma
-3.0% appreciation · 2.41% rent growth · sell at horizon
- IRR
- -6.3%
- Equity multiple
- 0.77×
- Total profit
- $-6,968
- Equity at exit
- $16,029
- IRR
- 2.6%
- Equity multiple
- 1.18×
- Total profit
- $5,346
- Equity at exit
- $9,295
Cash invested: $30,100 (down + closing). Projections, not guarantees.
Landlord ↔ Tenant lean methodology
- Overall (STATE)
- 87 Strongly Landlord-Friendly
- State Florida
- 87 Strongly Landlord-Friendly · R+3
- County
- — inherits STATE
- City
- — inherits STATE
ZIP-level market 33021
- Rents YoY
- 2.4%
- Active inventory
- 529
- Price-to-rent
- 4.6×
Monthly cashflow live
- Estimated rent
- $1,960 high interval (Pro) →
- Mortgage (P&I)
- −$564
- Tax from tax record
- −$79 /mo · $949/yr
- Insurance
- −$45
- Flood insurance flood zone
- −$152 /mo · $1,824/yr
- HOA
- −$533
- Vacancy / Maint / Mgmt
- −$412
- Net cashflow
- $176
Break-even live
UW: 25.0% down · 7.5% · 30yr · 1.5% tax · 5.0% vac · 8.0% maint · 8.0% mgmt
Financing live
Cash to close
- Down payment
- $26,875
- Closing costs
- $3,225
- Reserves months
- —
- Total cash needed
- —
Loan-product check · same deal, 3 products live
Conventional
25% down · 7.5% · 30yr
- Down + closing
- —
- Monthly P&I
- —
- Monthly cashflow
- —
- DSCR
- —
- Eligible?
- —
Personal DTI + credit; lowest rate.
DSCR
20% down · 8.5% · 30yr
- Down + closing
- —
- Monthly P&I
- —
- Monthly cashflow
- —
- DSCR
- —
- Eligible?
- —
No personal income docs; deal must DSCR.
Hard money
10% down · 12.0% · 12mo
- Down + closing
- —
- Monthly P&I
- —
- Monthly cashflow
- —
- DSCR
- —
- Eligible?
- —
Short-term bridge; refi at stabilization.
Rent comps 40 comps
| Address | Beds | Baths | Sqft | Rent | $/sqft | DOM | Units | Dist |
|---|---|---|---|---|---|---|---|---|
| 1200 Tallwood Ave #302 Hollywood, FL | 2.0 | 2.0 | 840 | $2,225 | $2.65 | 3d | 1 | 0.27mi |
| 1200 Tallwood Ave #302 Hollywood, FL | 2.0 | 2.0 | 840 | $2,250 | $2.68 | 24d | 1 | 0.27mi |
| 900 Tallwood Ave #207 Hollywood, FL | 1.0 | 1.0 | 640 | $1,575 | $2.46 | 20d | 1 | 0.30mi |
| 919 Hillcrest Dr #511 Hollywood, FL | 1.0 | 1.5 | 830 | $1,700 | $2.05 | 24d | 1 | 0.31mi |
| 919 Hillcrest Dr #303 Hollywood, FL | 2.0 | 2.0 | 1100 | $2,000 | $1.82 | 24d | 1 | 0.31mi |
| 901 Hillcrest Dr #208 Hollywood, FL | 1.0 | 1.5 | 830 | $1,700 | $2.05 | 24d | 1 | 0.37mi |
| 901 Hillcrest Dr #307 Hollywood, FL | 1.0 | 1.5 | 830 | $1,750 | $2.11 | 24d | 1 | 0.37mi |
| 911 S Park Rd Hollywood, FL | 1.0–3.0 | 1.0–2.0 | 1123 | $2,319 | $2.07 | 1d | 24 | 0.38mi |
| 532 S Crescent Dr Unit 106 Hollywood, FL | — | 1.0 | 550 | $1,425 | $2.59 | 14d | 1 | 0.39mi |
| 950 Hillcrest Dr Hollywood, FL | 1.0 | 1.5 | 775 | $1,675 | $2.16 | 15d | 2 | 0.44mi |
| 555 S Luna Ct Hollywood, FL | 2.0 | 2.0 | 1036 | $2,120 | $2.05 | 5d | 2 | 0.44mi |
| 812 S Park Rd Hollywood, FL | 1.0–3.0 | 1.0–2.0 | 999 | $1,869 | $1.87 | 2d | 24 | 0.45mi |
| 400 S Luna Ct #2 Hollywood, FL | 2.0 | 1.0 | 960 | $2,300 | $2.40 | 24d | 1 | 0.48mi |
| 315 S Crescent Dr Hollywood, FL | — | 1.0 | 544 | $1,425 | $2.62 | 15d | 1 | 0.49mi |
| 3624 Jackson St Unit 21 Hollywood, FL | 2.0 | 2.0 | 1100 | $1,900 | $1.73 | 3d | 1 | 0.49mi |
| 570 S Park Rd Unit 13-6 Hollywood, FL | 2.0 | 2.0 | 1060 | $2,400 | $2.26 | 24d | 1 | 0.50mi |
| 4700 Washington St Hollywood, FL | 1.0 | 1.5 | 775 | $1,725 | $2.23 | 12d | 3 | 0.50mi |
| 4700 Washington St Hollywood, FL | 1.0 | 1.5 | 775 | $1,725 | $2.23 | 7d | 3 | 0.50mi |
| 640 S Park Rd Unit 14-4 Hollywood, FL | 2.0 | 2.0 | 1060 | $2,200 | $2.08 | 17d | 1 | 0.52mi |
| 640 S Park Rd Unit 14-4 Hollywood, FL | 2.0 | 2.0 | 1060 | $2,300 | $2.17 | 24d | 1 | 0.52mi |
| 530 S Park Rd Hollywood, FL | 2.0 | 2.0 | 1060 | $2,375 | $2.24 | 18d | 1 | 0.52mi |
| 550 S Park Rd Unit 14-8 Hollywood, FL | 1.0 | 1.0 | 650 | $1,750 | $2.69 | 7d | 1 | 0.52mi |
| 530 S Park Rd Hollywood, FL | 1.0 | 1.0 | 841 | $1,800 | $2.14 | 24d | 1 | 0.52mi |
| 640 S Park Rd Unit 34-4 Hollywood, FL | 2.0 | 2.0 | 1060 | $2,250 | $2.12 | 24d | 1 | 0.52mi |
| 3500 Jackson St Unit 203 Hollywood, FL | 2.0 | 2.0 | 875 | $1,995 | $2.28 | 24d | 1 | 0.53mi |
| 620 S Park Rd Unit 31-2 Hollywood, FL | 1.0 | 1.0 | 841 | $1,800 | $2.14 | 24d | 1 | 0.53mi |
| 4802 Washington St #5 Hollywood, FL | 2.0 | 2.0 | 1080 | $2,500 | $2.31 | 24d | 1 | 0.55mi |
| 3600 Van Buren St Hollywood, FL | 1.0–2.0 | 1.0–2.0 | 1055 | $1,950 | $1.85 | 3d | 4 | 0.56mi |
| 610 S Park Rd Unit 26-1 Hollywood, FL | 1.0 | 1.0 | 841 | $1,950 | $2.32 | 4d | 1 | 0.56mi |
| 610 S Park Rd Unit 26-1 Hollywood, FL | 1.0 | 1.0 | 841 | $2,100 | $2.50 | 24d | 1 | 0.56mi |
| 470 S Park Rd Unit 7-110 Hollywood, FL | 1.0 | 1.0 | 659 | $1,800 | $2.73 | 24d | 1 | 0.56mi |
| 470 S Park Rd Unit 7-203 Hollywood, FL | 2.0 | 2.0 | 820 | $2,050 | $2.50 | 24d | 1 | 0.56mi |
| 3711 Van Buren St #2 Hollywood, FL | 1.0 | 1.0 | 660 | $1,550 | $2.35 | 24d | 1 | 0.57mi |
| 4812 Washington St #7 Hollywood, FL | 2.0 | 2.0 | 1080 | $2,200 | $2.04 | 18d | 1 | 0.57mi |
| 4812 Washington St Unit 147 Hollywood, FL | 2.0 | 2.0 | 1080 | $2,200 | $2.04 | 7d | 1 | 0.58mi |
| 460 S Park Rd Unit 6-304 Hollywood, FL | 2.0 | 1.0 | 918 | $1,950 | $2.12 | 5d | 1 | 0.58mi |
| 460 S Park Rd Apt 109 Hollywood, FL | 2.0 | 2.0 | 867 | $2,100 | $2.42 | 20d | 1 | 0.58mi |
| 460 S Park Rd Unit 6-203 Hollywood, FL | 2.0 | 2.0 | 820 | $2,400 | $2.93 | 5d | 1 | 0.58mi |
| 981 Hillcrest Ct #114 Hollywood, FL | 2.0 | 2.0 | 899 | $2,000 | $2.22 | 24d | 1 | 0.59mi |
| 3601 Van Buren St Hollywood, FL | 1.0–2.0 | 1.0–2.0 | 941 | $1,725 | $1.83 | 3d | 3 | 0.59mi |
HOA detail condo
- Monthly dues
- $533 · $6,396/yr
- Assessments
- None detected in remarks — confirm with the listing agent.
Listing history 17 events
-
2026-06-18days on market $107,500 Active 25 DOM
-
2026-06-17days on market $107,500 Active 24 DOM
-
2026-06-16days on market $107,500 Active 23 DOM
-
2026-06-15days on market $107,500 Active 22 DOM
-
2026-06-13days on market $107,500 Active 20 DOM
-
2026-06-09days on market $107,500 Active 16 DOM
-
2026-06-08days on market $107,500 Active 15 DOM
-
2026-06-07days on market $107,500 Active 14 DOM
-
2026-06-04days on market $107,500 Active 11 DOM
-
2026-06-03days on market $107,500 Active 10 DOM
-
2026-06-02days on market $107,500 Active 9 DOM
-
2026-06-01days on market $107,500 Active 8 DOM
-
2026-05-31days on market $107,500 Active 7 DOM
-
2026-05-24$107,500 Active
-
2026-01-26price $110,000
-
2025-11-30$115,000 Active
-
2000-07-19soldstatus $35,000
ⓘ Source: listings_history table (triggers on properties + properties_extension) + one-shot
backfill from property_details.listing_events for pre-trigger history.
Tax reassessment forecast FL · Resets to sale price
- Current annual tax
- $949 · $79/mo
- Projected year-2 tax
- $949 · $79/mo
- Expected delta
- $0/yr ($0/mo · -0.0%)
ⓘ Screening estimate from a state-policy table — verify with the county assessor before closing.
Climate risk First Street
- Flood 1/10 Low FEMA zone AH · 0% chance over 30 yrs
- Wildfire 1/10 Low
- Heat 10/10 Extreme 6 d/yr ≥105°F today · 22 d/yr by 30 yrs out
- Wind 10/10 Extreme 99% chance of damaging wind over 30 yrs
- Air quality 2/10 Low 2 unhealthy d/yr today · 2 by 30 yrs out
Nearby sold comps map
Loading sold comps map…
Walkable amenities ~0.75 mi
Loading nearby amenities…
Taxation est. · year 1
- Rental income
- $23,519
- − Mortgage interest
- −$6,022
- − Property taxes
- −$949
- − Insurance
- −$2,362
- − Repairs & maintenance
- −$1,882
- − Management
- −$1,882
- − HOA
- −$6,396
- − Depreciation
- −$3,127
- Taxable income
- $901
- Est. tax owed @ 24.0%
- −$216
- After-tax cash flow
- $1,893/yr
For passive investors: Depreciation is non-cash, so a rental often shows a tax loss while cash-flowing — sheltering income. Rental losses are passive: they offset passive income freely, and up to $25,000/yr can offset ordinary (W-2) income if you actively participate and your MAGI is under $100k (phasing out to $0 by $150k); unused losses carry forward. On sale, claimed depreciation is recaptured at up to 25%, and gains may owe capital-gains tax (a 1031 exchange can defer both). Figures are a year-1 estimate at your 24.0% rate — not tax advice; consult a CPA.
Schools (NCES district)
- District
- Broward
- NCES district ID
- 1200180
- Math proficiency
- 42% ▼ -18.00%
- Reading proficiency
- 53% ▼ -5.00%
- Median HH income
- $52,139
- Composite
- 40.88/100
- National rank
- #3621
- State rank
- #46 of 73 in FL
Livability — Hollywood
- Score
- 76/100
- State rank
- #232
- US rank
- #3548
Category grades
Schools grade is shown separately in the Schools card above.
Census & demographics
- Census place
- Hollywood, FL
- County
- Broward County · 1,963,430 people
- City population
- 109,079
- Metro
- Miami-Fort Lauderdale-Pompano Beach, FL
- Population (ZIP)
- 48,464
- Household income
- $71,318
- Rent vs Own
- Severe rent burden
- 2151.0
Population outlook (Broward County) Hauer SSP2
- Today (2025)
- 2,207,033 people
- By 2030
- 2,360,704 · +7.0%
- By 2040
- 2,661,208 · +20.6%
- By 2050
- 2,946,698 · +33.5%
- By 2075
- 3,602,273 · +63.2%
- By 2100
- 3,970,984 · +79.9%
Race, ethnicity, and origin ACS 2023
- Neighborhood character
- Diverse neighborhood (Simpson 0.65)
- Race & ethnicity
- White 45% Hispanic / Latino 37% Two or more races 17% Black 13% Asian 3%
- Hispanic origin (detail)
- Puerto Rican 5% Cuban 10% Dominican 2%
- Common ancestry
- Romanian 3% Scotch-Irish 2% Hispanic 2%
- Foreign-born
- 35% · Canada, Jamaica, Dominican Republic
- Languages at home
- 53% English-only · Spanish 33% French/Haitian/Cajun 4% Russian/Polish/Slavic 2%
Political lean MEDSL · Broward
- 2024 margin
- D (+17.0) · D 58.0% · R 41.0%
- 2008→2024 swing
- -17.8pp toward R · 2008: 34.7pp · 2024: 17.0pp
- All cycles
- 2024: D+17.0 2020: D+29.8 2016: D+35.0 2012: D+34.9 2008: D+34.7
Not yet ingested
- Civics
- —
Market trends
- HPI YoY
- ▼ -404.28%
- Current HPI
- 429.7129
- Rent YoY
- ▲ 2.41%
- Metro
- Miami-Fort Lauderdale-Pompano Beach, FL
- State GDP YoY
- ▲ 3.28%
- F500 in state
- 36
Industry mix (Fortune 500 HQ in FL)
| Industry | F500 HQs | Revenue |
|---|---|---|
| Industrial Technology | 2 | $29B |
|
||
| Insurance | 2 | $17B |
|
||
| Retail | 1 | $60B |
|
||
| Technology Distribution | 1 | $58B |
|
||
| Homebuilding | 1 | $35B |
|
||
| Technology Manufacturing | 1 | $35B |
|
||
Price history
+207.1% since first listed4 events — show timeline
- 2026-05-24 Listed $107,500 MARMLS
- 2026-01-26 Price Changed $110,000 MARMLS
- 2025-11-30 Listed $115,000 MARMLS
- 2000-07-19 Sold (Public Records) $35,000 Public Records
Property tax history
+0.1%/yrLatest (2025): $949 · +2.0% YoY. Source: county tax records.
Cash-flow waterfall
monthlySold comps — $/sqft
last 12 mo · ≤1 miLoading sold comps…