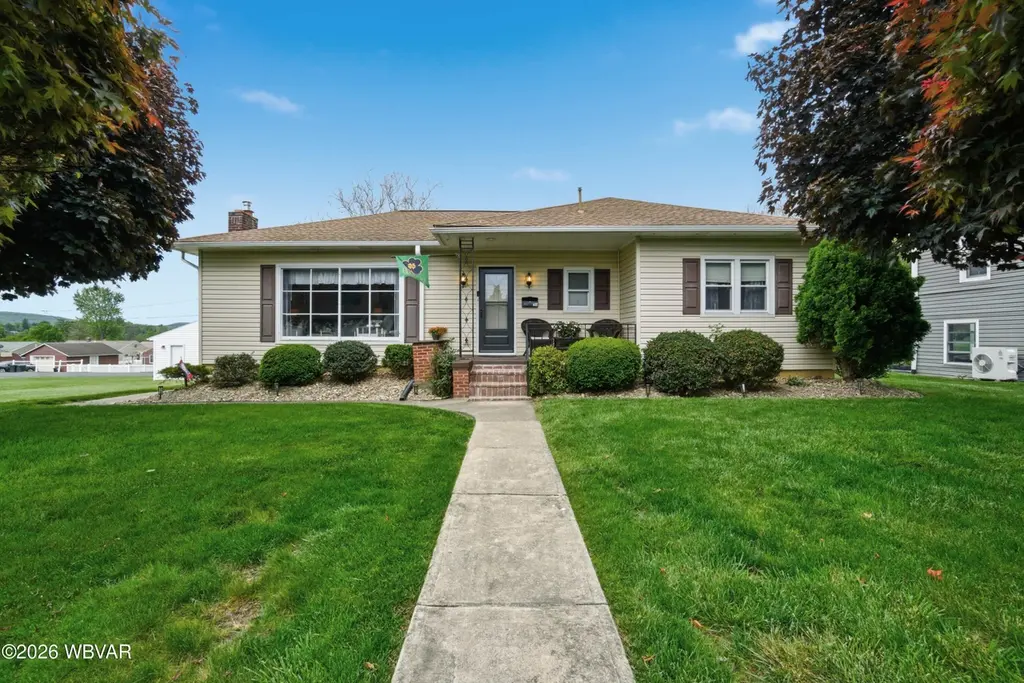
51 Jade Ave · Danville, PA
Flood risk 1/10 · Minimal
- FEMA flood zone
- X (unshaded)
- Chance of flooding over 30 yrs
- 0.0%
- Est. flood insurance / yr
- $507 – $1,088
Fire risk 1/10 · Minimal
- Est. fire insurance / yr
- $511 – $949
Heat risk 4/10 · Minor
- Hot days now (above 97°F)
- 7 days/yr
- Hot days in 30 yrs
- 16 days/yr
Wind risk 2/10 · Minimal
- Chance of severe wind over 30 yrs
- 4.0%
Air-quality risk 2/10 · Minimal
- Unhealthy air days now
- 1 days/yr
- Unhealthy air days in 30 yrs
- 2 days/yr
Risk factors via First Street. Map © Google.
Why this score? — see what drove the F grade
The composite is a weighted blend of 9 inputs, each scored 0–100. Each bar is that input's sub-score; the figure is the points it added to the 100-point composite (weight × sub-score).
- Cash flow +8.2/30.0
- Schools +5.0/10.0
- Livability +3.7/5.0
- Rent growth +2.5/5.0
- Condition / age +2.5/5.0
- DSCR +2.2/10.0
- 1% rule +1.7/10.0
- ARV discount +0.0/15.0
- Appreciation +0.0/10.0
$289,900
🖨 Deal sheet 📄 Offer letter ✓ Due diligence
Listing remarks MLS
Welcome to this well maintained 3 bedroom, 2 bath ranch home in the heart of Danville, PA. Set within eyesight of Geisinger Medical Center, the location is hard to beat for anyone who works at the hospital or wants quick access to everything Danville has to offer. Single floor living means no stairs to deal with, making this home a great fit for first time buyers or anyone who values comfort and convenience. With a entirely remodeled and finished basement, this home offers much more room than meets the eye.
Key facts
- Remodeled basement
- Single floor living
- 0.23 acre lot
Tags
Property features AI
Exterior
- Parking: 1-car garage with garage door opener
- Utilities: Public water; Public sewer
- Home design: Single family residence; Residential property
- Construction: Vinyl siding and frame construction; Shingle roof; Block basement; No foundation details listed; Built area includes above- and below-grade finished space
- Exterior features: Deck; Patio; Shed(s)
Interior
- Kitchen: Microwave; Dishwasher; Refrigerator
- Bedrooms: 3 bedrooms on the main level
- Bathrooms: 1 full bathroom; 1 half bathroom
- Heating & cooling: Has heating; Window unit cooling
- Interior features: Microwave; Gas water heater; Dishwasher; Refrigerator; Has basement (block)
- Laundry & utility: Washer; Dryer; Gas water heater
Neighborhood map
What this means for you Summary
Snapshot
- This is a 3-bed/1.5-bath single-family listed at $290k.
Deal economics
- At list price, monthly cash flow is $-272 ($-3k/yr) — negative.
- To cash-flow at today's rent, offer at most $242k (16.6% below list).
- To meet the 1% rule (rent ≥ 1% of price), the offer needs to be $195k (32.7% below list).
- Recommended offer: $195k (32.7% below list) — sets the bar for 1% rule.
Location & tenants
- Location reads 74/100 on livability (#508 in PA, #4,632 nationally) — a middle-class / working-renter tenant base. Strengths: cost of living A+, health & safety A+, schools A-; Watch: amenities D-, commute F, employment D-.
- Danville Area SD (suburban): math 50% / reading 67% proficiency, ranked #83 of 539 in PA (top 15%) — acceptable for families but not a draw, mixed tenant base, ~2y average lease.
- Market conditions: 70 active listings in the ZIP; 12 comparable units currently listed for rent nearby; rentals lingering (median 44d on market — plan ~5-8 weeks vacancy on turnover, expect pricing pressure); 100% of comp listings sitting > 30 days — soft ceiling on asking rent; solid renter incomes; 27 units permitted in Montour County in 2024 (0 in 5+ unit buildings).
- This rent runs 30% of the median local income ($77k/yr) — at the standard rent-burdened threshold; future hikes will face affordability resistance.
Forward outlook
- Local home prices are declining (-3.0%/yr); year-one equity from $2k of loan paydown is wiped out by about $9k of value loss. Plan a longer hold.
Negotiation context
- It's been on market 18 days — a 2% lower offer ($286k) is reasonable based on typical stale-listing flexibility.
- 2 sale attempts with the ask held roughly flat each time — persistent listings suggest the price (not the market) is what's stuck; bring a comps-based counter.
Questions for the listing agent
- What do current leases actually rent for vs. the listed asking? Can we see a recent rent roll and the last 12 months of T-12 income?
- Built in 1960 — when were the roof, HVAC, electrical panel, plumbing, and water heater last replaced?
- Is there a deadline driving the sale (1031 exchange, divorce, estate, relocation)? That informs how much negotiation room exists.
- Schools are A-rated — typically a magnet for longer-tenancy family renters. What's the average tenant stay here, and is there a school-zone premium baked into asking?
- The area grade is low — what's the realistic commute time and amenity access for the typical tenant pool here? Any planned neighborhood developments (good or bad) we should know about?
- What's the average days-on-market for RENTAL listings here right now (not sales)? A rising rental-DOM trend means longer vacancies and softer asking-rent achievability than the comps imply.
- What's the recent tenant-quality profile in this submarket — average credit score on applications, eviction rate, late-payment / NSF rate, and stable-employment percentage? A property-management company in the area should have these aggregated.
- How much new for-sale + rental construction is in the pipeline within 1–3 miles? Heavy new supply typically softens prices + rents 12–24 months out; constrained supply supports both.
Investment metrics
- 1% rule
- 0.67% ✗
- Cap rate
- 5.17%
- Cash-on-cash
- -4.02%
- DSCR
- 0.82
- GRM
- 12.4
CMA / ARV
- ARV (on-the-fly)
- $241,194
- Comps found
- 12
Show comp detail 12 sales within ~0.75 mi
| Address | Dist | Beds/Ba | Sqft | Sold | Price | $/sf | Match |
|---|---|---|---|---|---|---|---|
| 22 N Ardmoor Ave | 0.09mi | 3/1.0 | 1,200 (-9%) | 19mo | $175,000 | $146 | 63 |
| 944 Bloom Rd | 0.32mi | 3/2.5 | 1,200 (-9%) | 4mo | $220,000 | $183 | 63 |
| 92 Maple St | 0.20mi | 3/2.0 | 1,142 (-13%) | 7mo | $305,000 | $267 | 60 |
| 618 Upper St | 0.73mi | 3/2.0 | 1,281 (-3%) | 1mo | $165,000 | $129 | 58 |
| 31 Lilac Ln | 0.26mi | 3/2.5 | 1,457 (+10%) | 10mo | $304,000 | $209 | 58 |
| 854 Laurel St | 0.71mi | 3/1.0 | 1,334 (+1%) | 14mo | $110,000 | $82 | 51 |
| 147 Maple St | 0.33mi | 3/1.5 | 1,500 (+14%) | 13mo | $307,500 | $205 | 51 |
| 950 Vine St | 0.56mi | 3/1.5 | 1,230 (-7%) | 15mo | $265,000 | $215 | 50 |
| 1234 Upper Mulberry St | 0.75mi | 2/1.5 (-1) | 1,200 (-9%) | 9mo | $82,000 | $68 | 37 |
| 77 Brook St | 0.48mi | 3/2.0 | 1,152 (-13%) | 22mo | $210,000 | $182 | 36 |
| 617 Nicholas Ave | 0.62mi | 3/1.0 | 1,488 (+13%) | 17mo | $194,500 | $131 | 33 |
| 1250 Vine St | 0.65mi | 3/2.0 | 1,132 (-14%) | 23mo | $245,000 | $216 | 25 |
Match score weights: distance 35% · size 25% · config 20% · recency 20%. Top-matched comps best support the ARV.
Projected returns pro-forma
-3.0% appreciation · 3.0% rent growth · sell at horizon
- IRR
- -23.1%
- Equity multiple
- 0.21×
- Total profit
- $-64,400
- Equity at exit
- $43,225
- IRR
- -17.8%
- Equity multiple
- 0.03×
- Total profit
- $-78,756
- Equity at exit
- $25,065
Cash invested: $81,172 (down + closing). Projections, not guarantees.
Landlord ↔ Tenant lean methodology
- Overall (STATE)
- 62 Landlord-Friendly
- State Pennsylvania
- 62 Landlord-Friendly · EVEN
- County
- — inherits STATE
- City
- — inherits STATE
ZIP-level market 17821
- Home prices YoY
- -17.9%
- Active inventory
- 70
- Price-to-rent
- 12.4×
Monthly cashflow live
- Estimated rent
- $1,951 high interval (Pro) →
- Mortgage (P&I)
- −$1,520
- Tax from tax record
- −$173 /mo · $2,071/yr
- Insurance
- −$121
- HOA
- −$0
- Vacancy / Maint / Mgmt
- −$410
- Net cashflow
- $-272
Break-even live
UW: 25.0% down · 7.5% · 30yr · 1.5% tax · 5.0% vac · 8.0% maint · 8.0% mgmt
Financing live
Cash to close
- Down payment
- $72,475
- Closing costs
- $8,697
- Reserves months
- —
- Total cash needed
- —
Loan-product check · same deal, 3 products live
Conventional
25% down · 7.5% · 30yr
- Down + closing
- —
- Monthly P&I
- —
- Monthly cashflow
- —
- DSCR
- —
- Eligible?
- —
Personal DTI + credit; lowest rate.
DSCR
20% down · 8.5% · 30yr
- Down + closing
- —
- Monthly P&I
- —
- Monthly cashflow
- —
- DSCR
- —
- Eligible?
- —
No personal income docs; deal must DSCR.
Hard money
10% down · 12.0% · 12mo
- Down + closing
- —
- Monthly P&I
- —
- Monthly cashflow
- —
- DSCR
- —
- Eligible?
- —
Short-term bridge; refi at stabilization.
Rent comps 12 comps
| Address | Beds | Baths | Sqft | Rent | $/sqft | DOM | Units | Dist |
|---|---|---|---|---|---|---|---|---|
| 33 N Ardmoor Ave Danville, PA | 4.0 | 2.0 | 1606 | $2,195 | $1.37 | 43d | 1 | 0.07mi |
| 937 Poplar Ave Danville, PA | 3.0 | 1.0 | 1300 | $1,600 | $1.23 | 43d | 1 | 0.45mi |
| 818 C St Danville, PA | 3.0 | 1.5 | 1664 | $2,195 | $1.32 | 43d | 1 | 0.49mi |
| 972 Cherry St Danville, PA | 2.0 | 1.0 | 1252 | $1,795 | $1.43 | 43d | 1 | 0.50mi |
| 1014 Vine St Danville, PA | 2.0 | 1.0 | 1000 | $1,700 | $1.70 | 43d | 1 | 0.58mi |
| 1107 Vine St Danville, PA | 2.0 | 1.0 | 1100 | $1,550 | $1.41 | 43d | 1 | 0.61mi |
| 986 Ash St Unit 101 Danville, PA | 3.0 | 1.0 | 1126 | $1,595 | $1.42 | 43d | 1 | 0.62mi |
| 1016 Ash St Danville, PA | 3.0 | 1.5 | 1496 | $2,795 | $1.87 | 43d | 1 | 0.63mi |
| 534 Nicholas Ave Danville, PA | 3.0 | 2.5 | 1250 | $1,700 | $1.36 | 43d | 1 | 0.65mi |
| 1146 Upper Mulberry St Danville, PA | 4.0 | 1.5 | 1456 | $1,795 | $1.23 | 43d | 1 | 0.72mi |
| 1737 First St Unit 1737 Danville, PA | 2.0 | 1.0 | 1082 | $1,500 | $1.39 | 43d | 1 | 0.91mi |
| 27 Village Pointe Ln Unit 27 Danville, PA | 3.0 | 1.5 | 1253 | $1,650 | $1.32 | 43d | 1 | 1.05mi |
Listing history 11 events
-
2026-06-12status $289,900 Pending 18 DOM
-
2026-06-09days on market $289,900 Active Under Contract 18 DOM
-
2026-06-08days on market $289,900 Active Under Contract 17 DOM
-
2026-06-07days on market $289,900 Active Under Contract 16 DOM
-
2026-06-03days on market $289,900 Active Under Contract 12 DOM
-
2026-06-02days on market $289,900 Active Under Contract 11 DOM
-
2026-06-01days on market $289,900 Active Under Contract 10 DOM
-
2026-05-31days on market $289,900 Active Under Contract 9 DOM
-
2026-05-30days on market $289,900 Active Under Contract 8 DOM
-
2026-05-22$289,900 Active 512-char remark
Show marketing remark (512 chars)
Welcome to this well maintained 3 bedroom, 2 bath ranch home in the heart of Danville, PA. Set within eyesight of Geisinger Medical Center, the location is hard to beat for anyone who works at the hospital or wants quick access to everything Danville has to offer. Single floor living means no stairs to deal with, making this home a great fit for first time buyers or anyone who values comfort and convenience. With a entirely remodeled and finished basement, this home offers much more room than meets the eye.
-
2026-05-22$289,900 Active
Show marketing remark (512 chars)
Welcome to this well maintained 3 bedroom, 2 bath ranch home in the heart of Danville, PA. Set within eyesight of Geisinger Medical Center, the location is hard to beat for anyone who works at the hospital or wants quick access to everything Danville has to offer. Single floor living means no stairs to deal with, making this home a great fit for first time buyers or anyone who values comfort and convenience. With a entirely remodeled and finished basement, this home offers much more room than meets the eye.
ⓘ Source: listings_history table (triggers on properties + properties_extension) + one-shot
backfill from property_details.listing_events for pre-trigger history.
Tax reassessment forecast PA · Partial reset (capped growth)
- Current annual tax
- $2,071 · $173/mo
- Projected year-2 tax
- $3,326 · $277/mo
- Expected delta
- +$1,255/yr (+$105/mo · 60.6%)
ⓘ Screening estimate from a state-policy table — verify with the county assessor before closing.
Climate risk First Street
- Flood 1/10 Low FEMA zone X (unshaded) · 0% chance over 30 yrs
- Wildfire 1/10 Low
- Heat 4/10 Moderate 7 d/yr ≥97°F today · 16 d/yr by 30 yrs out
- Wind 2/10 Low 4% chance of damaging wind over 30 yrs
- Air quality 2/10 Low 1 unhealthy d/yr today · 2 by 30 yrs out
Nearby sold comps map
Loading sold comps map…
Walkable amenities ~0.75 mi
Loading nearby amenities…
Taxation est. · year 1
- Rental income
- $23,414
- − Mortgage interest
- −$16,239
- − Property taxes
- −$2,071
- − Insurance
- −$1,450
- − Repairs & maintenance
- −$1,873
- − Management
- −$1,873
- − Depreciation
- −$8,433
- Taxable loss
- −$8,525
- Est. tax savings @ 24.0%
- +$2,046
- After-tax cash flow
- $-1,220/yr
For passive investors: Depreciation is non-cash, so a rental often shows a tax loss while cash-flowing — sheltering income. Rental losses are passive: they offset passive income freely, and up to $25,000/yr can offset ordinary (W-2) income if you actively participate and your MAGI is under $100k (phasing out to $0 by $150k); unused losses carry forward. On sale, claimed depreciation is recaptured at up to 25%, and gains may owe capital-gains tax (a 1031 exchange can defer both). Figures are a year-1 estimate at your 24.0% rate — not tax advice; consult a CPA.
Schools (NCES district)
- District
- Danville Area SD
- NCES district ID
- 4207320
- Math proficiency
- 50% ▼ -12.00%
- Reading proficiency
- 67% ▼ -8.00%
- Median HH income
- $51,554
- Composite
- 49.92/100
- National rank
- #1939
- State rank
- #83 of 539 in PA
Livability — Danville
- Score
- 74/100
- State rank
- #508
- US rank
- #4632
Category grades
Schools grade is shown separately in the Schools card above.
Census & demographics
- County
- Montour County · 18,613 people
- City population
- 18,613
- Metro
- Bloomsburg-Berwick, PA
- Population (ZIP)
- 18,613
- Household income
- $76,971
- Rent vs Own
- Severe rent burden
- 361.0
Population outlook (Montour County) Hauer SSP2
- Today (2025)
- 18,673 people
- By 2030
- 18,660 · -0.1%
- By 2040
- 18,522 · -0.8%
- By 2050
- 18,239 · -2.3%
- By 2075
- 17,636 · -5.6%
- By 2100
- 16,283 · -12.8%
Race, ethnicity, and origin ACS 2023
- Neighborhood character
- Predominantly White (89%)
- Race & ethnicity
- White 89% Hispanic / Latino 3% Asian 3% Two or more races 3% Black 2%
- Common ancestry
- Romanian 5% Iranian 3% Slovak 2%
- Foreign-born
- 5% · Canada, China, Jamaica
- Languages at home
- 93% English-only · Spanish 2% Other Indo-European 2% German/W. Germanic 1%
Political lean MEDSL · Montour
- 2024 margin
- Strong R (+21.0) · D 39.0% · R 60.0% · Other 1.0%
- 2008→2024 swing
- -5.9pp toward R · 2008: -15.1pp · 2024: -21.0pp
- All cycles
- 2024: R+21.0 2020: R+21.1 2016: R+28.4 2012: R+20.7 2008: R+15.1
Not yet ingested
- Civics
- —
Market trends
- HPI YoY
- ▼ -41.95%
- Current HPI
- 192.6962
- Rent YoY
- —
- Metro
- Bloomsburg-Berwick, PA
- State GDP YoY
- ▲ 1.68%
- F500 in state
- 34
Industry mix (Fortune 500 HQ in PA)
| Industry | F500 HQs | Revenue |
|---|---|---|
| Healthcare | 2 | $309B |
|
||
| Insurance | 2 | $27B |
|
||
| Telecommunications / Media | 1 | $124B |
|
||
| Industrial Distribution | 1 | $22B |
|
||
| Financial Services | 1 | $20B |
|
||
| Chemicals / Materials | 1 | $18B |
|
||
Price history
+0.0% since first listed2 events — show timeline
- 2026-05-22 Listed $289,900 CSVBR
- 2026-05-22 Listed $289,900 WBVAR
Property tax history
+2.1%/yrLatest (2026): $2,071 · +8.3% YoY. Source: county tax records.
Cash-flow waterfall
monthlySold comps — $/sqft
last 12 mo · ≤1 miLoading sold comps…