 Fourplex
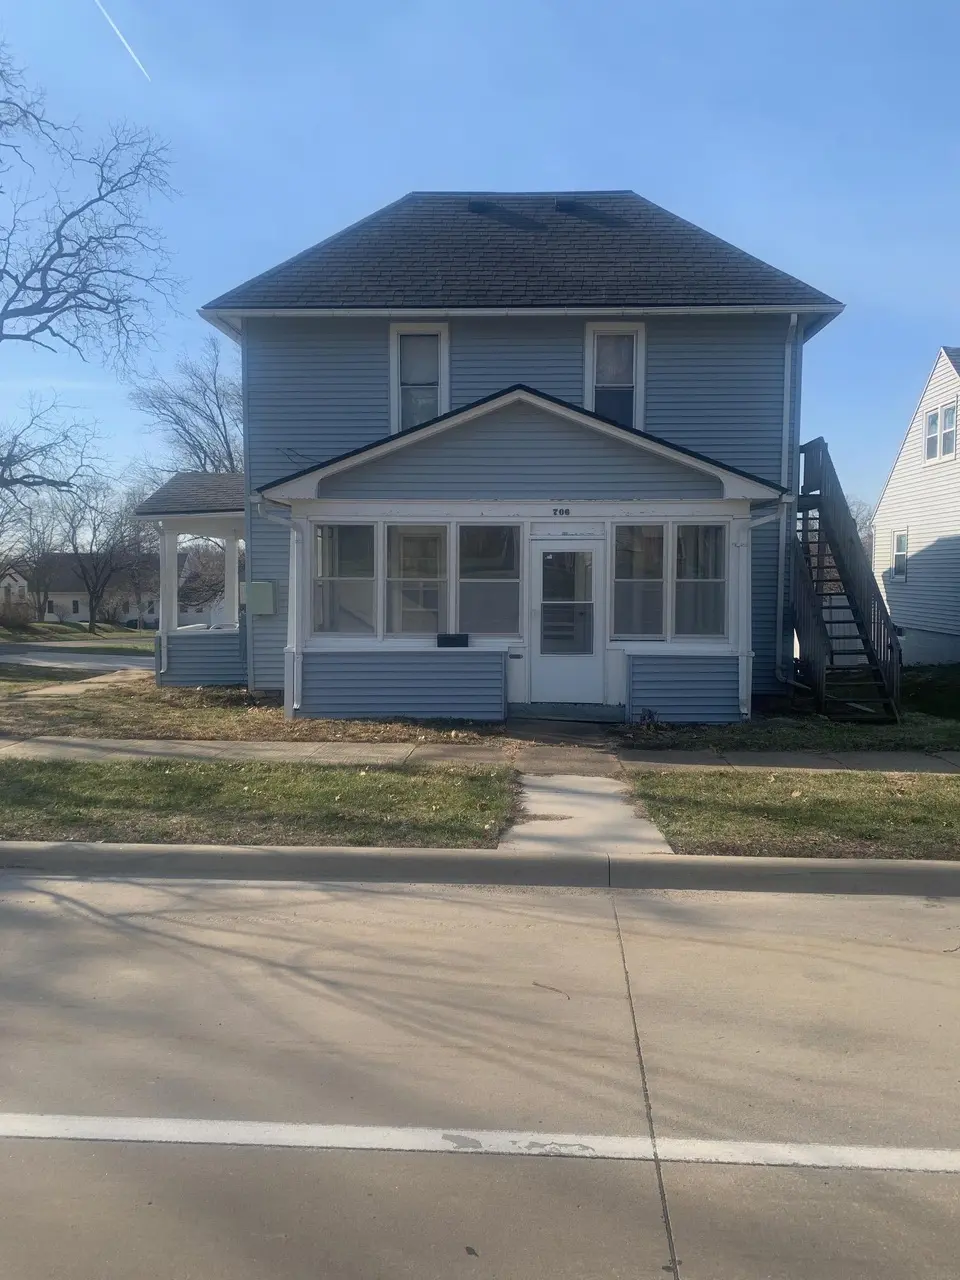
706 W 12th St · Cedar Falls, IA
Flood risk 1/10 · Minimal
- FEMA flood zone
- X (unshaded)
- Chance of flooding over 30 yrs
- 0.0%
- Est. flood insurance / yr
- $473 – $860
Fire risk 3/10 · Minor
- Est. fire insurance / yr
- $902 – $1,676
Heat risk 3/10 · Minor
- Hot days now (above 101°F)
- 7 days/yr
- Hot days in 30 yrs
- 15 days/yr
Wind risk 2/10 · Minimal
- Chance of severe wind over 30 yrs
- —
Air-quality risk 1/10 · Minimal
- Unhealthy air days now
- 0 days/yr
- Unhealthy air days in 30 yrs
- 0 days/yr
Risk factors via First Street. Map © Google.
Why this score? — see what drove the B+ grade
The composite is a weighted blend of 9 inputs, each scored 0–100. Each bar is that input's sub-score; the figure is the points it added to the 100-point composite (weight × sub-score).
- Cash flow +30.0/30.0
- ARV discount +13.8/15.0
- DSCR +10.0/10.0
- 1% rule +9.3/10.0
- Schools +6.6/10.0
- Livability +4.0/5.0
- Rent growth +3.0/5.0
- Condition / age +2.5/5.0
- Appreciation +0.0/10.0
$270,000
🖨 Deal sheet 📄 Offer letter ✓ Due diligence
Multi-family units
County records classify this as Multi-Family (2-4 Unit). Listing-text estimate: 4 units. confirmed
Listing remarks MLS
Calling all investors! A great income producing opportunity in the heart of Cedar Falls - Three of four units currently leased. Rent roll and p/l available upon request.
Key facts
- New siding
- 0.24 acre lot
- 4 garage spots
Tags
Property features AI
Finance
- Other: Property type: Residential income
- Financial info: Unit rents reported: $750, $750, $850, $775
Exterior
- Parking: Detached garage; Four garage spaces; Four additional open paved parking spaces
- Utilities: Public water; Public sewer
- Home design: Residential income property — quadruplex; Two levels
- Construction: Vinyl siding construction; Asphalt roof; Two-story building
- Exterior features: Asphalt roof; Vinyl siding; Lot approximately 78 x 132 (0.24 acre); Zoned R-M
Interior
- Bathrooms: Four units each with 1 bathroom
- Heating & cooling: Forced air heating (natural gas); Window unit cooling
- Interior features: Window air conditioning units; Forced air heating (natural gas)
- Laundry & utility: No laundry on-site (none listed)
Neighborhood map
What this means for you Summary
Snapshot
- This is a 4 × 1-bed/1-bath units multifamily listed at $270k.
Deal economics
- At list price, monthly cash flow is $1k ($15k/yr) — positive. Per door: $318/mo.
- The deal already cash-flows at list — no discount required.
- Meets the 1% rule at list price ($4k rent vs $270k).
- Recommended offer: $262k (3.0% below list) — sets the bar for market timing.
- Cap rate 12.0% vs local median 3.1% in Cedar Falls — top-decile yield for the area; either an underpriced asset or a hidden risk that comps aren't pricing in. Stress-test before assuming the spread holds.
Location & tenants
- Location reads 81/100 on livability (#60 in IA, #1,357 nationally) — a professional / high-income tenant draw. Strengths: cost of living A+, housing A+, health & safety A+; Watch: amenities D, commute F.
- Cedar Falls Community School District (urban): math 76% / reading 79% proficiency, ranked #45 of 289 in IA (top 16%) — strong family-tenant draw, lease renewals of 3-5y typical; only 18% free/reduced lunch — higher-income household profile.
- Zoned schools: Lincoln Elementary School (math 66% / reading 71%, grade B+, #266 of 616 statewide, top 43%, 453 students, 45% FRL); Holmes Junior High School (math 79% / reading 78%, grade A+, #44 of 246 statewide, top 19%, 639 students, 28% FRL); Cedar Falls High School (math 74% / reading 78%, grade A-, #75 of 336 statewide, top 23%, 1,302 students, 24% FRL).
- Market conditions: Rents rising (+2.0%/yr); 387 active listings in the ZIP; 4 comparable units currently listed for rent nearby; rentals at typical pace (median 21d on market — plan ~3-4 weeks tenant-placement turnaround); solid renter incomes; 287 units permitted in Black Hawk County in 2024 (67 in 5+ unit buildings).
- At $3,857/mo this rent would consume 59% of the median local household income ($79k/yr) (locally 1514% of renters already pay >50% of income on rent) — very limited rent-growth headroom before tenants either downsize or default.
Forward outlook
- Local home prices are declining (-3.0%/yr); year-one equity from $2k of loan paydown is wiped out by about $8k of value loss. Plan a longer hold.
- Black Hawk County population projected at +10% by 2050 — modest demand growth; plan on rents tracking national, not racing it.
- At projected returns (-3.0% appreciation + 2.0% rent growth), your $76k cash investment doubles in ~7 years — after that, you're playing with house money.
Negotiation context
- It's been on market 57 days — a 3% lower offer ($262k) is reasonable based on typical stale-listing flexibility.
- 2 sale attempts since 4y ago with the ask held roughly flat each time — persistent listings suggest the price (not the market) is what's stuck; bring a comps-based counter.
- Current owner paid $230k; 17% above their basis — modest negotiation headroom, anchor on the comps not their cost.
Risks & watch-outs
- Watch-outs: built in 1900 — expect roof / HVAC / electrical / plumbing capex.
Questions for the listing agent
- It's been on market 57 days. Have you received any prior offers? Is the seller open to a 3% concession, seller financing, or rate buy-down credit?
- Can we see the unit-by-unit rent roll, current vacancy, and any below-market leases? What's the average tenancy length?
- What capital expenditures (roof, boiler, parking lot, exteriors) have been made in the last 5 years, and what's planned in the next 2?
- Built in 1900 — when were the roof, HVAC, electrical panel, plumbing, and water heater last replaced?
- Is there a deadline driving the sale (1031 exchange, divorce, estate, relocation)? That informs how much negotiation room exists.
- Schools are A-rated — typically a magnet for longer-tenancy family renters. What's the average tenant stay here, and is there a school-zone premium baked into asking?
- What's the average days-on-market for RENTAL listings here right now (not sales)? A rising rental-DOM trend means longer vacancies and softer asking-rent achievability than the comps imply.
- What's the recent tenant-quality profile in this submarket — average credit score on applications, eviction rate, late-payment / NSF rate, and stable-employment percentage? A property-management company in the area should have these aggregated.
- How much new apartment / multifamily construction is in the pipeline within 1–3 miles? Heavy new supply (>2% of stock underway) typically softens rents 12–24 months out; light construction supports rent growth.
Investment metrics
- 1% rule
- 1.43% ✓
- Cap rate
- 11.95%
- Cash-on-cash
- 20.21%
- DSCR
- 1.90
- GRM
- 5.8
CMA / ARV
- ARV (median comp)
- $313,833
- List price
- $270,000
- Delta
- -13.97%
- Verdict
- UNDERPRICED
- Comps
- 2 within 2.0 mi
Show comp detail 1 sale within ~0.75 mi
| Address | Dist | Beds/Ba | Sqft | Sold | Price | $/sf | Match |
|---|---|---|---|---|---|---|---|
| 115 W 15th St | 0.41mi | 4/3.0 | 2,097 (+1%) | 14mo | $142,800 | $68 | 57 |
Match score weights: distance 35% · size 25% · config 20% · recency 20%. Top-matched comps best support the ARV.
Projected returns pro-forma
-3.0% appreciation · 1.97% rent growth · sell at horizon
- IRR
- 11.3%
- Equity multiple
- 1.44×
- Total profit
- $33,379
- Equity at exit
- $40,258
- IRR
- 19.5%
- Equity multiple
- 2.56×
- Total profit
- $117,580
- Equity at exit
- $23,345
Cash invested: $75,600 (down + closing). Projections, not guarantees.
Landlord ↔ Tenant lean methodology
- Overall (STATE)
- 83 Strongly Landlord-Friendly
- State Iowa
- 83 Strongly Landlord-Friendly · R+6
- County
- — inherits STATE
- City
- — inherits STATE
ZIP-level market 50613
- Rents YoY
- 2.0%
- Active inventory
- 387
- Price-to-rent
- 23.3×
Monthly cashflow live
- Estimated rent
- $3,857 high interval (Pro) →
- Mortgage (P&I)
- −$1,416
- Tax from tax record
- −$246 /mo · $2,946/yr
- Insurance
- −$112
- HOA
- −$0
- Vacancy / Maint / Mgmt
- −$810
- Net cashflow
- $1,273
Break-even live
4-unit breakdown (identical units grouped — click to expand)
| Units | Beds | Baths | Est. rent |
|---|---|---|---|
| 4× units | 1 | 1 | $3,856 |
| #1 | 1 | 1 | $964 |
| #2 | 1 | 1 | $964 |
| #3 | 1 | 1 | $964 |
| #4 | 1 | 1 | $964 |
| Total (4 units) | $3,857 | ||
UW: 25.0% down · 7.5% · 30yr · 1.5% tax · 5.0% vac · 8.0% maint · 8.0% mgmt
Financing live
Cash to close
- Down payment
- $67,500
- Closing costs
- $8,100
- Reserves months
- —
- Total cash needed
- —
Loan-product check · same deal, 3 products live
Conventional
25% down · 7.5% · 30yr
- Down + closing
- —
- Monthly P&I
- —
- Monthly cashflow
- —
- DSCR
- —
- Eligible?
- —
Personal DTI + credit; lowest rate.
DSCR
20% down · 8.5% · 30yr
- Down + closing
- —
- Monthly P&I
- —
- Monthly cashflow
- —
- DSCR
- —
- Eligible?
- —
No personal income docs; deal must DSCR.
Hard money
10% down · 12.0% · 12mo
- Down + closing
- —
- Monthly P&I
- —
- Monthly cashflow
- —
- DSCR
- —
- Eligible?
- —
Short-term bridge; refi at stabilization.
Rent comps 4 comps
| Address | Beds | Baths | Sqft | Rent | $/sqft | DOM | Units | Dist |
|---|---|---|---|---|---|---|---|---|
| 1122 Franklin St Unit 1122 Cedar Falls, IA | 5.0 | 2.0 | 1992 | $2,800 | $1.41 | 21d | 1 | 0.25mi |
| 1320-1322 Delta Dr Unit 1322 (South Side) Cedar Falls, IA | 3.0 | 2.0 | 1664 | $1,350 | $0.81 | 44d | 1 | 0.61mi |
| 604 W Seerley Blvd Cedar Falls, IA | 4.0 | 1.5 | 1600 | $1,300 | $0.81 | 21d | 1 | 0.79mi |
| 2609 Olive St Cedar Falls, IA | 4.0 | 2.0–2.5 | 1568 | $1,750 | $1.12 | 21d | 6 | 0.92mi |
Listing history 24 events
-
2026-06-19days on market $270,000 Active 57 DOM
-
2026-06-18days on market $270,000 Active 56 DOM
-
2026-06-17days on market $270,000 Active 55 DOM
-
2026-06-16days on market $270,000 Active 54 DOM
-
2026-06-15days on market $270,000 Active 53 DOM
-
2026-06-14days on market $270,000 Active 51 DOM
-
2026-06-13days on market $270,000 Active 50 DOM
-
2026-06-10days on market $270,000 Active 48 DOM
-
2026-06-09days on market $270,000 Active 47 DOM
-
2026-06-08days on market $270,000 Active 46 DOM
-
2026-06-07days on market $270,000 Active 45 DOM
-
2026-06-05days on market $270,000 Active 42 DOM
-
2026-06-03days on market $270,000 Active 41 DOM
-
2026-06-02days on market $270,000 Active 40 DOM
-
2026-06-01days on market $270,000 Active 39 DOM
-
2026-05-31days on market $270,000 Active 38 DOM
-
2026-05-30days on market $270,000 Active 37 DOM
-
2026-04-30price $270,000 484-char remark
-
2026-03-30$280,000 Active 484-char remark
-
2023-01-30soldstatus $230,000
-
2023-01-27soldstatus $230,000 Closed 169-char remark
Show marketing remark (169 chars)
Calling all investors! A great income producing opportunity in the heart of Cedar Falls - Three of four units currently leased. Rent roll and p/l available upon request.
-
2022-12-28status Pending 169-char remark
Show marketing remark (169 chars)
Calling all investors! A great income producing opportunity in the heart of Cedar Falls - Three of four units currently leased. Rent roll and p/l available upon request.
-
2022-11-04$249,000 Active 169-char remark
Show marketing remark (169 chars)
Calling all investors! A great income producing opportunity in the heart of Cedar Falls - Three of four units currently leased. Rent roll and p/l available upon request.
-
2012-12-28soldstatus $117,000
ⓘ Source: listings_history table (triggers on properties + properties_extension) + one-shot
backfill from property_details.listing_events for pre-trigger history.
Tax reassessment forecast IA · Partial reset (capped growth)
- Current annual tax
- $2,946 · $246/mo
- Projected year-2 tax
- $3,592 · $299/mo
- Expected delta
- +$646/yr (+$54/mo · 21.9%)
ⓘ Screening estimate from a state-policy table — verify with the county assessor before closing.
Climate risk First Street
- Flood 1/10 Low FEMA zone X (unshaded) · 0% chance over 30 yrs
- Wildfire 3/10 Moderate
- Heat 3/10 Moderate 7 d/yr ≥101°F today · 15 d/yr by 30 yrs out
- Wind 2/10 Low
- Air quality 1/10 Low 0 unhealthy d/yr today · 0 by 30 yrs out
Nearby sold comps map
Loading sold comps map…
Walkable amenities ~0.75 mi
Loading nearby amenities…
Taxation est. · year 1
- Rental income
- $46,284
- − Mortgage interest
- −$15,124
- − Property taxes
- −$2,946
- − Insurance
- −$1,350
- − Repairs & maintenance
- −$3,703
- − Management
- −$3,703
- − Depreciation
- −$7,855
- Taxable income
- $11,604
- Est. tax owed @ 24.0%
- −$2,785
- After-tax cash flow
- $12,493/yr
For passive investors: Depreciation is non-cash, so a rental often shows a tax loss while cash-flowing — sheltering income. Rental losses are passive: they offset passive income freely, and up to $25,000/yr can offset ordinary (W-2) income if you actively participate and your MAGI is under $100k (phasing out to $0 by $150k); unused losses carry forward. On sale, claimed depreciation is recaptured at up to 25%, and gains may owe capital-gains tax (a 1031 exchange can defer both). Figures are a year-1 estimate at your 24.0% rate — not tax advice; consult a CPA.
Schools (NCES district)
- District
- Cedar Falls Community School District
- NCES district ID
- 1906510
- Math proficiency
- 76% ▼ -6.00%
- Reading proficiency
- 79% ▼ -2.00%
- Median HH income
- $53,634
- Composite
- 65.93/100
- National rank
- #443
- State rank
- #45 of 289 in IA
Livability — Cedar Falls
- Score
- 81/100
- State rank
- #60
- US rank
- #1357
Category grades
Schools grade is shown separately in the Schools card above.
Census & demographics
- Census place
- Cedar Falls, IA
- County
- Black Hawk County · 112,933 people
- City population
- 43,867
- Metro
- Waterloo-Cedar Falls, IA
- Population (ZIP)
- 43,867
- Household income
- $78,503
- Rent vs Own
- Severe rent burden
- 1514.0
Population outlook (Black Hawk County) Hauer SSP2
- Today (2025)
- 139,716 people
- By 2030
- 142,853 · +2.2%
- By 2040
- 147,843 · +5.8%
- By 2050
- 153,247 · +9.7%
- By 2075
- 167,977 · +20.2%
- By 2100
- 177,320 · +26.9%
Race, ethnicity, and origin ACS 2023
- Neighborhood character
- Predominantly White (90%)
- Race & ethnicity
- White 90% Asian 3% Two or more races 3% Hispanic / Latino 3% Black 1%
- Common ancestry
- Portuguese 6% Italian 3% Iranian 3%
- Foreign-born
- 4% · Canada, South Korea
- Languages at home
- 95% English-only · Spanish 2% Russian/Polish/Slavic 1% Other Indo-European 1%
Political lean MEDSL · Black Hawk
- 2024 margin
- Toss-up / Even · D 50.0% · R 48.8% · Other 1.2%
- 2008→2024 swing
- -21.3pp toward R · 2008: 22.4pp · 2024: 1.2pp
- All cycles
- 2024: D+1.2 2020: D+9.0 2016: D+7.3 2012: D+20.0 2008: D+22.4
Not yet ingested
- Civics
- —
Market trends
- HPI YoY
- ▼ -175.51%
- Current HPI
- 169.0591
- Rent YoY
- ▲ 1.97%
- Metro
- Waterloo-Cedar Falls, IA
- State GDP YoY
- ▲ 2.48%
- F500 in state
- 4
Industry mix (Fortune 500 HQ in IA)
| Industry | F500 HQs | Revenue |
|---|---|---|
| Financial Services | 1 | $16B |
|
||
| Retail / Convenience | 1 | $15B |
|
||
Price history
+130.8% since first listed7 events — show timeline
- 2026-04-30 Price Changed $270,000 NEIRBR as distributed by MLS GRID
- 2026-03-30 Listed $280,000 NEIRBR as distributed by MLS GRID
- 2023-01-30 Sold (Public Records) $230,000 Public Records
- 2023-01-27 Sold (MLS) $230,000 NEIRBR as distributed by MLS GRID
- 2022-12-28 Pending — NEIRBR as distributed by MLS GRID
- 2022-11-04 Listed $249,000 NEIRBR as distributed by MLS GRID
- 2012-12-28 Sold (Public Records) $117,000 Public Records
Property tax history
+3.4%/yrLatest (2025): $2,946 · +2.9% YoY. Source: county tax records.
Cash-flow waterfall
monthlySold comps — $/sqft
last 12 mo · ≤1 miLoading sold comps…