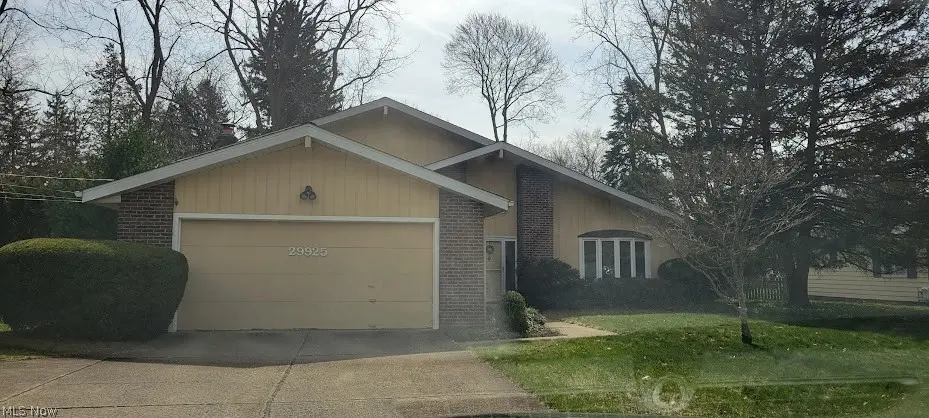
29925 Winsor Dr · Bay Village, OH
Flood risk 1/10 · Minimal
- FEMA flood zone
- X (unshaded)
- Chance of flooding over 30 yrs
- 0.0%
- Est. flood insurance / yr
- $473 – $860
Fire risk 1/10 · Minimal
- Est. fire insurance / yr
- $713 – $1,323
Heat risk 3/10 · Minor
- Hot days now (above 96°F)
- 7 days/yr
- Hot days in 30 yrs
- 18 days/yr
Wind risk 1/10 · Minimal
- Chance of severe wind over 30 yrs
- —
Air-quality risk 2/10 · Minimal
- Unhealthy air days now
- 2 days/yr
- Unhealthy air days in 30 yrs
- 2 days/yr
Risk factors via First Street. Map © Google.
Why this score? — see what drove the D+ grade
The composite is a weighted blend of 9 inputs, each scored 0–100. Each bar is that input's sub-score; the figure is the points it added to the 100-point composite (weight × sub-score).
- ARV discount +13.3/15.0
- Cash flow +11.7/30.0
- Schools +7.6/10.0
- Livability +4.1/5.0
- 1% rule +3.9/10.0
- DSCR +3.4/10.0
- Rent growth +2.5/5.0
- Condition / age +2.5/5.0
- Appreciation +0.0/10.0
$460,000
🖨 Deal sheet (PDF) 📄 Offer letter ✓ Due diligence
Listing remarks MLS
A Lot Of House In A Great Location * Large Lot W/ Private Setti Ng * Newer Crpt In Liv Rm & Din Rm * Newer Kitch W/ All Appl Stay H2o New 2/00 * Wbfp In Fam Rm * Enclosed 3 Season Sunroom * Den On Lower Level Could Be Bdrm * Washer & Dryer Stay * 12x11 Sitting Rm Off Master * 24 Hr Notice For Showing * Swingset No Stay *
Key facts
- 0.54 acre lot
- 2 garage spots
- Built 1975
Neighborhood map
What this means for you Summary
Snapshot
- This is a 3-bed/2.5-bath single-family listed at $460k.
Deal economics
- At list price, monthly cash flow is $-138 ($-2k/yr) — negative.
- To cash-flow at today's rent, offer at most $436k (5.3% below list).
- To meet the 1% rule (rent ≥ 1% of price), the offer needs to be $410k (10.9% below list).
- Recommended offer: $410k (10.9% below list) — sets the bar for 1% rule.
- Cap rate 5.9% vs local median 3.2% in Bay Village — top-decile yield for the area; either an underpriced asset or a hidden risk that comps aren't pricing in. Stress-test before assuming the spread holds.
Location & tenants
- Location reads 82/100 on livability (#83 in OH, #1,228 nationally) — a professional / high-income tenant draw. Strengths: crime A+, employment A+, housing A+; Watch: amenities D-, commute F.
- Bay Village City (suburban): math 85% / reading 87% proficiency, ranked #15 of 656 in OH (top 2%) — strong family-tenant draw, lease renewals of 3-5y typical; only 6% free/reduced lunch — higher-income household profile.
- Zoned schools: Normandy Elementary School (498 students, 6% FRL); Bay Middle School (math 86% / reading 86%, grade A+, #13 of 654 statewide, top 2%, 700 students, 7% FRL); Bay High School (math 72% / reading 92%, grade A, #23 of 781 statewide, top 3%, 781 students, 4% FRL) — zoned schools at 6% FRL track the district average.
- Market conditions: 73 active listings in the ZIP; 2 comparable units currently listed for rent nearby; high-income renter base; 1,441 units permitted in Cuyahoga County in 2024 (700 in 5+ unit buildings).
- This rent runs 40% of the median local income ($122k/yr) — at the standard rent-burdened threshold; future hikes will face affordability resistance.
Forward outlook
- Local home prices are declining (-3.0%/yr); year-one equity from $3k of loan paydown is wiped out by about $14k of value loss. Plan a longer hold.
- Cuyahoga County population projected to shrink 8% by 2050 — rents likely to lag national; underwrite the cash flow, not the appreciation.
Negotiation context
- Only 0 days on market — expect competitive offers; lowballing is unlikely to land.
- 6 sale attempts since 31y ago with the ask held roughly flat each time — persistent listings suggest the price (not the market) is what's stuck; bring a comps-based counter.
- Current owner paid $186k; list at $460k implies a 147% gain — meaningful room to come down on a strong offer.
Questions for the listing agent
- What do current leases actually rent for vs. the listed asking? Can we see a recent rent roll and the last 12 months of T-12 income?
- Built in 1975 — when were the roof, HVAC, electrical panel, plumbing, and water heater last replaced?
- Is there a deadline driving the sale (1031 exchange, divorce, estate, relocation)? That informs how much negotiation room exists.
- Schools are A-rated — typically a magnet for longer-tenancy family renters. What's the average tenant stay here, and is there a school-zone premium baked into asking?
- The area grade is low — what's the realistic commute time and amenity access for the typical tenant pool here? Any planned neighborhood developments (good or bad) we should know about?
- What's the average days-on-market for RENTAL listings here right now (not sales)? A rising rental-DOM trend means longer vacancies and softer asking-rent achievability than the comps imply.
- What's the recent tenant-quality profile in this submarket — average credit score on applications, eviction rate, late-payment / NSF rate, and stable-employment percentage? A property-management company in the area should have these aggregated.
- How much new for-sale + rental construction is in the pipeline within 1–3 miles? Heavy new supply typically softens prices + rents 12–24 months out; constrained supply supports both.
Investment metrics
- 1% rule
- 0.89% ✗
- Cap rate
- 5.93%
- Cash-on-cash
- -1.29%
- DSCR
- 0.94
- GRM
- 9.3
CMA / ARV
- ARV (on-the-fly)
- $528,480
- Comps found
- 12
Show comp detail 12 sales within ~0.75 mi
| Address | Dist | Beds/Ba | Sqft | Sold | Price | $/sf | Match |
|---|---|---|---|---|---|---|---|
| 29925 Winsor Dr | 0.00mi | 3/2.5 | 2,202 (0%) | 1mo | $460,000 | $209 | 99 |
| 30122 Ednil Dr | 0.15mi | 3/2.0 | 2,192 (-0%) | 11mo | $530,000 | $242 | 81 |
| 30208 Applewood Dr | 0.18mi | 3/2.5 | 2,417 (+10%) | 11mo | $579,000 | $240 | 67 |
| 30400 Crestview Dr | 0.52mi | 4/3.0 (+1) | 2,222 (+1%) | 8mo | $549,000 | $247 | 60 |
| 29500 Osborn Rd | 0.53mi | 4/2.5 (+1) | 2,044 (-7%) | 3mo | $465,000 | $227 | 56 |
| 30513 Ednil Dr | 0.37mi | 4/2.0 (+1) | 2,462 (+12%) | 3mo | $500,000 | $203 | 54 |
| 31117 Walker Rd | 0.70mi | 4/2.5 (+1) | 2,113 (-4%) | 4mo | $465,000 | $220 | 52 |
| 384 Walmar Rd | 0.74mi | 4/2.5 (+1) | 2,147 (-2%) | 5mo | $550,000 | $256 | 52 |
| 30525 Ednil Dr | 0.41mi | 4/2.0 (+1) | 2,490 (+13%) | 1mo | $450,000 | $181 | 51 |
| 31100 Bexley Dr | 0.66mi | 4/2.5 (+1) | 1,962 (-11%) | 2mo | $496,000 | $253 | 44 |
| 578 Wildbrook Dr | 0.62mi | 4/2.5 (+1) | 2,496 (+13%) | 2mo | $561,000 | $225 | 42 |
| 30907 Arlington Cir | 0.73mi | 4/2.5 (+1) | 2,436 (+11%) | 7mo | $639,000 | $262 | 38 |
Match score weights: distance 35% · size 25% · config 20% · recency 20%. Top-matched comps best support the ARV.
Projected returns pro-forma
-3.0% appreciation · 3.0% rent growth · sell at horizon
- IRR
- -18.4%
- Equity multiple
- 0.35×
- Total profit
- $-83,161
- Equity at exit
- $68,587
- IRR
- -10.6%
- Equity multiple
- 0.36×
- Total profit
- $-83,007
- Equity at exit
- $39,772
Cash invested: $128,800 (down + closing). Projections, not guarantees.
Landlord ↔ Tenant lean methodology
- Overall (STATE)
- 73 Landlord-Friendly
- State Ohio
- 73 Landlord-Friendly · R+6
- County
- — inherits STATE
- City
- — inherits STATE
ZIP-level market 44140
- Active inventory
- 73
- Price-to-rent
- 9.3×
Monthly cashflow live
- Estimated rent
- $4,100 medium interval (Pro) →
- Mortgage (P&I)
- −$2,412
- Tax from tax record
- −$773 /mo · $9,280/yr
- Insurance
- −$192
- HOA
- −$0
- Vacancy / Maint / Mgmt
- −$861
- Net cashflow
- $-138
Break-even live
Sensitivity live
| Price | -10% $122 | -5% $-8 | +0% $-138 | +5% $-268 | +10% $-399 |
|---|---|---|---|---|---|
| Rent | -10% $-462 | -5% $-300 | +0% $-138 | +5% $24 | +10% $186 |
| Rate | -1.0pp $93 | -0.5pp $-21 | base $-138 | +0.5pp $-257 | +1.0pp $-379 |
UW: 25.0% down · 7.5% · 30yr · 1.5% tax · 5.0% vac · 8.0% maint · 8.0% mgmt
Financing live
Cash to close
- Down payment
- $115,000
- Closing costs
- $13,800
- Reserves months
- —
- Total cash needed
- —
Loan-product check · same deal, 3 products live
Conventional
25% down · 7.5% · 30yr
- Down + closing
- —
- Monthly P&I
- —
- Monthly cashflow
- —
- DSCR
- —
- Eligible?
- —
Personal DTI + credit; lowest rate.
DSCR
20% down · 8.5% · 30yr
- Down + closing
- —
- Monthly P&I
- —
- Monthly cashflow
- —
- DSCR
- —
- Eligible?
- —
No personal income docs; deal must DSCR.
Hard money
10% down · 12.0% · 12mo
- Down + closing
- —
- Monthly P&I
- —
- Monthly cashflow
- —
- DSCR
- —
- Eligible?
- —
Short-term bridge; refi at stabilization.
Rent comps 2 comps
| Address | Beds | Baths | Sqft | Rent | $/sqft | DOM | Units | Dist |
|---|---|---|---|---|---|---|---|---|
| 384 Bradley Rd Bay Village, OH | 3.0 | 2.5 | 2000 | $4,100 | $2.05 | 9d | 1 | 0.48mi |
| 384 Bradley Rd Bay Village, OH | 3.0 | 3.0 | 2000 | $4,100 | $2.05 | 5d | 1 | 0.48mi |
Listing history 17 events
-
2026-03-16historical
-
2026-03-16$460,000
-
2000-06-14soldstatus $186,500 334-char remark
Show marketing remark (334 chars)
A Lot Of House In A Great Location * Large Lot W/ Private Setti Ng * Newer Crpt In Liv Rm & Din Rm * Newer Kitch W/ All Appl Stay H2o New 2/00 * Wbfp In Fam Rm * Enclosed 3 Season Sunroom * Den On Lower Level Could Be Bdrm * Washer & Dryer Stay * 12x11 Sitting Rm Off Master * 24 Hr Notice For Showing * Swingset No Stay *
-
2000-06-07soldstatus $185,600
-
2000-03-02historical
-
2000-03-01$189,900 334-char remark
Show marketing remark (334 chars)
A Lot Of House In A Great Location * Large Lot W/ Private Setti Ng * Newer Crpt In Liv Rm & Din Rm * Newer Kitch W/ All Appl Stay H2o New 2/00 * Wbfp In Fam Rm * Enclosed 3 Season Sunroom * Den On Lower Level Could Be Bdrm * Washer & Dryer Stay * 12x11 Sitting Rm Off Master * 24 Hr Notice For Showing * Swingset No Stay *
-
1999-10-29$199,900
-
1999-10-29historical
-
1999-07-16$209,900
-
1998-12-06soldstatus $182,000
-
1998-12-03soldstatus $182,000
-
1998-08-08$194,900
-
1995-03-10soldstatus $165,000
-
1995-03-03soldstatus $165,000
-
1995-01-07$164,900
-
1986-08-26soldstatus $116,500
-
1981-02-04soldstatus $93,000
ⓘ Source: listings_history table (triggers on properties + properties_extension) + one-shot
backfill from property_details.listing_events for pre-trigger history.
Tax reassessment forecast OH · Partial reset (capped growth)
- Current annual tax
- $9,280 · $773/mo
- Projected year-2 tax
- $9,280 · $773/mo
- Expected delta
- $0/yr ($0/mo · 0.0%)
ⓘ Screening estimate from a state-policy table — verify with the county assessor before closing.
Climate risk First Street
- Flood 1/10 Low FEMA zone X (unshaded) · 0% chance over 30 yrs
- Wildfire 1/10 Low
- Heat 3/10 Moderate 7 d/yr ≥96°F today · 18 d/yr by 30 yrs out
- Wind 1/10 Low
- Air quality 2/10 Low 2 unhealthy d/yr today · 2 by 30 yrs out
Nearby sold comps map
Loading sold comps map…
Walkable amenities ~0.75 mi
Loading nearby amenities…
Taxation est. · year 1
- Rental income
- $49,200
- − Mortgage interest
- −$25,767
- − Property taxes
- −$9,280
- − Insurance
- −$2,300
- − Repairs & maintenance
- −$3,936
- − Management
- −$3,936
- − Depreciation
- −$13,382
- Taxable loss
- −$9,401
- Est. tax savings @ 24.0%
- +$2,256
- After-tax cash flow
- $597/yr
For passive investors: Depreciation is non-cash, so a rental often shows a tax loss while cash-flowing — sheltering income. Rental losses are passive: they offset passive income freely, and up to $25,000/yr can offset ordinary (W-2) income if you actively participate and your MAGI is under $100k (phasing out to $0 by $150k); unused losses carry forward. On sale, claimed depreciation is recaptured at up to 25%, and gains may owe capital-gains tax (a 1031 exchange can defer both). Figures are a year-1 estimate at your 24.0% rate — not tax advice; consult a CPA.
Schools (NCES district)
- District
- Bay Village City
- NCES district ID
- 3904354
- Math proficiency
- 85% ▼ -7.00%
- Reading proficiency
- 87% ▼ -4.00%
- Median HH income
- $86,285
- Composite
- 76.1/100
- National rank
- #118
- State rank
- #15 of 656 in OH
Livability — Bay Village
- Score
- 82/100
- State rank
- #83
- US rank
- #1228
Category grades
Schools grade is shown separately in the Schools card above.
Census & demographics
- Census place
- Bay Village, OH
- County
- Cuyahoga · 1,045,444 people
- City population
- 15,992
- Metro
- Cleveland, OH
- Population (ZIP)
- 15,992
- Household income
- $122,083
- Rent vs Own
- Severe rent burden
- 11.4
Population outlook (Cuyahoga County) Hauer SSP2
- Today (2025)
- 1,244,621 people
- By 2030
- 1,230,093 · -1.2%
- By 2040
- 1,189,108 · -4.5%
- By 2050
- 1,145,706 · -7.9%
- By 2075
- 1,076,557 · -13.5%
- By 2100
- 978,987 · -21.3%
Race, ethnicity, and origin ACS 2023
- Neighborhood character
- Predominantly White (92%)
- Race & ethnicity
- White 92% Two or more races 4% Hispanic / Latino 3%
- Common ancestry
- Romanian 8% Slovak 4% Italian 2%
- Foreign-born
- 4% · Canada
- Languages at home
- 96% English-only · Spanish 1% Russian/Polish/Slavic 1% French/Haitian/Cajun 1%
Political lean MEDSL · Cuyahoga
- 2024 margin
- Solid D (+31.5) · D 65.4% · R 33.9%
- 2008→2024 swing
- -7.4pp toward R · 2008: 38.9pp · 2024: 31.5pp
- All cycles
- 2024: D+31.5 2020: D+34.1 2016: D+35.0 2012: D+38.7 2008: D+38.9
Not yet ingested
- Civics
- —
Market trends
- HPI YoY
- ▼ -282.00%
- Current HPI
- 239.933
- Rent YoY
- —
- Metro
- —
- State GDP YoY
- ▲ 1.98%
- F500 in state
- 48
Industry mix (Fortune 500 HQ in OH)
| Industry | F500 HQs | Revenue |
|---|---|---|
| Insurance | 3 | $145B |
|
||
| Industrial Machinery | 3 | $49B |
|
||
| Financial Services | 3 | $24B |
|
||
| Consumer Goods | 2 | $93B |
|
||
| Aerospace / Defense | 2 | $47B |
|
||
| Utilities | 2 | $33B |
|
||
Price history
+394.6% since first listed17 events — show timeline
- 2026-03-16 Listed $460,000 MLSNOW
- 2026-03-16 Listing Removed — MLSNOW
- 2000-06-14 Sold (MLS) $186,500 MLSNOW
- 2000-06-07 Sold (Public Records) $185,600 Public Records
- 2000-03-02 Listing Removed — MLSNOW
- 2000-03-01 Listed $189,900 MLSNOW
- 1999-10-29 Listing Removed — MLSNOW
- 1999-10-29 Listed $199,900 MLSNOW
- 1999-07-16 Listed $209,900 MLSNOW
- 1998-12-06 Sold (MLS) $182,000 MLSNOW
- 1998-12-03 Sold (Public Records) $182,000 Public Records
- 1998-08-08 Listed $194,900 MLSNOW
- 1995-03-10 Sold (MLS) $165,000 MLSNOW
- 1995-03-03 Sold (Public Records) $165,000 Public Records
- 1995-01-07 Listed $164,900 MLSNOW
- 1986-08-26 Sold (Public Records) $116,500 Public Records
- 1981-02-04 Sold (Public Records) $93,000 Public Records
Property tax history
+4.3%/yrLatest (2025): $9,280 · +0.3% YoY. Source: county tax records.
Cash-flow waterfall
monthlySold comps — $/sqft
last 12 mo · ≤1 miLoading sold comps…