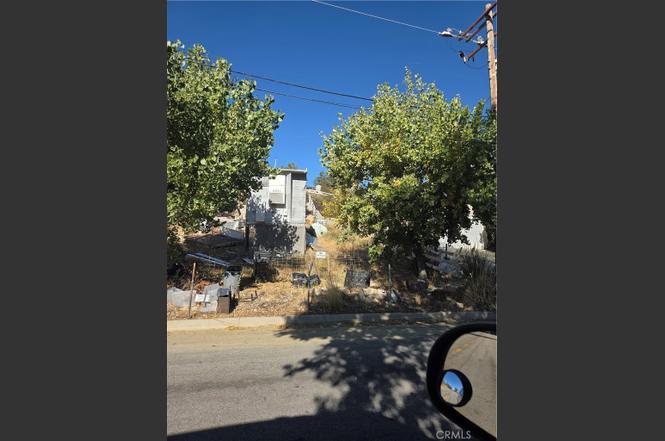
42530 Ranch Clb · Elizabeth Lake, CA
Flood risk 1/10 · Minimal
- FEMA flood zone
- X (unshaded)
- Chance of flooding over 30 yrs
- 0.0%
- Est. flood insurance / yr
- $507 – $1,088
Fire risk 10/10 · Severe
- Est. fire insurance / yr
- $659 – $1,223
Heat risk 5/10 · Moderate
- Hot days now (above 94°F)
- 7 days/yr
- Hot days in 30 yrs
- 18 days/yr
Wind risk 1/10 · Minimal
- Chance of severe wind over 30 yrs
- —
Air-quality risk 9/10 · Severe
- Unhealthy air days now
- 20 days/yr
- Unhealthy air days in 30 yrs
- 25 days/yr
Risk factors via First Street. Map © Google.
Why this score? — see what drove the C+ grade
The composite is a weighted blend of 9 inputs, each scored 0–100. Each bar is that input's sub-score; the figure is the points it added to the 100-point composite (weight × sub-score).
- Cash flow +26.3/30.0
- DSCR +8.9/10.0
- ARV discount +7.5/15.0
- 1% rule +7.0/10.0
- Schools +4.2/10.0
- Livability +2.8/5.0
- Rent growth +2.5/5.0
- Condition / age +2.5/5.0
- Appreciation +0.0/10.0
$99,990
🖨 Deal sheet 📄 Offer letter ✓ Due diligence
Listing remarks
Charming Studio Retreat with Mountain Views Near Lake Elizabeth – A Diamond in the Rough! Discover the potential in this peaceful Lake Elizabeth getaway! This cozy studio property offers stunning mountain views and a tranquil setting surrounded by open landscapes, ranches, and wide California skies. Just minutes from beautiful Lake Elizabeth, this home is perfect for those seeking serenity, outdoor recreation, or a rustic escape from the city. While the property needs some finishing touches, it’s a true diamond in the rough ready for a visionary buyer to make it shine. Imagine crafting your ideal retreat, artist’s studio, or weekend hideaway in this picturesque high desert
Key facts
- Outdoor recreation
- Mountain views
- 7,537 sq ft lot
Tags
Property features AI
Finance
- HOA & community: Neighborhood offers biking, hiking, foothills and valley access
Exterior
- Utilities: Electricity available; Water available; Septic (type unknown)
- Home design: Cabin; Single-story; No accessory dwelling unit; Residential zoning
- Construction: Year built source: seller
- Exterior features: No pool; Lot roughly 0–1 unit per acre; Lot dimensions listed from assessor
Interior
- Bedrooms: 1 bedroom on the main level
- Bathrooms: 1 full bathroom on the main level
- Heating & cooling: Electric cooling
- Interior features: One-level cabin; Side/front entry; All bedrooms on main level; Has a view
- Laundry & utility: Laundry located outside
Neighborhood map
What this means for you Summary
Snapshot
- This is a 1-bed/1.0-bath single-family listed at $100k.
Deal economics
- At list price, monthly cash flow is $258 ($3k/yr) — positive.
- The deal already cash-flows at list — no discount required.
- Meets the 1% rule at list price ($1k rent vs $100k).
- Recommended offer: $88k (12.0% below list) — sets the bar for market timing.
Location & tenants
- Location reads 56/100 on livability (#801 in CA) — a working-class tenant base; expect higher turnover. Strengths: housing A+, crime A, employment A; Watch: schools F, amenities F, commute F.
- Hughes-Elizabeth Lakes Union Elementary (rural): math 35% / reading 55% proficiency, ranked #527 of 1,400 in CA (top 38%) — families likely to look elsewhere, expect single-tenant / working-renter base with shorter leases.
- Market conditions: 93 active listings in the ZIP; 19,697 units permitted in Los Angeles County in 2024 (9,426 in 5+ unit buildings).
Forward outlook
- Local home prices are declining (-3.0%/yr); year-one equity from $692 of loan paydown is wiped out by about $3k of value loss. Plan a longer hold.
- Los Angeles County population projected at +9% by 2050 — modest demand growth; plan on rents tracking national, not racing it.
- At projected returns (-3.0% appreciation + 3.0% rent growth), your $28k cash investment doubles in ~10 years — after that, you're playing with house money.
Negotiation context
- It's been on market 221 days — a 12% lower offer ($88k) is reasonable based on typical stale-listing flexibility.
Risks & watch-outs
- Climate carrying-cost: severe wildfire risk; extreme-heat days projected 7→18/yr by 2055 (HVAC capex compounding) — expect insurance premiums to compound above CPI over the hold.
Questions for the listing agent
- It's been on market 221 days. Have you received any prior offers? Is the seller open to a 12% concession, seller financing, or rate buy-down credit?
- Why hasn't it sold? Are there any deal-killer items the seller is aware of (foundation, flood, title, zoning, code violations)?
- Is there a deadline driving the sale (1031 exchange, divorce, estate, relocation)? That informs how much negotiation room exists.
- Schools are F-rated, which usually means shorter tenancies and higher turnover. Who's the typical renter profile here, and what's been the actual vacancy rate?
- What's the average days-on-market for RENTAL listings here right now (not sales)? A rising rental-DOM trend means longer vacancies and softer asking-rent achievability than the comps imply.
- What's the recent tenant-quality profile in this submarket — average credit score on applications, eviction rate, late-payment / NSF rate, and stable-employment percentage? A property-management company in the area should have these aggregated.
- How much new for-sale + rental construction is in the pipeline within 1–3 miles? Heavy new supply typically softens prices + rents 12–24 months out; constrained supply supports both.
Investment metrics
- 1% rule
- 1.20% ✓
- Cap rate
- 9.38%
- Cash-on-cash
- 11.04%
- DSCR
- 1.49
- GRM
- 6.9
CMA / ARV
No comps found within radius.
Projected returns pro-forma
-3.0% appreciation · 3.0% rent growth · sell at horizon
- IRR
- 0.2%
- Equity multiple
- 1.01×
- Total profit
- $224
- Equity at exit
- $14,909
- IRR
- 9.9%
- Equity multiple
- 1.76×
- Total profit
- $21,398
- Equity at exit
- $8,645
Cash invested: $27,997 (down + closing). Projections, not guarantees.
Landlord ↔ Tenant lean methodology
- Overall (STATE)
- 18 Strongly Tenant-Friendly
- State California
- 18 Strongly Tenant-Friendly · D+13
- County
- — inherits STATE
- City
- — inherits STATE
ZIP-level market 93532
- Home prices YoY
- -10.3%
- Active inventory
- 93
- Price-to-rent
- 6.9×
Monthly cashflow live
- Estimated rent
- $1,201 medium interval (Pro) →
- Mortgage (P&I)
- −$524
- Tax est. 1.5%
- −$125 /mo · $1,500/yr
- Insurance
- −$42
- HOA
- −$0
- Vacancy / Maint / Mgmt
- −$252
- Net cashflow
- $258
Break-even live
UW: 25.0% down · 7.5% · 30yr · 1.5% tax · 5.0% vac · 8.0% maint · 8.0% mgmt
Financing live
Cash to close
- Down payment
- $24,998
- Closing costs
- $3,000
- Reserves months
- —
- Total cash needed
- —
Loan-product check · same deal, 3 products live
Conventional
25% down · 7.5% · 30yr
- Down + closing
- —
- Monthly P&I
- —
- Monthly cashflow
- —
- DSCR
- —
- Eligible?
- —
Personal DTI + credit; lowest rate.
DSCR
20% down · 8.5% · 30yr
- Down + closing
- —
- Monthly P&I
- —
- Monthly cashflow
- —
- DSCR
- —
- Eligible?
- —
No personal income docs; deal must DSCR.
Hard money
10% down · 12.0% · 12mo
- Down + closing
- —
- Monthly P&I
- —
- Monthly cashflow
- —
- DSCR
- —
- Eligible?
- —
Short-term bridge; refi at stabilization.
Listing history 16 events
-
2026-06-18days on market $99,990 Active 221 DOM
-
2026-06-17days on market $99,990 Active 220 DOM
-
2026-06-16days on market $99,990 Active 219 DOM
-
2026-06-15days on market $99,990 Active 218 DOM
-
2026-06-13days on market $99,990 Active 216 DOM
-
2026-06-13days on market $99,990 Active 215 DOM
-
2026-06-10days on market $99,990 Active 213 DOM
-
2026-06-09days on market $99,990 Active 212 DOM
-
2026-06-08days on market $99,990 Active 211 DOM
-
2026-06-07days on market $99,990 Active 210 DOM
-
2026-06-04days on market $99,990 Active 207 DOM
-
2026-06-03days on market $99,990 Active 206 DOM
-
2026-06-02days on market $99,990 Active 205 DOM
-
2026-06-01days on market $99,990 Active 204 DOM
-
2026-05-31days on market $99,990 Active 203 DOM
-
2025-11-09$99,990 Active
ⓘ Source: listings_history table (triggers on properties + properties_extension) + one-shot
backfill from property_details.listing_events for pre-trigger history.
Climate risk First Street
- Flood 1/10 Low FEMA zone X (unshaded) · 0% chance over 30 yrs
- Wildfire 10/10 Extreme
- Heat 5/10 Major 7 d/yr ≥94°F today · 18 d/yr by 30 yrs out
- Wind 1/10 Low
- Air quality 9/10 Extreme 20 unhealthy d/yr today · 25 by 30 yrs out
Nearby sold comps map
Loading sold comps map…
Walkable amenities ~0.75 mi
Loading nearby amenities…
Taxation est. · year 1
- Rental income
- $14,410
- − Mortgage interest
- −$5,601
- − Property taxes
- −$1,500
- − Insurance
- −$500
- − Repairs & maintenance
- −$1,153
- − Management
- −$1,153
- − Depreciation
- −$2,909
- Taxable income
- $1,595
- Est. tax owed @ 24.0%
- −$383
- After-tax cash flow
- $2,709/yr
For passive investors: Depreciation is non-cash, so a rental often shows a tax loss while cash-flowing — sheltering income. Rental losses are passive: they offset passive income freely, and up to $25,000/yr can offset ordinary (W-2) income if you actively participate and your MAGI is under $100k (phasing out to $0 by $150k); unused losses carry forward. On sale, claimed depreciation is recaptured at up to 25%, and gains may owe capital-gains tax (a 1031 exchange can defer both). Figures are a year-1 estimate at your 24.0% rate — not tax advice; consult a CPA.
Schools (NCES district)
- District
- Hughes-Elizabeth Lakes Union Elementary
- NCES district ID
- 0617880
- Math proficiency
- 35% ▼ -5.00%
- Reading proficiency
- 55% ▲ 5.00%
- Median HH income
- $66,004
- Composite
- 42.35/100
- National rank
- #6938
- State rank
- #527 of 1400 in CA
Livability — Elizabeth Lake
- Score
- 56/100
- State rank
- #801
- US rank
- #22786
Category grades
Schools grade is shown separately in the Schools card above.
Census & demographics
- Census place
- Elizabeth Lake, CA
- Population (ZIP)
- 2,762
Population outlook (Los Angeles County) Hauer SSP2
- Today (2025)
- 10,940,515 people
- By 2030
- 11,256,481 · +2.9%
- By 2040
- 11,729,929 · +7.2%
- By 2050
- 11,948,407 · +9.2%
- By 2075
- 11,818,114 · +8.0%
- By 2100
- 10,842,928 · -0.9%
Race, ethnicity, and origin ACS 2023
- Neighborhood character
- Predominantly White (73%)
- Race & ethnicity
- White 73% Hispanic / Latino 20% Two or more races 11% Asian 2% Black 2% Native American 2%
- Hispanic origin (detail)
- Mexican 12%
- Common ancestry
- Scotch-Irish 8% Russian 2% Subsaharan African 2%
- Foreign-born
- 16% · Canada
- Languages at home
- 75% English-only · Spanish 14% Russian/Polish/Slavic 7% Other Indo-European 4%
Political lean MEDSL · Los Angeles
- 2024 margin
- Solid D (+32.9) · D 64.8% · R 31.9% · Other 3.3%
- 2008→2024 swing
- -7.4pp toward R · 2008: 40.4pp · 2024: 32.9pp
- All cycles
- 2024: D+32.9 2020: D+44.2 2016: D+48.0 2012: D+40.0 2008: D+40.4
Not yet ingested
- Civics
- —
Market trends
- HPI YoY
- ▼ -43.43%
- Current HPI
- 377.74
- Rent YoY
- —
- Metro
- —
- State GDP YoY
- ▲ 3.21%
- F500 in state
- 116
Industry mix (Fortune 500 HQ in CA)
| Industry | F500 HQs | Revenue |
|---|---|---|
| Technology | 27 | $1,492B |
|
||
| Financial Services | 3 | $174B |
|
||
| Retail | 3 | $44B |
|
||
| Insurance | 3 | $26B |
|
||
| Media / Entertainment | 2 | $115B |
|
||
| Pharmaceuticals / Biotech | 2 | $62B |
|
||
Price history
1 event — show timeline
- 2025-11-09 Listed $99,990 CRMLS
Cash-flow waterfall
monthlySold comps — $/sqft
last 12 mo · ≤1 miLoading sold comps…