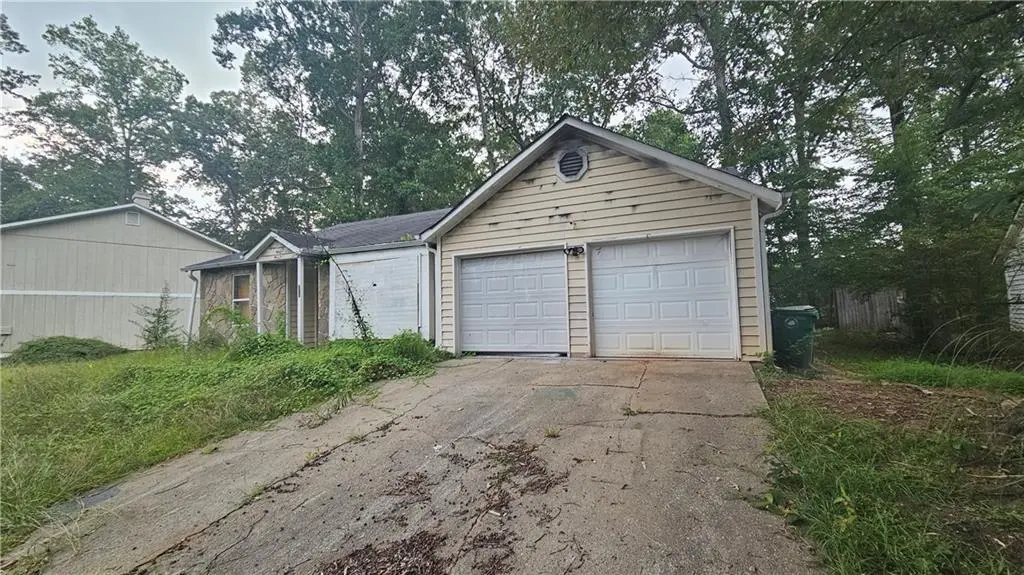
854 Greenhedge Dr · Redan, GA
Flood risk 1/10 · Minimal
- FEMA flood zone
- X (unshaded)
- Chance of flooding over 30 yrs
- 0.0%
- Est. flood insurance / yr
- $507 – $1,088
Fire risk 1/10 · Minimal
- Est. fire insurance / yr
- $963 – $1,789
Heat risk 5/10 · Moderate
- Hot days now (above 104°F)
- 7 days/yr
- Hot days in 30 yrs
- 17 days/yr
Wind risk 5/10 · Moderate
- Chance of severe wind over 30 yrs
- 26.0%
Air-quality risk 6/10 · Moderate
- Unhealthy air days now
- 8 days/yr
- Unhealthy air days in 30 yrs
- 11 days/yr
Risk factors via First Street. Map © Google.
Why this score? — see what drove the B- grade
The composite is a weighted blend of 9 inputs, each scored 0–100. Each bar is that input's sub-score; the figure is the points it added to the 100-point composite (weight × sub-score).
- Cash flow +30.0/30.0
- 1% rule +10.0/10.0
- DSCR +10.0/10.0
- ARV discount +7.5/15.0
- Rent growth +3.4/5.0
- Livability +3.2/5.0
- Condition / age +2.5/5.0
- Schools +2.1/10.0
- Appreciation +0.0/10.0
$116,999
🖨 Deal sheet 📄 Offer letter ✓ Due diligence
Listing remarks MLS
INVESTOR OPPORTUNITY! Property sold AS-IS. Home has fire damage and is ideal for investors or renovators seeking a value-add project. Interior cleanout has been completed, allowing for immediate renovation. Strong potential for fix & flip or long-term rental. No Seller's Disclosure available. Buyer to verify all information. Don't miss this opportunity!!
Key facts
- 0.28 acre lot
- 2 garage spots
- Built 1983
Neighborhood map
What this means for you Summary
Snapshot
- This is a 3-bed/2.0-bath single-family listed at $117k.
Deal economics
- At list price, monthly cash flow is $500 ($6k/yr) — positive.
- The deal already cash-flows at list — no discount required.
- Meets the 1% rule at list price ($2k rent vs $117k).
- Recommended offer: $103k (12.0% below list) — sets the bar for market timing.
- Cap rate 11.4% vs local median 5.4% in Redan — top-decile yield for the area; either an underpriced asset or a hidden risk that comps aren't pricing in. Stress-test before assuming the spread holds.
Location & tenants
- Location reads 64/100 on livability (#274 in GA) — a middle-class / working-renter tenant base. Strengths: cost of living A+, housing A+; Watch: crime D, amenities F, commute F.
- Dekalb County (suburban): math 19% / reading 28% proficiency, ranked #125 of 174 in GA (top 72%) — low school quality limits family demand, transient renter base, plan for 1-2y turnover; 68% free/reduced lunch — lower-income household profile, screen leases tightly.
- Market conditions: Rents rising (+3.7%/yr); 215 active listings in the ZIP; 39 comparable units currently listed for rent nearby; rentals at typical pace (median 20d on market — plan ~3-4 weeks tenant-placement turnaround); 1,240 units permitted in DeKalb County in 2024 (385 in 5+ unit buildings).
- This rent runs 33% of the median local income ($70k/yr) — at the standard rent-burdened threshold; future hikes will face affordability resistance.
Forward outlook
- Local home prices are declining (-3.0%/yr); year-one equity from $809 of loan paydown is wiped out by about $4k of value loss. Plan a longer hold.
- DeKalb County population projected at +28% by 2050 — long-run rental-demand tailwind backs the buy-and-hold thesis.
- At projected returns (-3.0% appreciation + 3.7% rent growth), your $33k cash investment doubles in ~7 years — after that, you're playing with house money.
Negotiation context
- It's been on market 133 days — a 12% lower offer ($103k) is reasonable based on typical stale-listing flexibility.
- 8 sale attempts since 15y ago with the ask held roughly flat each time — persistent listings suggest the price (not the market) is what's stuck; bring a comps-based counter.
- Current owner paid $99k; 18% above their basis — modest negotiation headroom, anchor on the comps not their cost.
Risks & watch-outs
- Watch-outs: property tax is 3.7% of price.
- Climate carrying-cost: moderate wind risk, 26% chance of damaging wind over 30y; extreme-heat days projected 7→17/yr by 2055 (HVAC capex compounding) — expect insurance premiums to compound above CPI over the hold.
Questions for the listing agent
- It's been on market 133 days. Have you received any prior offers? Is the seller open to a 12% concession, seller financing, or rate buy-down credit?
- Property tax is high relative to price — has the assessment been appealed recently, and will the sale trigger a re-assessment?
- Why hasn't it sold? Are there any deal-killer items the seller is aware of (foundation, flood, title, zoning, code violations)?
- Is there a deadline driving the sale (1031 exchange, divorce, estate, relocation)? That informs how much negotiation room exists.
- Schools are B-rated — typically a magnet for longer-tenancy family renters. What's the average tenant stay here, and is there a school-zone premium baked into asking?
- Crime grade is D in this area — have there been break-ins, vandalism, or insurance claims at this property in the last 3 years? What carrier currently insures it and at what premium?
- What's the average days-on-market for RENTAL listings here right now (not sales)? A rising rental-DOM trend means longer vacancies and softer asking-rent achievability than the comps imply.
- What's the recent tenant-quality profile in this submarket — average credit score on applications, eviction rate, late-payment / NSF rate, and stable-employment percentage? A property-management company in the area should have these aggregated.
- How much new for-sale + rental construction is in the pipeline within 1–3 miles? Heavy new supply typically softens prices + rents 12–24 months out; constrained supply supports both.
Investment metrics
- 1% rule
- 1.64% ✓
- Cap rate
- 11.42%
- Cash-on-cash
- 18.31%
- DSCR
- 1.81
- GRM
- 5.1
CMA / ARV
- ARV (median comp)
- $240,748
- List price
- $116,999
- Delta
- -51.40%
- Verdict
- UNDERPRICED
- Comps
- 20 within 1.0 mi
Show comp detail 12 sales within ~0.75 mi
| Address | Dist | Beds/Ba | Sqft | Sold | Price | $/sf | Match |
|---|---|---|---|---|---|---|---|
| 868 Greenhedge Dr | 0.05mi | 3/2.0 | 1,324 (-8%) | 2mo | $170,000 | $128 | 84 |
| 870 Chapman Cir | 0.46mi | 3/2.0 | 1,432 (-0%) | 2mo | $185,000 | $129 | 77 |
| 5208 Mainstreet Park Dr | 0.40mi | 3/2.0 | 1,482 (+3%) | 2mo | $200,000 | $135 | 74 |
| 783 Fox Valley Dr | 0.31mi | 3/2.5 | 1,536 (+7%) | 4mo | $167,500 | $109 | 68 |
| 884 Forest Path | 0.17mi | 3/2.0 | 1,632 (+14%) | 0mo | $225,000 | $138 | 68 |
| 5233 Mccarter Sta | 0.40mi | 3/2.0 | 1,528 (+7%) | 2mo | $220,000 | $144 | 68 |
| 5224 Mccarter Sta | 0.41mi | 3/2.0 | 1,308 (-9%) | 1mo | $220,400 | $169 | 66 |
| 5486 Fox Valley Ln | 0.44mi | 3/3.0 | 1,536 (+7%) | 3mo | $140,000 | $91 | 61 |
| 5471 Fox Valley Ln | 0.45mi | 3/2.0 | 1,265 (-12%) | 2mo | $225,000 | $178 | 58 |
| 5242 Mccarter Sta | 0.37mi | 4/3.0 (+1) | 1,640 (+14%) | 3mo | $277,000 | $169 | 47 |
| 1017 Forest West Ct | 0.49mi | 4/2.0 (+1) | 1,626 (+14%) | 4mo | $198,400 | $122 | 46 |
| 629 Waterview Ct | 0.75mi | 4/2.5 (+1) | 1,542 (+8%) | 2mo | $229,000 | $149 | 44 |
Match score weights: distance 35% · size 25% · config 20% · recency 20%. Top-matched comps best support the ARV.
Projected returns pro-forma
-3.0% appreciation · 3.72% rent growth · sell at horizon
- IRR
- 11.0%
- Equity multiple
- 1.44×
- Total profit
- $14,445
- Equity at exit
- $17,445
- IRR
- 20.8%
- Equity multiple
- 2.83×
- Total profit
- $60,063
- Equity at exit
- $10,116
Cash invested: $32,760 (down + closing). Projections, not guarantees.
Landlord ↔ Tenant lean methodology
- Overall (STATE)
- 90 Strongly Landlord-Friendly
- State Georgia
- 90 Strongly Landlord-Friendly · R+3
- County
- — inherits STATE
- City
- — inherits STATE
ZIP-level market 30088
- Rents YoY
- 3.7%
- Active inventory
- 215
- Price-to-rent
- 5.1×
Monthly cashflow live
- Estimated rent
- $1,922 high interval (Pro) →
- Mortgage (P&I)
- −$614
- Tax from tax record
- −$356 /mo · $4,273/yr
- Insurance
- −$49
- HOA
- −$0
- Vacancy / Maint / Mgmt
- −$404
- Net cashflow
- $500
Break-even live
UW: 25.0% down · 7.5% · 30yr · 1.5% tax · 5.0% vac · 8.0% maint · 8.0% mgmt
Financing live
Cash to close
- Down payment
- $29,250
- Closing costs
- $3,510
- Reserves months
- —
- Total cash needed
- —
Loan-product check · same deal, 3 products live
Conventional
25% down · 7.5% · 30yr
- Down + closing
- —
- Monthly P&I
- —
- Monthly cashflow
- —
- DSCR
- —
- Eligible?
- —
Personal DTI + credit; lowest rate.
DSCR
20% down · 8.5% · 30yr
- Down + closing
- —
- Monthly P&I
- —
- Monthly cashflow
- —
- DSCR
- —
- Eligible?
- —
No personal income docs; deal must DSCR.
Hard money
10% down · 12.0% · 12mo
- Down + closing
- —
- Monthly P&I
- —
- Monthly cashflow
- —
- DSCR
- —
- Eligible?
- —
Short-term bridge; refi at stabilization.
Rent comps 39 comps
| Address | Beds | Baths | Sqft | Rent | $/sqft | DOM | Units | Dist |
|---|---|---|---|---|---|---|---|---|
| 811 King Rd Stone Mountain, GA | 3.0 | 3.0 | 1840 | $3,300 | $1.79 | 43d | 1 | 0.32mi |
| 982 Chapman Cir Stone Mountain, GA | 3.0 | 2.0 | 1476 | $2,000 | $1.36 | 1d | 1 | 0.38mi |
| 5486 Fox Valley Ln Stone Mountain, GA | 3.0 | 2.5 | 1536 | $1,850 | $1.20 | 19d | 1 | 0.41mi |
| 1078 Forest Path Stone Mountain, GA | 4.0 | 2.5 | 1554 | $1,845 | $1.19 | 43d | 1 | 0.55mi |
| 5482 Martins Crossing Rd Stone Mountain, GA | 3.0 | 2.0 | 1482 | $1,575 | $1.06 | 12d | 1 | 0.60mi |
| 1076 Martin Rd Stone Mountain, GA | 4.0 | 2.0 | 1760 | $2,011 | $1.14 | 16d | 1 | 0.73mi |
| 5386 Kristian Ct Stone Mountain, GA | 4.0 | 2.0 | 1531 | $1,901 | $1.24 | 24d | 1 | 0.76mi |
| 5349 Tracey Dr Stone Mountain, GA | 3.0 | 2.0 | 1188 | $1,975 | $1.66 | 43d | 1 | 0.77mi |
| 5349 Tracey Dr Stone Mountain, GA | 3.0 | 2.0 | 1188 | $1,975 | $1.66 | 16d | 1 | 0.77mi |
| 905 Hemingway Rd Stone Mountain, GA | 3.0 | 2.0 | 1400 | $1,625 | $1.16 | 12d | 1 | 0.84mi |
| 5035 Martins Crossing Rd Stone Mountain, GA | 3.0 | 2.0 | 1288 | $1,450 | $1.13 | 3d | 1 | 0.91mi |
| 5702 Wells Cir Stone Mountain, GA | 2.0 | 2.5 | 1160 | $1,495 | $1.29 | 43d | 1 | 0.98mi |
| 5713 Wells Cir Stone Mountain, GA | 3.0 | 2.5 | 1304 | $1,706 | $1.31 | 5d | 1 | 0.99mi |
| 5707 Wells Cir Stone Mountain, GA | 2.0 | 2.5 | 1160 | $1,506 | $1.30 | 4d | 1 | 1.00mi |
| 5621 Stonington Trace Pkwy Stone Mountain, GA | 2.0 | 3.5 | 1292 | $1,581 | $1.22 | 15d | 1 | 1.02mi |
| 5734 Lanny Ln Lithonia, GA | 3.0 | 2.0 | 1589 | $1,800 | $1.13 | 24d | 1 | 1.06mi |
| 4899 Hairston Pl Stone Mountain, GA | 3.0 | 2.5 | 1468 | $1,981 | $1.35 | 12d | 1 | 1.16mi |
| 869 Heritage Oaks Dr Stone Mountain, GA | 3.0 | 2.5 | 1400 | $1,289 | $0.92 | 5d | 1 | 1.17mi |
| 1467 Muirfield Dr Stone Mountain, GA | 3.0 | 2.0 | 1630 | $1,870 | $1.15 | 21d | 1 | 1.17mi |
| 469 Sherwood Grn Stone Mountain, GA | 3.0 | 2.0 | 1792 | $1,810 | $1.01 | 10d | 1 | 1.17mi |
| 1228 Mill Lake Cir Stone Mountain, GA | 3.0 | 2.0 | 1344 | $1,645 | $1.22 | 43d | 1 | 1.19mi |
| 924 Lake Drive Ter Stone Mountain, GA | 3.0 | 2.0 | 1380 | $1,670 | $1.21 | 43d | 1 | 1.20mi |
| 1401 Mill Lake Cir Stone Mountain, GA | 3.0 | 2.0 | 1320 | $1,675 | $1.27 | 12d | 1 | 1.24mi |
| 1373 Mill Lake Cir Stone Mountain, GA | 3.0 | 2.0 | 1296 | $1,773 | $1.37 | 24d | 1 | 1.25mi |
| 1183 Mill Lake Cir Stone Mountain, GA | 3.0 | 2.0 | 1373 | $1,751 | $1.28 | 5d | 1 | 1.25mi |
| 1338 Mill Lake Cir Stone Mountain, GA | 3.0 | 2.0 | 1844 | $1,900 | $1.03 | 1d | 1 | 1.26mi |
| 867 Oakhill Ct Stone Mountain, GA | 3.0 | 2.5 | 1556 | $1,850 | $1.19 | 43d | 1 | 1.32mi |
| 5799 Redan Rd Stone Mountain, GA | 3.0 | 2.0 | 1546 | $1,490 | $0.96 | 24d | 1 | 1.32mi |
| 4935 Millstone Walk Stone Mountain, GA | 3.0 | 2.5 | 1248 | $1,950 | $1.56 | 5d | 1 | 1.33mi |
| 643 Navarre Dr Stone Mountain, GA | 3.0 | 2.5 | 1666 | $2,600 | $1.56 | 43d | 1 | 1.35mi |
| 4813 Hairston Pl Stone Mountain, GA | 2.0 | 2.0 | 1204 | $1,400 | $1.16 | 43d | 1 | 1.36mi |
| 5165 Fairforest Dr Stone Mountain, GA | 3.0 | 2.0 | 1344 | $1,695 | $1.26 | 43d | 1 | 1.37mi |
| 1163 Mainstreet Valley Dr Stone Mountain, GA | 3.0 | 2.0 | 1024 | $1,476 | $1.44 | 24d | 1 | 1.38mi |
| 1127 Mainstreet Valley Dr Stone Mountain, GA | 2.0 | 2.0 | 1074 | $1,731 | $1.61 | 21d | 1 | 1.40mi |
| 841 Arbor Ct Stone Mountain, GA | 3.0 | 2.0 | 1448 | $1,845 | $1.27 | 21d | 1 | 1.41mi |
| 5811 Navarre Ct Stone Mountain, GA | 3.0 | 2.0 | 1864 | $1,911 | $1.03 | 2d | 1 | 1.44mi |
| 1038 S Hairston Rd Stone Mountain, GA | 1.0–3.0 | 1.0–2.0 | 912 | $1,285 | $1.41 | 5d | 1 | 1.44mi |
| 5994 Pattillo Ln Lithonia, GA | 3.0 | 2.5 | 1680 | $1,940 | $1.15 | 5d | 1 | 1.45mi |
| 450 Pennybrook Dr Stone Mountain, GA | 3.0 | 2.0 | 1404 | $1,750 | $1.25 | 24d | 1 | 1.46mi |
Listing history 49 events
-
2026-06-18days on market $116,999 Active 133 DOM
-
2026-06-17days on market $116,999 Active 132 DOM
-
2026-06-16days on market $116,999 Active 131 DOM
-
2026-06-15days on market $116,999 Active 130 DOM
-
2026-06-13days on market $116,999 Active 128 DOM
-
2026-06-09days on market $116,999 Active 124 DOM
-
2026-06-08days on market $116,999 Active 123 DOM
-
2026-06-07days on market $116,999 Active 122 DOM
-
2026-06-04days on market $116,999 Active 119 DOM
-
2026-06-03days on market $116,999 Active 118 DOM
-
2026-06-02days on market $116,999 Active 117 DOM
-
2026-06-01days on market $116,999 Active 116 DOM
-
2026-05-31days on market $116,999 Active 115 DOM
-
2026-02-05$116,999 New 360-char remark
Show marketing remark (336 chars)
INVESTOR OPPORTUNITY! Property sold AS-IS. Home has fire damage and is ideal for investors or renovators seeking a value-add project. Interior cleanout has been completed, allowing for immediate renovation. Strong potential for fix & flip or long-term rental. No Seller’s Disclosure available. Buyer to verify all information.
-
2026-02-05$116,999 Active 336-char remark
Show marketing remark (336 chars)
INVESTOR OPPORTUNITY! Property sold AS-IS. Home has fire damage and is ideal for investors or renovators seeking a value-add project. Interior cleanout has been completed, allowing for immediate renovation. Strong potential for fix & flip or long-term rental. No Seller’s Disclosure available. Buyer to verify all information.
-
2025-08-29soldstatus $99,200
-
2025-08-28soldstatus $99,200 Sold
-
2025-08-28soldstatus $99,200 Closed
-
2025-08-20status Pending
-
2025-08-19status Under Contract
-
2025-07-29$114,900 New
-
2025-07-29$114,900 Active
-
2024-05-14soldstatus $75,000
-
2013-05-10price $57,835
-
2013-03-11soldstatus $57,900
-
2013-03-01price $57,835
-
2013-03-01historical
-
2013-02-27soldstatus $57,835 Sold
-
2013-02-27price $63,000
-
2013-02-27soldstatus $57,835 Sold
-
2013-02-23status Pending
-
2013-02-13status Under Contract
-
2013-02-13historical Contingent - Due Diligence
-
2013-02-12price $63,000
-
2013-02-01$63,000 Active
-
2013-02-01$63,000 New
-
2011-11-30historical
-
2011-11-23soldstatus $25,000 Sold
-
2011-11-01status Pending
-
2011-10-28price $28,300 Active
-
2011-10-28status Active
-
2011-10-07status Pending
-
2011-09-01price $29,900
-
2011-08-05$33,900 Active
-
2008-08-08soldstatus $115,000
-
2005-03-10soldstatus $75,500
-
2000-12-26soldstatus $105,500
-
1985-10-07soldstatus $67,950
-
1984-05-31soldstatus $68,000
ⓘ Source: listings_history table (triggers on properties + properties_extension) + one-shot
backfill from property_details.listing_events for pre-trigger history.
Tax reassessment forecast GA · Resets to sale price
- Current annual tax
- $4,273 · $356/mo
- Projected year-2 tax
- $4,273 · $356/mo
- Expected delta
- $0/yr ($0/mo · 0.0%)
ⓘ Screening estimate from a state-policy table — verify with the county assessor before closing.
Climate risk First Street
- Flood 1/10 Low FEMA zone X (unshaded) · 0% chance over 30 yrs
- Wildfire 1/10 Low
- Heat 5/10 Major 7 d/yr ≥104°F today · 17 d/yr by 30 yrs out
- Wind 5/10 Major 26% chance of damaging wind over 30 yrs
- Air quality 6/10 Major 8 unhealthy d/yr today · 11 by 30 yrs out
Nearby sold comps map
Loading sold comps map…
Walkable amenities ~0.75 mi
Loading nearby amenities…
Taxation est. · year 1
- Rental income
- $23,063
- − Mortgage interest
- −$6,554
- − Property taxes
- −$4,273
- − Insurance
- −$585
- − Repairs & maintenance
- −$1,845
- − Management
- −$1,845
- − Depreciation
- −$3,404
- Taxable income
- $4,558
- Est. tax owed @ 24.0%
- −$1,094
- After-tax cash flow
- $4,906/yr
For passive investors: Depreciation is non-cash, so a rental often shows a tax loss while cash-flowing — sheltering income. Rental losses are passive: they offset passive income freely, and up to $25,000/yr can offset ordinary (W-2) income if you actively participate and your MAGI is under $100k (phasing out to $0 by $150k); unused losses carry forward. On sale, claimed depreciation is recaptured at up to 25%, and gains may owe capital-gains tax (a 1031 exchange can defer both). Figures are a year-1 estimate at your 24.0% rate — not tax advice; consult a CPA.
Schools (NCES district)
- District
- Dekalb County
- NCES district ID
- 1301740
- Math proficiency
- 19% ▼ -12.00%
- Reading proficiency
- 28% ▼ -7.00%
- Median HH income
- $51,448
- Composite
- 20.92/100
- National rank
- #8482
- State rank
- #125 of 174 in GA
Livability — Redan
- Score
- 64/100
- State rank
- #274
- US rank
- #14766
Category grades
Schools grade is shown separately in the Schools card above.
Census & demographics
- County
- Dekalb County · 782,738 people
- City population
- 29,279
- Metro
- Atlanta-Sandy Springs-Alpharetta, GA
- Population (ZIP)
- 29,240
- Household income
- $70,325
- Rent vs Own
- Severe rent burden
- 1106.0
Population outlook (DeKalb County) Hauer SSP2
- Today (2025)
- 839,977 people
- By 2030
- 891,768 · +6.2%
- By 2040
- 988,894 · +17.7%
- By 2050
- 1,074,583 · +27.9%
- By 2075
- 1,245,026 · +48.2%
- By 2100
- 1,303,135 · +55.1%
Race, ethnicity, and origin ACS 2023
- Neighborhood character
- Predominantly Black (84%)
- Race & ethnicity
- Black 84% White 5% Hispanic / Latino 5% Two or more races 5%
- Common ancestry
- Swedish 1% Russian 1%
- Foreign-born
- 11% · Canada
- Languages at home
- 90% English-only · Spanish 4% French/Haitian/Cajun 1% Other Indo-European 1%
Political lean MEDSL · DeKalb
- 2024 margin
- Solid D (+64.8) · D 81.9% · R 17.1% · Other 1.0%
- 2008→2024 swing
- +6.1pp toward D · 2008: 58.6pp · 2024: 64.8pp
- All cycles
- 2024: D+64.8 2020: D+67.4 2016: D+64.8 2012: D+56.8 2008: D+58.6
Not yet ingested
- Civics
- —
Market trends
- HPI YoY
- ▼ -169.92%
- Current HPI
- 206.5421
- Rent YoY
- ▲ 3.72%
- Metro
- Atlanta-Sandy Springs-Alpharetta, GA
- State GDP YoY
- ▲ 2.66%
- F500 in state
- 28
Industry mix (Fortune 500 HQ in GA)
| Industry | F500 HQs | Revenue |
|---|---|---|
| Paper / Packaging | 2 | $29B |
|
||
| Retail | 1 | $160B |
|
||
| Transportation / Logistics | 1 | $91B |
|
||
| Airlines | 1 | $62B |
|
||
| Consumer Goods | 1 | $47B |
|
||
| Utilities | 1 | $25B |
|
||
Price history
+72.1% since first listed36 events — show timeline
- 2026-02-05 Listed $116,999 FMLS
- 2026-02-05 Listed $116,999 GAMLS
- 2025-08-29 Sold (Public Records) $99,200 Public Records
- 2025-08-28 Sold (MLS) $99,200 FMLS
- 2025-08-28 Sold (MLS) $99,200 GAMLS
- 2025-08-20 Pending — FMLS
- 2025-08-19 Pending — GAMLS
- 2025-07-29 Listed $114,900 FMLS
- 2025-07-29 Listed $114,900 GAMLS
- 2024-05-14 Sold (Public Records) $75,000 Public Records
- 2013-05-10 Price Changed $57,835 GAMLS
- 2013-03-11 Sold (Public Records) $57,900 Public Records
- 2013-03-01 Price Changed $57,835 FMLS
- 2013-03-01 Listing Removed — FMLS
- 2013-02-27 Sold (MLS) $57,835 GAMLS
- 2013-02-27 Sold (MLS) $57,835 FMLS
- 2013-02-27 Price Changed $63,000 FMLS
- 2013-02-23 Pending — FMLS
- 2013-02-13 Pending — GAMLS
- 2013-02-13 Contingent — FMLS
- 2013-02-12 Price Changed $63,000 GAMLS
- 2013-02-01 Listed $63,000 FMLS
- 2013-02-01 Listed $63,000 GAMLS
- 2011-11-30 Listing Removed — FMLS
- 2011-11-23 Sold (MLS) $25,000 FMLS
- 2011-11-01 Pending — FMLS
- 2011-10-28 Relisted — FMLS
- 2011-10-28 Price Changed $28,300 FMLS
- 2011-10-07 Pending — FMLS
- 2011-09-01 Price Changed $29,900 FMLS
- 2011-08-05 Listed $33,900 FMLS
- 2008-08-08 Sold (Public Records) $115,000 Public Records
- 2005-03-10 Sold (Public Records) $75,500 Public Records
- 2000-12-26 Sold (Public Records) $105,500 Public Records
- 1985-10-07 Sold (Public Records) $67,950 Public Records
- 1984-05-31 Sold (Public Records) $68,000 Public Records
Property tax history
+4.1%/yrLatest (2025): $4,273 · +8.4% YoY. Source: county tax records.
Cash-flow waterfall
monthlySold comps — $/sqft
last 12 mo · ≤1 miLoading sold comps…