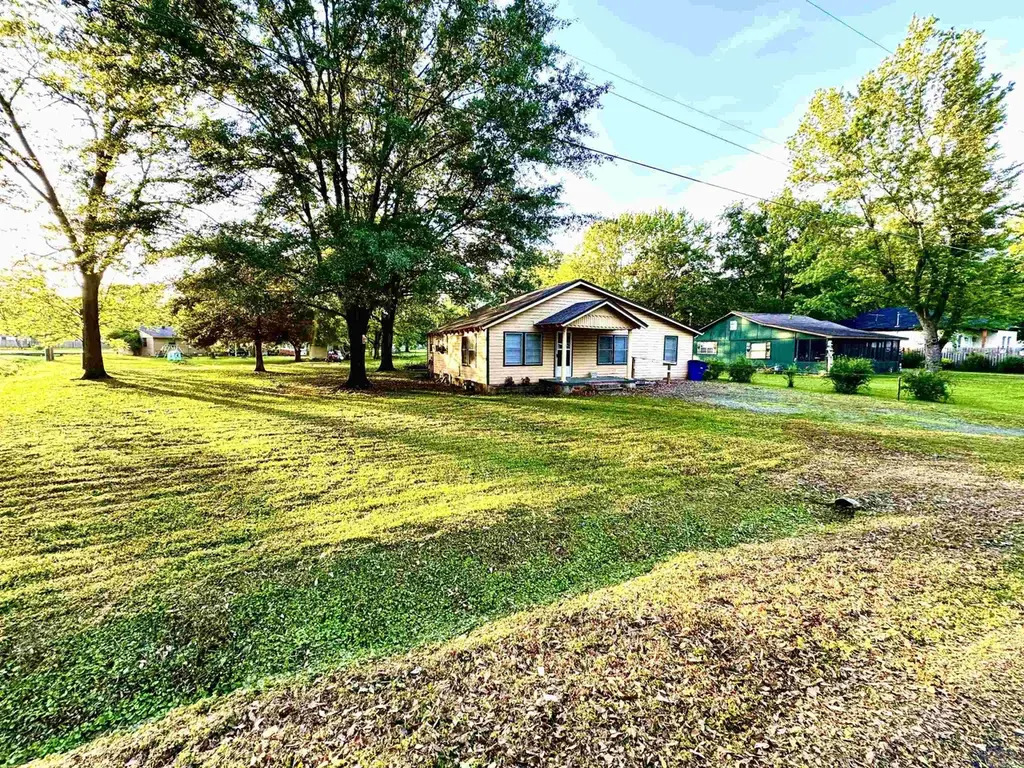
311 E College St · Beebe, AR
Flood risk 6/10 · Moderate
- FEMA flood zone
- X (unshaded)
- Chance of flooding over 30 yrs
- 0.73%
- Est. flood insurance / yr
- $507 – $1,088
Fire risk 3/10 · Minor
- Est. fire insurance / yr
- $1,499 – $2,785
Heat risk 6/10 · Moderate
- Hot days now (above 109°F)
- 7 days/yr
- Hot days in 30 yrs
- 19 days/yr
Wind risk 4/10 · Minor
- Chance of severe wind over 30 yrs
- 10.0%
Air-quality risk 2/10 · Minimal
- Unhealthy air days now
- 1 days/yr
- Unhealthy air days in 30 yrs
- 1 days/yr
Risk factors via First Street. Map © Google.
Why this score? — see what drove the C+ grade
The composite is a weighted blend of 9 inputs, each scored 0–100. Each bar is that input's sub-score; the figure is the points it added to the 100-point composite (weight × sub-score).
- Cash flow +26.8/30.0
- DSCR +9.2/10.0
- ARV discount +7.5/15.0
- 1% rule +7.2/10.0
- Schools +3.4/10.0
- Livability +3.3/5.0
- Rent growth +2.5/5.0
- Condition / age +2.5/5.0
- Appreciation +0.0/10.0
$89,500
🖨 Deal sheet 📄 Offer letter ✓ Due diligence
Listing remarks
Check out this quaint little house in a peaceful neighborhood in Beebe, AR. This house offers plenty of open space inside. The house has recently been remodeled with new flooring, paint, and countertops throughout. There are 2 large bedrooms as well as a large kitchen and living room. Relax in the large back yard and enjoy the large shade trees around the house. Come check out this property today.
Key facts
- Recently remodeled
- New flooring
- New paint
Tags
Property features AI
Finance
- Financial info: Financing available: VA, FHA, Conventional, Cash, Rural Development
Exterior
- Parking: Parking pads for 2 cars
- Utilities: Public water; Public sewer; Municipal electric (Entergy); Natural gas; Antenna TV; Fiber internet available
- Home design: Wood exterior
- Construction: 3-tab shingle roof; Crawl space foundation
- Exterior features: Porch; Paved road access; Level lot; Inside city limits
Interior
- Kitchen: Free-standing stove; Gas range
- Flooring: Carpet; Vinyl
- Bathrooms: 1 full bathroom; 1 half bathroom
- Heating & cooling: Window air units; Floor/wall furnace
- Interior features: Kitchen counter with ceramic tile; Sheetrock and paneling walls/ceilings
Neighborhood map
What this means for you Summary
Snapshot
- This is a 2-bed/1.5-bath single-family listed at $90k.
Deal economics
- At list price, monthly cash flow is $246 ($3k/yr) — positive.
- The deal already cash-flows at list — no discount required.
- Meets the 1% rule at list price ($1k rent vs $90k).
- Recommended offer: $88k (1.5% below list) — sets the bar for market timing.
- Cap rate 9.6% vs local median 3.7% in Beebe — top-decile yield for the area; either an underpriced asset or a hidden risk that comps aren't pricing in. Stress-test before assuming the spread holds.
Location & tenants
- Location reads 66/100 on livability (#114 in AR) — a middle-class / working-renter tenant base. Strengths: cost of living A+, housing A+; Watch: schools D+, crime F, amenities F.
- Beebe School District (town): math 44% / reading 36% proficiency, ranked #64 of 238 in AR (top 27%) — families likely to look elsewhere, expect single-tenant / working-renter base with shorter leases.
- Market conditions: 151 active listings in the ZIP; 3 comparable units currently listed for rent nearby; rentals at typical pace (median 24d on market — plan ~3-4 weeks tenant-placement turnaround); 219 units permitted in White County in 2024 (36 in 5+ unit buildings).
Forward outlook
- Local home prices are declining (-3.0%/yr); year-one equity from $619 of loan paydown is wiped out by about $3k of value loss. Plan a longer hold.
- White County population projected at +7% by 2050 — modest demand growth; plan on rents tracking national, not racing it.
- At projected returns (-3.0% appreciation + 3.0% rent growth), your $25k cash investment doubles in ~10 years — after that, you're playing with house money.
Negotiation context
- It's been on market 24 days — a 2% lower offer ($88k) is reasonable based on typical stale-listing flexibility.
- 4 sale attempts since 2y ago with the ask held roughly flat each time — persistent listings suggest the price (not the market) is what's stuck; bring a comps-based counter.
- Current owner paid $60k; 49% above their basis — modest negotiation headroom, anchor on the comps not their cost.
Risks & watch-outs
- Watch-outs: built in 1941 — expect roof / HVAC / electrical / plumbing capex.
- Climate carrying-cost: major flood risk; extreme-heat days projected 7→19/yr by 2055 (HVAC capex compounding) — expect insurance premiums to compound above CPI over the hold.
Questions for the listing agent
- Built in 1941 — when were the roof, HVAC, electrical panel, plumbing, and water heater last replaced?
- Is there a deadline driving the sale (1031 exchange, divorce, estate, relocation)? That informs how much negotiation room exists.
- Schools are D-rated, which usually means shorter tenancies and higher turnover. Who's the typical renter profile here, and what's been the actual vacancy rate?
- Crime grade is F in this area — have there been break-ins, vandalism, or insurance claims at this property in the last 3 years? What carrier currently insures it and at what premium?
- What's the average days-on-market for RENTAL listings here right now (not sales)? A rising rental-DOM trend means longer vacancies and softer asking-rent achievability than the comps imply.
- What's the recent tenant-quality profile in this submarket — average credit score on applications, eviction rate, late-payment / NSF rate, and stable-employment percentage? A property-management company in the area should have these aggregated.
- How much new for-sale + rental construction is in the pipeline within 1–3 miles? Heavy new supply typically softens prices + rents 12–24 months out; constrained supply supports both.
Investment metrics
- 1% rule
- 1.22% ✓
- Cap rate
- 9.59%
- Cash-on-cash
- 11.76%
- DSCR
- 1.52
- GRM
- 6.8
CMA / ARV
- ARV (on-the-fly)
- $222,824
- Comps found
- 12
Show comp detail 12 sales within ~0.75 mi
| Address | Dist | Beds/Ba | Sqft | Sold | Price | $/sf | Match |
|---|---|---|---|---|---|---|---|
| 410 N Cedar St St | 0.06mi | 3/2.0 (+1) | 1,340 (-3%) | 5mo | $225,000 | $168 | 81 |
| 124 S Apple St | 0.35mi | 3/2.0 (+1) | 1,350 (-2%) | 0mo | $218,000 | $161 | 72 |
| 113 E Florida St | 0.37mi | 3/2.0 (+1) | 1,340 (-3%) | 0mo | $217,000 | $162 | 70 |
| 104 Mahoney Dr | 0.34mi | 3/2.0 (+1) | 1,408 (+2%) | 6mo | $180,599 | $128 | 70 |
| 202 S Apple St | 0.39mi | 3/2.0 (+1) | 1,340 (-3%) | 1mo | $217,000 | $162 | 69 |
| 111 E Florida St | 0.37mi | 3/2.0 (+1) | 1,350 (-2%) | 5mo | $218,000 | $161 | 68 |
| 211 N Hickory | 0.59mi | 2/1.5 | 1,311 (-5%) | 3mo | $145,000 | $111 | 61 |
| 122 S Apple St | 0.35mi | 3/2.0 (+1) | 1,250 (-10%) | 2mo | $202,000 | $162 | 59 |
| 207 E Florida | 0.43mi | 3/2.0 (+1) | 1,500 (+8%) | 1mo | $249,500 | $166 | 58 |
| 406 S Cypress St | 0.63mi | 3/1.0 (+1) | 1,393 (+1%) | 6mo | $163,000 | $117 | 58 |
| 1104 Locust St | 0.63mi | 3/2.0 (+1) | 1,564 (+13%) | 1mo | $198,000 | $127 | 41 |
| 615 S Elm St | 0.75mi | 3/1.0 (+1) | 1,186 (-14%) | 6mo | $65,000 | $55 | 29 |
Match score weights: distance 35% · size 25% · config 20% · recency 20%. Top-matched comps best support the ARV.
Projected returns pro-forma
-3.0% appreciation · 3.0% rent growth · sell at horizon
- IRR
- 1.2%
- Equity multiple
- 1.05×
- Total profit
- $1,153
- Equity at exit
- $13,345
- IRR
- 10.8%
- Equity multiple
- 1.85×
- Total profit
- $21,210
- Equity at exit
- $7,738
Cash invested: $25,060 (down + closing). Projections, not guarantees.
Landlord ↔ Tenant lean methodology
- Overall (STATE)
- 92 Strongly Landlord-Friendly
- State Arkansas
- 92 Strongly Landlord-Friendly · R+14
- County
- — inherits STATE
- City
- — inherits STATE
ZIP-level market 72012
- Home prices YoY
- -15.4%
- Active inventory
- 151
- Price-to-rent
- 6.8×
Monthly cashflow live
- Estimated rent
- $1,094 medium interval (Pro) →
- Mortgage (P&I)
- −$469
- Tax est. 1.5%
- −$112 /mo · $1,342/yr
- Insurance
- −$37
- HOA
- −$0
- Vacancy / Maint / Mgmt
- −$230
- Net cashflow
- $246
Break-even live
UW: 25.0% down · 7.5% · 30yr · 1.5% tax · 5.0% vac · 8.0% maint · 8.0% mgmt
Financing live
Cash to close
- Down payment
- $22,375
- Closing costs
- $2,685
- Reserves months
- —
- Total cash needed
- —
Loan-product check · same deal, 3 products live
Conventional
25% down · 7.5% · 30yr
- Down + closing
- —
- Monthly P&I
- —
- Monthly cashflow
- —
- DSCR
- —
- Eligible?
- —
Personal DTI + credit; lowest rate.
DSCR
20% down · 8.5% · 30yr
- Down + closing
- —
- Monthly P&I
- —
- Monthly cashflow
- —
- DSCR
- —
- Eligible?
- —
No personal income docs; deal must DSCR.
Hard money
10% down · 12.0% · 12mo
- Down + closing
- —
- Monthly P&I
- —
- Monthly cashflow
- —
- DSCR
- —
- Eligible?
- —
Short-term bridge; refi at stabilization.
Rent comps 3 comps
| Address | Beds | Baths | Sqft | Rent | $/sqft | DOM | Units | Dist |
|---|---|---|---|---|---|---|---|---|
| 501 N Elm St Beebe, AR | 2.0 | 1.0 | 1028 | $795 | $0.77 | 23d | 1 | 0.38mi |
| 213 S Main St Beebe, AR | 3.0 | 1.0 | 1508 | $1,350 | $0.90 | 23d | 1 | 0.40mi |
| 606 Oregon St Beebe, AR | 2.0 | 2.0 | 1394 | $1,095 | $0.79 | 43d | 1 | 0.69mi |
Listing history 30 events
-
2026-06-19days on market $89,500 Active 24 DOM
-
2026-06-18days on market $89,500 Active 23 DOM
-
2026-06-17days on market $89,500 Active 22 DOM
-
2026-06-16days on market $89,500 Active 21 DOM
-
2026-06-15days on market $89,500 Active 20 DOM
-
2026-06-14days on market $89,500 Active 18 DOM
-
2026-06-12days on market $89,500 Active 17 DOM
-
2026-06-09days on market $89,500 Active 14 DOM
-
2026-06-08days on market $89,500 Active 13 DOM
-
2026-06-07days on market $89,500 Active 12 DOM
-
2026-06-05days on market $89,500 Active 9 DOM
-
2026-06-03days on market $89,500 Active 8 DOM
-
2026-06-02statusdays on market $89,500 Active 7 DOM
-
2026-06-01days on market $89,500 New Listing 6 DOM
-
2026-05-31days on market $89,500 New Listing 5 DOM
-
2026-05-30days on market $89,500 New Listing 4 DOM
-
2026-05-26$89,500 New Listing
-
2025-09-15historical
-
2025-08-13price $92,500
-
2025-08-12status Price Change
-
2025-05-04historical Take Backups
-
2025-03-01price $95,000
-
2025-01-17price $95,500
-
2024-12-17price $99,500
-
2024-11-07status Back on Market
-
2024-09-26historical Take Backups
-
2024-08-30price $105,000
-
2024-06-26price $125,000
-
2024-05-07$110,000 New Listing
-
2024-04-04soldstatus $60,000
ⓘ Source: listings_history table (triggers on properties + properties_extension) + one-shot
backfill from property_details.listing_events for pre-trigger history.
Climate risk First Street
- Flood 6/10 Major FEMA zone X (unshaded) · 73% chance over 30 yrs
- Wildfire 3/10 Moderate
- Heat 6/10 Major 7 d/yr ≥109°F today · 19 d/yr by 30 yrs out
- Wind 4/10 Moderate 10% chance of damaging wind over 30 yrs
- Air quality 2/10 Low 1 unhealthy d/yr today · 1 by 30 yrs out
Nearby sold comps map
Loading sold comps map…
Walkable amenities ~0.75 mi
Loading nearby amenities…
Taxation est. · year 1
- Rental income
- $13,125
- − Mortgage interest
- −$5,013
- − Property taxes
- −$1,342
- − Insurance
- −$448
- − Repairs & maintenance
- −$1,050
- − Management
- −$1,050
- − Depreciation
- −$2,604
- Taxable income
- $1,618
- Est. tax owed @ 24.0%
- −$388
- After-tax cash flow
- $2,558/yr
For passive investors: Depreciation is non-cash, so a rental often shows a tax loss while cash-flowing — sheltering income. Rental losses are passive: they offset passive income freely, and up to $25,000/yr can offset ordinary (W-2) income if you actively participate and your MAGI is under $100k (phasing out to $0 by $150k); unused losses carry forward. On sale, claimed depreciation is recaptured at up to 25%, and gains may owe capital-gains tax (a 1031 exchange can defer both). Figures are a year-1 estimate at your 24.0% rate — not tax advice; consult a CPA.
Schools (NCES district)
- District
- Beebe School District
- NCES district ID
- 0502880
- Math proficiency
- 44% ▼ -10.00%
- Reading proficiency
- 36% ▼ -7.00%
- Median HH income
- $45,433
- Composite
- 34.1/100
- National rank
- #5293
- State rank
- #64 of 238 in AR
Livability — Beebe
- Score
- 66/100
- State rank
- #114
- US rank
- #11235
Category grades
Schools grade is shown separately in the Schools card above.
Census & demographics
- Census place
- Beebe, AR
- Population (ZIP)
- 13,663
Population outlook (White County) Hauer SSP2
- Today (2025)
- 82,310 people
- By 2030
- 83,861 · +1.9%
- By 2040
- 86,492 · +5.1%
- By 2050
- 88,246 · +7.2%
- By 2075
- 91,307 · +10.9%
- By 2100
- 91,548 · +11.2%
Race, ethnicity, and origin ACS 2023
- Neighborhood character
- Predominantly White (90%)
- Race & ethnicity
- White 90% Two or more races 6% Hispanic / Latino 3% Black 1%
- Common ancestry
- Slovak 3% Italian 2% Romanian 1%
- Foreign-born
- 1% · Canada
- Languages at home
- 98% English-only · Spanish 1%
Political lean MEDSL · White
- 2024 margin
- Solid R (+61.2) · D 18.3% · R 79.5% · Other 2.2%
- 2008→2024 swing
- -14.0pp toward R · 2008: -47.2pp · 2024: -61.2pp
- All cycles
- 2024: R+61.2 2020: R+58.9 2016: R+57.9 2012: R+53.7 2008: R+47.2
Not yet ingested
- Civics
- —
Market trends
- HPI YoY
- ▼ -40.40%
- Current HPI
- 221.5962
- Rent YoY
- —
- Metro
- —
- State GDP YoY
- ▲ 3.80%
- F500 in state
- 10
Industry mix (Fortune 500 HQ in AR)
| Industry | F500 HQs | Revenue |
|---|---|---|
| Retail | 1 | $681B |
|
||
| Food / Agriculture | 1 | $53B |
|
||
| Retail / Energy | 1 | $22B |
|
||
| Transportation / Logistics | 1 | $12B |
|
||
| Energy | 1 | $4B |
|
||
Price history
+49.2% since first listed14 events — show timeline
- 2026-05-26 Listed $89,500 CARMLS
- 2025-09-15 Listing Removed — CARMLS
- 2025-08-13 Price Changed $92,500 CARMLS
- 2025-08-12 Relisted — CARMLS
- 2025-05-04 Contingent — CARMLS
- 2025-03-01 Price Changed $95,000 CARMLS
- 2025-01-17 Price Changed $95,500 CARMLS
- 2024-12-17 Price Changed $99,500 CARMLS
- 2024-11-07 Relisted — CARMLS
- 2024-09-26 Contingent — CARMLS
- 2024-08-30 Price Changed $105,000 CARMLS
- 2024-06-26 Price Changed $125,000 CARMLS
- 2024-05-07 Listed $110,000 CARMLS
- 2024-04-04 Sold (Public Records) $60,000 Public Records
Property tax history
-82.3%/yrLatest (2022): $2 · +0.0% YoY. Source: county tax records.
Cash-flow waterfall
monthlySold comps — $/sqft
last 12 mo · ≤1 miLoading sold comps…