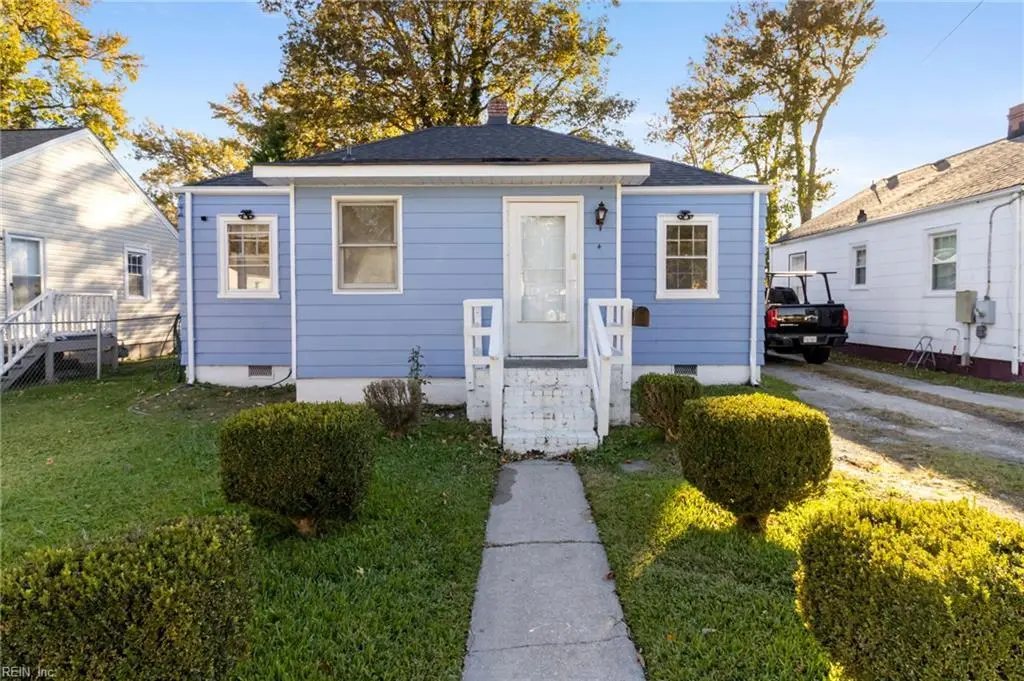
4 Fiske St · Portsmouth, VA
Flood risk 1/10 · Minimal
- FEMA flood zone
- X (unshaded)
- Chance of flooding over 30 yrs
- 0.0%
- Est. flood insurance / yr
- $507 – $1,088
Fire risk 1/10 · Minimal
- Est. fire insurance / yr
- $666 – $1,236
Heat risk 9/10 · Severe
- Hot days now (above 106°F)
- 7 days/yr
- Hot days in 30 yrs
- 16 days/yr
Wind risk 8/10 · Major
- Chance of severe wind over 30 yrs
- 80.0%
Air-quality risk 5/10 · Moderate
- Unhealthy air days now
- 6 days/yr
- Unhealthy air days in 30 yrs
- 7 days/yr
Risk factors via First Street. Map © Google.
Why this score? — see what drove the C grade
The composite is a weighted blend of 9 inputs, each scored 0–100. Each bar is that input's sub-score; the figure is the points it added to the 100-point composite (weight × sub-score).
- Cash flow +14.0/30.0
- ARV discount +12.1/15.0
- Appreciation +10.0/10.0
- DSCR +4.2/10.0
- Schools +3.9/10.0
- Livability +3.7/5.0
- 1% rule +3.6/10.0
- Rent growth +3.5/5.0
- Condition / age +2.5/5.0
$219,999
🖨 Deal sheet 📄 Offer letter ✓ Due diligence
Listing remarks MLS
Charming and move-in ready, this home offers modern comfort and classic appeal! Enjoy peace of mind with a new roof and HVAC system installed in 2021. The spacious master suite features a large walk-in closet, great for all your storage needs. A detached garage adds convenience and extra space for parking or hobbies. The cozy backyard is great for relaxing or light gardening without the upkeep of a large yard. Don’t miss this well-maintained home that blends updates, functionality, and comfort in one inviting packag
Key facts
- Cozy backyard
- Hvac system
- New roof
Tags
Neighborhood map
What this means for you Summary
Snapshot
- This is a 2-bed/2.0-bath single-family listed at $220k.
Deal economics
- At list price, monthly cash flow is $26 ($316/yr) — positive.
- The deal already cash-flows at list — no discount required.
- To meet the 1% rule (rent ≥ 1% of price), the offer needs to be $189k (14.1% below list).
- Recommended offer: $189k (14.1% below list) — sets the bar for 1% rule.
- Cap rate 6.4% vs local median 4.6% in Portsmouth — top-decile yield for the area; either an underpriced asset or a hidden risk that comps aren't pricing in. Stress-test before assuming the spread holds.
Location & tenants
- Location reads 73/100 on livability (#172 in VA) — a middle-class / working-renter tenant base. Strengths: amenities A+, cost of living A+, housing A+; Watch: employment C-, crime F, commute F.
- Portsmouth City Public School District (urban): math 34% / reading 58% proficiency, ranked #107 of 131 in VA (top 82%) — families likely to look elsewhere, expect single-tenant / working-renter base with shorter leases.
- Market conditions: Rents rising (+4.0%/yr); 64 active listings in the ZIP; 26 comparable units currently listed for rent nearby; rentals at typical pace (median 24d on market — plan ~3-4 weeks tenant-placement turnaround); 300 units permitted in Portsmouth city in 2024 (112 in 5+ unit buildings).
- At $1,889/mo this rent would consume 46% of the median local household income ($49k/yr) (locally 534% of renters already pay >50% of income on rent) — very limited rent-growth headroom before tenants either downsize or default.
Forward outlook
- In year one you build about $24k of equity ($2k loan paydown + $22k appreciation (10.0% local appreciation)).
- At projected returns (10.0% appreciation + 4.0% rent growth), your $62k cash investment doubles in ~3 years — after that, you're playing with house money.
- By year 2, paydown + projected appreciation supports a ~$38k cash-out refi (75% LTV) — recoverable capital for the next deal without selling this one.
Negotiation context
- It's been on market 21 days — a 2% lower offer ($217k) is reasonable based on typical stale-listing flexibility.
- 4 sale attempts since 5y ago with the ask held roughly flat each time — persistent listings suggest the price (not the market) is what's stuck; bring a comps-based counter.
- Current owner paid $150k; 47% above their basis — modest negotiation headroom, anchor on the comps not their cost.
Risks & watch-outs
- Watch-outs: built in 1941 — expect roof / HVAC / electrical / plumbing capex.
- Climate carrying-cost: severe wind risk, 80% chance of damaging wind over 30y; extreme-heat days projected 7→16/yr by 2055 (HVAC capex compounding) — expect insurance premiums to compound above CPI over the hold.
Questions for the listing agent
- Built in 1941 — when were the roof, HVAC, electrical panel, plumbing, and water heater last replaced?
- Is there a deadline driving the sale (1031 exchange, divorce, estate, relocation)? That informs how much negotiation room exists.
- Schools are B-rated — typically a magnet for longer-tenancy family renters. What's the average tenant stay here, and is there a school-zone premium baked into asking?
- Crime grade is F in this area — have there been break-ins, vandalism, or insurance claims at this property in the last 3 years? What carrier currently insures it and at what premium?
- What's the average days-on-market for RENTAL listings here right now (not sales)? A rising rental-DOM trend means longer vacancies and softer asking-rent achievability than the comps imply.
- What's the recent tenant-quality profile in this submarket — average credit score on applications, eviction rate, late-payment / NSF rate, and stable-employment percentage? A property-management company in the area should have these aggregated.
- How much new for-sale + rental construction is in the pipeline within 1–3 miles? Heavy new supply typically softens prices + rents 12–24 months out; constrained supply supports both.
Investment metrics
- 1% rule
- 0.86% ✗
- Cap rate
- 6.44%
- Cash-on-cash
- 0.51%
- DSCR
- 1.02
- GRM
- 9.7
CMA / ARV
- ARV (median comp)
- $244,796
- List price
- $219,999
- Delta
- -8.09%
- Verdict
- FAIR
- Comps
- 20 within 1.0 mi
Show comp detail 12 sales within ~0.75 mi
| Address | Dist | Beds/Ba | Sqft | Sold | Price | $/sf | Match |
|---|---|---|---|---|---|---|---|
| 1512 Boxwood Dr | 0.36mi | 3/2.0 (+1) | 1,208 (-4%) | 2mo | $365,000 | $302 | 69 |
| 14 Fairview Cir S | 0.54mi | 3/1.0 (+1) | 1,300 (+3%) | 2mo | $192,000 | $148 | 60 |
| 3 Prospect Pkwy | 0.61mi | 3/2.0 (+1) | 1,216 (-4%) | 2mo | $126,000 | $104 | 58 |
| 4221 George Washington Hwy | 0.30mi | 3/3.0 (+1) | 1,398 (+11%) | 3mo | $277,000 | $198 | 57 |
| 100 Channing Ave | 0.65mi | 3/2.0 (+1) | 1,300 (+3%) | 4mo | $280,500 | $216 | 57 |
| 4320 Deep Creek Blvd | 0.43mi | 3/1.0 (+1) | 1,150 (-9%) | 1mo | $234,900 | $204 | 55 |
| 59 Bainbridge Ave | 0.60mi | 3/1.0 (+1) | 1,214 (-4%) | 3mo | $120,000 | $99 | 54 |
| 11 Aylwin Rd | 0.64mi | 2/1.0 | 1,165 (-8%) | 4mo | $129,900 | $112 | 50 |
| 2029 Battery Park Rd | 0.60mi | 3/1.5 (+1) | 1,400 (+11%) | 2mo | $297,400 | $212 | 46 |
| 2621 Greenwood Dr | 0.67mi | 3/1.0 (+1) | 1,380 (+9%) | 2mo | $249,000 | $180 | 43 |
| 12 Brierdale Pl | 0.65mi | 3/2.0 (+1) | 1,437 (+14%) | 2mo | $250,000 | $174 | 40 |
| 100 Dahlgren Ave Unit B | 0.59mi | 3/1.0 (+1) | 1,078 (-15%) | 1mo | $194,700 | $181 | 38 |
Match score weights: distance 35% · size 25% · config 20% · recency 20%. Top-matched comps best support the ARV.
Projected returns pro-forma
10.0% appreciation · 3.97% rent growth · sell at horizon
- IRR
- 25.0%
- Equity multiple
- 3.00×
- Total profit
- $123,351
- Equity at exit
- $198,193
- IRR
- 22.3%
- Equity multiple
- 6.94×
- Total profit
- $365,851
- Equity at exit
- $427,410
Cash invested: $61,600 (down + closing). Projections, not guarantees.
Landlord ↔ Tenant lean methodology
- Overall (STATE)
- 55 Moderately Landlord-Leaning
- State Virginia
- 55 Moderately Landlord-Leaning · D+2
- County
- — inherits STATE
- City
- — inherits STATE
ZIP-level market 23702
- Home prices YoY
- 5.2%
- Rents YoY
- 4.0%
- Active inventory
- 64
- Price-to-rent
- 9.7×
Monthly cashflow live
- Estimated rent
- $1,889 high interval (Pro) →
- Mortgage (P&I)
- −$1,154
- Tax from tax record
- −$221 /mo · $2,649/yr
- Insurance
- −$92
- HOA
- −$0
- Vacancy / Maint / Mgmt
- −$397
- Net cashflow
- $26
Break-even live
UW: 25.0% down · 7.5% · 30yr · 1.5% tax · 5.0% vac · 8.0% maint · 8.0% mgmt
Financing live
Cash to close
- Down payment
- $55,000
- Closing costs
- $6,600
- Reserves months
- —
- Total cash needed
- —
Loan-product check · same deal, 3 products live
Conventional
25% down · 7.5% · 30yr
- Down + closing
- —
- Monthly P&I
- —
- Monthly cashflow
- —
- DSCR
- —
- Eligible?
- —
Personal DTI + credit; lowest rate.
DSCR
20% down · 8.5% · 30yr
- Down + closing
- —
- Monthly P&I
- —
- Monthly cashflow
- —
- DSCR
- —
- Eligible?
- —
No personal income docs; deal must DSCR.
Hard money
10% down · 12.0% · 12mo
- Down + closing
- —
- Monthly P&I
- —
- Monthly cashflow
- —
- DSCR
- —
- Eligible?
- —
Short-term bridge; refi at stabilization.
Rent comps 26 comps
| Address | Beds | Baths | Sqft | Rent | $/sqft | DOM | Units | Dist |
|---|---|---|---|---|---|---|---|---|
| 213 Monmouth St Portsmouth, VA | 3.0 | 2.5 | 1800 | $2,450 | $1.36 | 44d | 1 | 0.17mi |
| 134 Monmouth St Portsmouth, VA | 3.0 | 2.5 | 1440 | $2,450 | $1.70 | 44d | 1 | 0.23mi |
| 10 Parkside Pl Portsmouth, VA | 3.0 | 2.0 | 1800 | $2,095 | $1.16 | 17d | 1 | 0.42mi |
| 2509 Smithfield Rd Portsmouth, VA | 3.0 | 2.5 | 1540 | $2,345 | $1.52 | 21d | 1 | 0.69mi |
| 2750 Greenwood Dr Portsmouth, VA | 3.0 | 2.0 | 1200 | $1,700 | $1.42 | 23d | 1 | 0.79mi |
| 21 DeKalb Ave Portsmouth, VA | 2.0 | 1.0 | 984 | $1,550 | $1.58 | 44d | 1 | 0.81mi |
| 3724 Deep Creek Blvd Unit 3728 Portsmouth, VA | 2.0 | 1.0 | 900 | $995 | $1.11 | 23d | 1 | 0.85mi |
| 3724 Deep Creek Blvd Unit 3754 Portsmouth, VA | 2.0 | 1.0 | 900 | $995 | $1.11 | 12d | 1 | 0.85mi |
| 18 Cooper Dr Portsmouth, VA | 2.0 | 1.0 | 920 | $1,400 | $1.52 | 17d | 1 | 0.85mi |
| 102 Francis St #98 Portsmouth, VA | 2.0 | 1.5 | 1000 | $1,395 | $1.40 | 16d | 1 | 0.90mi |
| 98 Francis St Portsmouth, VA | 2.0 | 2.0 | 984 | $1,395 | $1.42 | 14d | 1 | 0.91mi |
| 251 Independence St Portsmouth, VA | 3.0 | 2.5 | 1294 | $2,550 | $1.97 | 23d | 1 | 0.92mi |
| 231 Edison Ave Unit 231 Portsmouth, VA | 2.0 | 1.5 | 1050 | $1,275 | $1.21 | 10d | 1 | 1.05mi |
| 231 Edison Ave Portsmouth, VA | 2.0 | 1.5 | 1100 | $1,275 | $1.16 | 20d | 1 | 1.05mi |
| 213 Beacon Rd Portsmouth, VA | 3.0 | 2.0 | 1280 | $2,300 | $1.80 | 23d | 1 | 1.14mi |
| 1114 Woodland Terrace Dr Chesapeake, VA | 3.0 | 1.0 | 1223 | $2,000 | $1.64 | 23d | 1 | 1.25mi |
| 70 Manly St Portsmouth, VA | 2.0 | 1.0 | 1000 | $1,350 | $1.35 | 44d | 1 | 1.26mi |
| 2715 Portsmouth Blvd Portsmouth, VA | 2.0 | 1.0 | 1428 | $1,425 | $1.00 | 14d | 1 | 1.31mi |
| 2715 Portsmouth Blvd Portsmouth, VA | 2.0 | 1.0 | 1428 | $1,425 | $1.00 | 17d | 1 | 1.31mi |
| 1409 Wilcox Ave Portsmouth, VA | 3.0 | 2.5 | 1800 | $2,500 | $1.39 | 44d | 1 | 1.37mi |
| 908 Lake Village Dr Chesapeake, VA | 2.0–3.0 | 1.0 | 972 | $1,238 | $1.27 | 3d | 7 | 1.39mi |
| 2810 Roanoke Ave Portsmouth, VA | 3.0 | 1.5 | 1100 | $2,100 | $1.91 | 44d | 1 | 1.42mi |
| 3317 Downes St Portsmouth, VA | 3.0 | 2.0 | 1148 | $1,995 | $1.74 | 3d | 1 | 1.44mi |
| 3317 Downes St Portsmouth, VA | 3.0 | 2.0 | 1148 | $1,995 | $1.74 | 10d | 1 | 1.44mi |
| 207 Falcon Ave Portsmouth, VA | 3.0 | 2.5 | 1720 | $3,000 | $1.74 | 44d | 1 | 1.46mi |
| 1314 Summit Ave Portsmouth, VA | 3.0 | 1.5 | 1152 | $1,750 | $1.52 | 44d | 1 | 1.48mi |
Listing history 25 events
-
2026-06-18days on market $219,999 Active 21 DOM
-
2026-06-17days on market $219,999 Active 20 DOM
-
2026-06-16days on market $219,999 Active 19 DOM
-
2026-06-15days on market $219,999 Active 18 DOM
-
2026-06-13days on market $219,999 Active 16 DOM
-
2026-06-09days on market $219,999 Active 12 DOM
-
2026-06-08days on market $219,999 Active 11 DOM
-
2026-06-07days on market $219,999 Active 10 DOM
-
2026-06-03days on market $219,999 Active 6 DOM
-
2026-06-02days on market $219,999 Active 5 DOM
-
2026-06-01days on market $219,999 Active 4 DOM
-
2026-05-31days on market $219,999 Active 3 DOM
-
2026-01-06$224,999 Active 527-char remark
Show marketing remark (527 chars)
Charming and move-in ready, this home offers modern comfort and classic appeal! Enjoy peace of mind with a new roof and HVAC system installed in 2021. The spacious master suite features a large walk-in closet, great for all your storage needs. A detached garage adds convenience and extra space for parking or hobbies. The cozy backyard is great for relaxing or light gardening without the upkeep of a large yard. Don’t miss this well-maintained home that blends updates, functionality, and comfort in one inviting packag
-
2026-01-06historical
Show marketing remark (527 chars)
Charming and move-in ready, this home offers modern comfort and classic appeal! Enjoy peace of mind with a new roof and HVAC system installed in 2021. The spacious master suite features a large walk-in closet, great for all your storage needs. A detached garage adds convenience and extra space for parking or hobbies. The cozy backyard is great for relaxing or light gardening without the upkeep of a large yard. Don’t miss this well-maintained home that blends updates, functionality, and comfort in one inviting packag
-
2025-12-03price $239,999
-
2025-11-04$249,999 Active
-
2021-12-29soldstatus $149,800
-
2021-11-30status Under Contract
-
2021-11-17price $149,800
-
2021-11-12status Active
-
2021-11-08status Under Contract
-
2021-11-01price $149,900
-
2021-10-11price $150,000
-
2021-09-30$170,000 Active
-
2009-07-07soldstatus $109,000
ⓘ Source: listings_history table (triggers on properties + properties_extension) + one-shot
backfill from property_details.listing_events for pre-trigger history.
Tax reassessment forecast VA · Resets to sale price
- Current annual tax
- $2,649 · $221/mo
- Projected year-2 tax
- $2,649 · $221/mo
- Expected delta
- $0/yr ($0/mo · 0.0%)
ⓘ Screening estimate from a state-policy table — verify with the county assessor before closing.
Climate risk First Street
- Flood 1/10 Low FEMA zone X (unshaded) · 0% chance over 30 yrs
- Wildfire 1/10 Low
- Heat 9/10 Extreme 7 d/yr ≥106°F today · 16 d/yr by 30 yrs out
- Wind 8/10 Severe 80% chance of damaging wind over 30 yrs
- Air quality 5/10 Major 6 unhealthy d/yr today · 7 by 30 yrs out
Nearby sold comps map
Loading sold comps map…
Walkable amenities ~0.75 mi
Loading nearby amenities…
Taxation est. · year 1
- Rental income
- $22,670
- − Mortgage interest
- −$12,323
- − Property taxes
- −$2,649
- − Insurance
- −$1,100
- − Repairs & maintenance
- −$1,814
- − Management
- −$1,814
- − Depreciation
- −$6,400
- Taxable loss
- −$3,429
- Est. tax savings @ 24.0%
- +$823
- After-tax cash flow
- $1,139/yr
For passive investors: Depreciation is non-cash, so a rental often shows a tax loss while cash-flowing — sheltering income. Rental losses are passive: they offset passive income freely, and up to $25,000/yr can offset ordinary (W-2) income if you actively participate and your MAGI is under $100k (phasing out to $0 by $150k); unused losses carry forward. On sale, claimed depreciation is recaptured at up to 25%, and gains may owe capital-gains tax (a 1031 exchange can defer both). Figures are a year-1 estimate at your 24.0% rate — not tax advice; consult a CPA.
Schools (NCES district)
- District
- Portsmouth City Public School District
- NCES district ID
- 5103000
- Math proficiency
- 34% ▼ -40.00%
- Reading proficiency
- 58% ▼ -12.00%
- Median HH income
- $46,152
- Composite
- 39.01/100
- National rank
- #4071
- State rank
- #107 of 131 in VA
Livability — Portsmouth
- Score
- 73/100
- State rank
- #172
- US rank
- #5381
Category grades
Schools grade is shown separately in the Schools card above.
Census & demographics
- Census place
- Portsmouth, VA
- County
- Portsmouth City · 96,366 people
- City population
- 96,366
- Metro
- Virginia Beach-Norfolk-Newport News, VA-NC
- Population (ZIP)
- 12,485
- Household income
- $48,835
- Rent vs Own
- Severe rent burden
- 534.0
Population outlook (Portsmouth County) Hauer SSP2
- Today (2025)
- 96,730 people
- By 2030
- 96,760 · +0.0%
- By 2040
- 96,573 · -0.2%
- By 2050
- 95,606 · -1.2%
- By 2075
- 93,579 · -3.3%
- By 2100
- 83,756 · -13.4%
Race, ethnicity, and origin ACS 2023
- Neighborhood character
- Diverse neighborhood (Simpson 0.62)
- Race & ethnicity
- Black 50% White 35% Two or more races 9% Hispanic / Latino 8%
- Hispanic origin (detail)
- Mexican 2% Puerto Rican 3%
- Common ancestry
- Lithuanian 1% Italian 1% Slovak 1%
- Foreign-born
- 4% · Canada, South Korea
- Languages at home
- 95% English-only · Spanish 4%
Political lean MEDSL · Portsmouth
- 2024 margin
- Solid D (+38.6) · D 68.6% · R 30.0% · Other 1.4%
- 2008→2024 swing
- -0.7pp no change · 2008: 39.3pp · 2024: 38.6pp
- All cycles
- 2024: D+38.6 2020: D+40.8 2016: D+36.5 2012: D+39.6 2008: D+39.3
Not yet ingested
- Civics
- —
Market trends
- HPI YoY
- ▲ 16.70%
- Current HPI
- 340.0817
- Rent YoY
- ▲ 3.97%
- Metro
- Virginia Beach-Norfolk-Newport News, VA-NC
- State GDP YoY
- ▲ 2.40%
- F500 in state
- 50
Industry mix (Fortune 500 HQ in VA)
| Industry | F500 HQs | Revenue |
|---|---|---|
| Aerospace / Defense | 4 | $236B |
|
||
| Technology / Defense | 3 | $32B |
|
||
| Financial Services | 2 | $176B |
|
||
| Utilities | 2 | $27B |
|
||
| Insurance | 2 | $25B |
|
||
| Technology | 2 | $15B |
|
||
Price history
+106.4% since first listed13 events — show timeline
- 2026-01-06 Listing Removed — REINMLS
- 2026-01-06 Listed $224,999 REINMLS
- 2025-12-03 Price Changed $239,999 REINMLS
- 2025-11-04 Listed $249,999 REINMLS
- 2021-12-29 Sold (Public Records) $149,800 Public Records
- 2021-11-30 Pending — REINMLS
- 2021-11-17 Price Changed $149,800 REINMLS
- 2021-11-12 Relisted — REINMLS
- 2021-11-08 Pending — REINMLS
- 2021-11-01 Price Changed $149,900 REINMLS
- 2021-10-11 Price Changed $150,000 REINMLS
- 2021-09-30 Listed $170,000 REINMLS
- 2009-07-07 Sold (Public Records) $109,000 Public Records
Property tax history
+5.5%/yrLatest (2025): $2,649 · +1.7% YoY. Source: county tax records.
Cash-flow waterfall
monthlySold comps — $/sqft
last 12 mo · ≤1 miLoading sold comps…