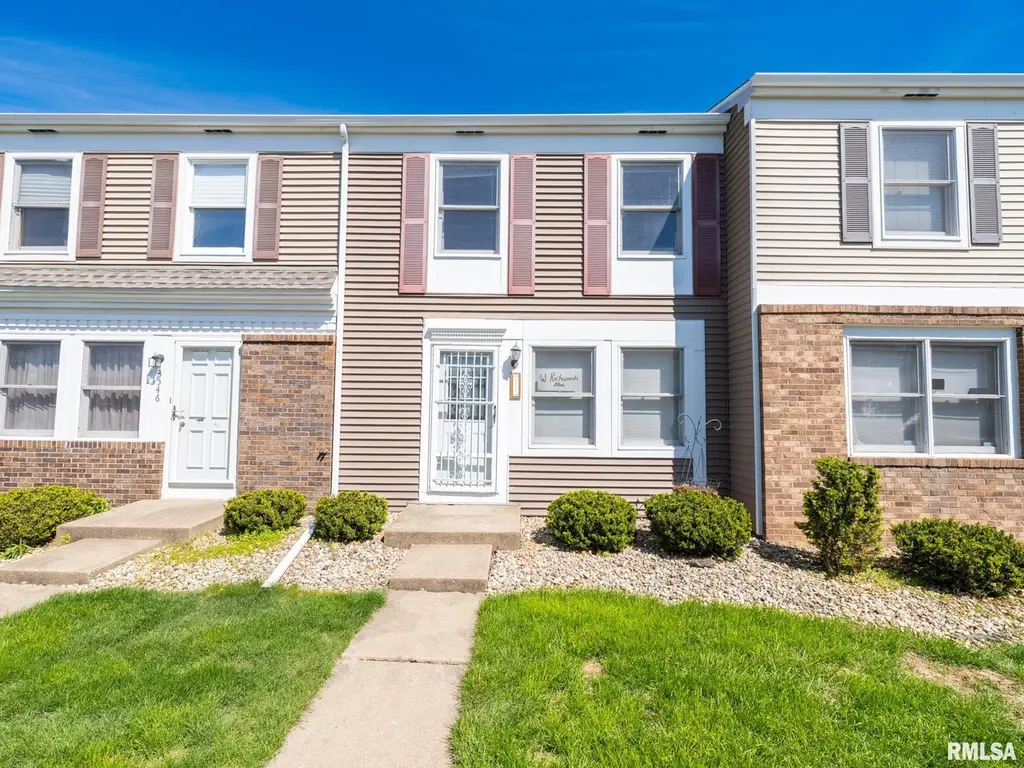
3544 W Richwoods Blvd #23 · Peoria, IL
Flood risk 1/10 · Minimal
- FEMA flood zone
- X
- Chance of flooding over 30 yrs
- 0.0%
- Est. flood insurance / yr
- $507 – $1,088
Fire risk 1/10 · Minimal
- Est. fire insurance / yr
- $804 – $1,492
Heat risk 3/10 · Minor
- Hot days now (above 104°F)
- 7 days/yr
- Hot days in 30 yrs
- 18 days/yr
Wind risk 2/10 · Minimal
- Chance of severe wind over 30 yrs
- 1.0%
Air-quality risk 3/10 · Minor
- Unhealthy air days now
- 1 days/yr
- Unhealthy air days in 30 yrs
- 3 days/yr
Risk factors via First Street. Map © Google.
Why this score? — see what drove the C- grade
The composite is a weighted blend of 9 inputs, each scored 0–100. Each bar is that input's sub-score; the figure is the points it added to the 100-point composite (weight × sub-score).
- Cash flow +19.5/30.0
- 1% rule +7.5/10.0
- ARV discount +7.5/15.0
- DSCR +6.2/10.0
- Livability +3.7/5.0
- Rent growth +3.1/5.0
- Schools +2.9/10.0
- Condition / age +2.5/5.0
- Appreciation +0.0/10.0
$90,000
🖨 Deal sheet 📄 Offer letter ✓ Due diligence
Listing remarks
Welcome to 3544 W Richwoods Blvd, Unit 23 — a charming 2-bedroom, 1.5-bath condo offering comfortable living and practical convenience. Step inside to a spacious living room filled with bright natural light, creating a warm and inviting space to relax or entertain. The adorable, functional kitchen provides an efficient layout and storage, while the sunny breakfast nook is perfect for morning coffee or casual dining. Upstairs, you’ll find two comfortable bedrooms, each featuring ceiling fans and ample closet space, along with a full bath featuring a new walk-in shower. The lower level includes a basement one-car garage, ideal for secure parking and additional storage. Washer and
Key facts
- $111 HOA
- Garage
- Built 1979
Property features AI
Finance
- HOA & community: Monthly association fee includes common area maintenance, landscaping, lawn care, grounds maintenance, road maintenance, snow removal and trash; Association fee listed
Exterior
- Parking: Attached garage with 1 parking space
- Utilities: Public water; Public sewer
- Home design: Condo/townhome with attached property; 3 stories; Built in 2024
- Construction: New construction: No
- Exterior features: Shingle roof; Level lot; Zero lot line
Interior
- Kitchen: Dishwasher; Refrigerator
- Bedrooms: 2 bedrooms (both on upper level)
- Flooring: Carpet in bedrooms; Hardwood in dining room and kitchen; Other flooring in basement
- Bathrooms: 1 full bathroom; 1 half bathroom
- Heating & cooling: Central air conditioning; Electric forced-air heating; Electric water heater
- Interior features: Ceiling fans
- Laundry & utility: Basement laundry room
Neighborhood map
What this means for you Summary
Snapshot
- This is a 2-bed/1.5-bath condo listed at $90k.
Deal economics
- At list price, monthly cash flow is $103 ($1k/yr) — positive.
- The deal already cash-flows at list — no discount required.
- Meets the 1% rule at list price ($1k rent vs $90k).
- Recommended offer: $87k (3.0% below list) — sets the bar for market timing.
- Cap rate 7.7% vs local median 5.6% in Peoria — top-decile yield for the area; either an underpriced asset or a hidden risk that comps aren't pricing in. Stress-test before assuming the spread holds.
Location & tenants
- Location reads 73/100 on livability (#270 in IL) — a middle-class / working-renter tenant base. Strengths: commute A+, cost of living A+, housing A+; Watch: employment D+, crime F.
- Limestone Chsd 310 (rural): math 25% / reading 35% proficiency, ranked #486 of 919 in IL (top 53%) — families likely to look elsewhere, expect single-tenant / working-renter base with shorter leases.
- Zoned schools: Limestone Community High School (math 17% / reading 22%, grade F, #397 of 693 statewide, top 61%, 924 students, 0% FRL).
- Market conditions: Rents rising (+2.3%/yr); 180 active listings in the ZIP; 11 comparable units currently listed for rent nearby; rentals leasing fast (median 14d on market — plan ~1-2 weeks tenant-placement turnaround); 73 units permitted in Peoria County in 2024 (0 in 5+ unit buildings).
Forward outlook
- Local home prices are declining (-3.0%/yr); year-one equity from $622 of loan paydown is wiped out by about $3k of value loss. Plan a longer hold.
- Peoria County population projected at -11% by 2050 — secular population decline; favor cash flow + early exit over multi-decade hold.
Negotiation context
- It's been on market 40 days — a 3% lower offer ($87k) is reasonable based on typical stale-listing flexibility.
- 2 sale attempts since 18y ago; this cycle's ask has dropped $10k (10%) from the opening price — seller is motivated, your offer sets the floor, not the list.
- Current owner paid $44k; list at $90k implies a 105% gain — meaningful room to come down on a strong offer.
Questions for the listing agent
- It's been on market 40 days. Have you received any prior offers? Is the seller open to a 3% concession, seller financing, or rate buy-down credit?
- Built in 1979 — when were the roof, HVAC, electrical panel, plumbing, and water heater last replaced?
- What does the HOA fee cover, when was the last increase, and are there any pending special assessments or reserve-fund shortfalls?
- Any open or pending special assessments — roof, HVAC, plumbing, elevator, façade? What's the per-unit balance and payoff schedule, and is the seller paying it off at close or rolling it to the buyer?
- Is there a deadline driving the sale (1031 exchange, divorce, estate, relocation)? That informs how much negotiation room exists.
- Schools are F-rated, which usually means shorter tenancies and higher turnover. Who's the typical renter profile here, and what's been the actual vacancy rate?
- Crime grade is F in this area — have there been break-ins, vandalism, or insurance claims at this property in the last 3 years? What carrier currently insures it and at what premium?
- What's the average days-on-market for RENTAL listings here right now (not sales)? A rising rental-DOM trend means longer vacancies and softer asking-rent achievability than the comps imply.
- What's the recent tenant-quality profile in this submarket — average credit score on applications, eviction rate, late-payment / NSF rate, and stable-employment percentage? A property-management company in the area should have these aggregated.
- How much new apartment / multifamily construction is in the pipeline within 1–3 miles? Heavy new supply (>2% of stock underway) typically softens rents 12–24 months out; light construction supports rent growth.
Investment metrics
- 1% rule
- 1.25% ✓
- Cap rate
- 7.66%
- Cash-on-cash
- 4.89%
- DSCR
- 1.22
- GRM
- 6.7
CMA / ARV
No comps found within radius.
Projected returns pro-forma
-3.0% appreciation · 2.3% rent growth · sell at horizon
- IRR
- -9.5%
- Equity multiple
- 0.65×
- Total profit
- $-8,713
- Equity at exit
- $13,419
- IRR
- -1.1%
- Equity multiple
- 0.93×
- Total profit
- $-1,872
- Equity at exit
- $7,782
Cash invested: $25,200 (down + closing). Projections, not guarantees.
Landlord ↔ Tenant lean methodology
- Overall (STATE)
- 43 Moderately Tenant-Leaning
- State Illinois
- 43 Moderately Tenant-Leaning · D+7
- County
- — inherits STATE
- City
- — inherits STATE
ZIP-level market 61604
- Home prices YoY
- -24.6%
- Rents YoY
- 2.3%
- Active inventory
- 180
- Price-to-rent
- 6.7×
Monthly cashflow live
- Estimated rent
- $1,127 high interval (Pro) →
- Mortgage (P&I)
- −$472
- Tax from tax record
- −$167 /mo · $2,002/yr
- Insurance
- −$38
- HOA
- −$111
- Vacancy / Maint / Mgmt
- −$237
- Net cashflow
- $103
Break-even live
UW: 25.0% down · 7.5% · 30yr · 1.5% tax · 5.0% vac · 8.0% maint · 8.0% mgmt
Financing live
Cash to close
- Down payment
- $22,500
- Closing costs
- $2,700
- Reserves months
- —
- Total cash needed
- —
Loan-product check · same deal, 3 products live
Conventional
25% down · 7.5% · 30yr
- Down + closing
- —
- Monthly P&I
- —
- Monthly cashflow
- —
- DSCR
- —
- Eligible?
- —
Personal DTI + credit; lowest rate.
DSCR
20% down · 8.5% · 30yr
- Down + closing
- —
- Monthly P&I
- —
- Monthly cashflow
- —
- DSCR
- —
- Eligible?
- —
No personal income docs; deal must DSCR.
Hard money
10% down · 12.0% · 12mo
- Down + closing
- —
- Monthly P&I
- —
- Monthly cashflow
- —
- DSCR
- —
- Eligible?
- —
Short-term bridge; refi at stabilization.
Rent comps 11 comps
| Address | Beds | Baths | Sqft | Rent | $/sqft | DOM | Units | Dist |
|---|---|---|---|---|---|---|---|---|
| 3438 W Villa Rdg Unit A Peoria, IL | 2.0 | 1.5 | 874 | $1,200 | $1.37 | 21d | 1 | 0.23mi |
| 3444 W Dorchester Rdg Peoria, IL | 2.0 | 2.0 | 1089 | $1,275 | $1.17 | 13d | 1 | 0.29mi |
| 3601 N Kingston Dr Peoria, IL | 2.0 | 2.0 | 1030 | $1,420 | $1.38 | 13d | 3 | 0.57mi |
| 2600 N Lavalle Ct Peoria, IL | 1.0–3.0 | 1.0–2.0 | 803 | $1,000 | $1.25 | 13d | 26 | 0.73mi |
| 2700 W Forrest Hill Ave Peoria, IL | 2.0 | 1.0 | 850 | $850 | $1.00 | 44d | 1 | 0.95mi |
| 2805 W Larchmont Ln Peoria, IL | 1.0–2.0 | 1.0 | 695 | $1,060 | $1.53 | 13d | 3 | 1.02mi |
| 2511 W Wardcliffe Dr Unit H Peoria, IL | 2.0 | 1.0 | 800 | $875 | $1.09 | 44d | 1 | 1.10mi |
| 2920 N Rockwood Dr Apt B Peoria, IL | 2.0 | 1.0 | 800 | $895 | $1.12 | 13d | 1 | 1.11mi |
| 2109 N Abbey Cir Peoria, IL | 3.0 | 2.0 | 1088 | $1,009 | $0.93 | 13d | 1 | 1.20mi |
| 3629 N Leroy Ave Unit A Peoria, IL | 2.0 | 1.0 | 1000 | $1,150 | $1.15 | 44d | 1 | 1.30mi |
| 2610 N Renwood Ave Peoria, IL | 2.0 | 1.0 | 904 | $1,300 | $1.44 | 13d | 1 | 1.33mi |
HOA detail condo
- Monthly dues
- $111 · $1,332/yr
- Assessments
- None detected in remarks — confirm with the listing agent.
Listing history 15 events
-
2026-06-01statusdays on market $90,000 Pending 40 DOM
-
2026-05-31days on market $90,000 Active 39 DOM
-
2026-05-30days on market $90,000 Active 38 DOM
-
2026-04-29price $90,000
-
2026-04-22$99,900 Active
-
2021-08-06historical
-
2021-08-06historical
-
2021-08-06historical
-
2021-08-06historical
-
2021-08-06historical
-
2020-10-14soldstatus $43,900
-
2011-03-08soldstatus $64,000
-
2009-06-04soldstatus $63,000
-
2009-06-02soldstatus $63,000
-
2008-11-24$64,900
ⓘ Source: listings_history table (triggers on properties + properties_extension) + one-shot
backfill from property_details.listing_events for pre-trigger history.
Tax reassessment forecast IL · Partial reset (capped growth)
- Current annual tax
- $2,002 · $167/mo
- Projected year-2 tax
- $2,022 · $169/mo
- Expected delta
- +$21/yr (+$2/mo · 1.0%)
ⓘ Screening estimate from a state-policy table — verify with the county assessor before closing.
Climate risk First Street
- Flood 1/10 Low FEMA zone X · 0% chance over 30 yrs
- Wildfire 1/10 Low
- Heat 3/10 Moderate 7 d/yr ≥104°F today · 18 d/yr by 30 yrs out
- Wind 2/10 Low 100% chance of damaging wind over 30 yrs
- Air quality 3/10 Moderate 1 unhealthy d/yr today · 3 by 30 yrs out
Nearby sold comps map
Loading sold comps map…
Walkable amenities ~0.75 mi
Loading nearby amenities…
Taxation est. · year 1
- Rental income
- $13,519
- − Mortgage interest
- −$5,041
- − Property taxes
- −$2,002
- − Insurance
- −$450
- − Repairs & maintenance
- −$1,081
- − Management
- −$1,081
- − HOA
- −$1,332
- − Depreciation
- −$2,618
- Taxable loss
- −$88
- Est. tax savings @ 24.0%
- +$21
- After-tax cash flow
- $1,253/yr
For passive investors: Depreciation is non-cash, so a rental often shows a tax loss while cash-flowing — sheltering income. Rental losses are passive: they offset passive income freely, and up to $25,000/yr can offset ordinary (W-2) income if you actively participate and your MAGI is under $100k (phasing out to $0 by $150k); unused losses carry forward. On sale, claimed depreciation is recaptured at up to 25%, and gains may owe capital-gains tax (a 1031 exchange can defer both). Figures are a year-1 estimate at your 24.0% rate — not tax advice; consult a CPA.
Schools (NCES district)
- District
- Limestone Chsd 310
- NCES district ID
- 1722950
- Math proficiency
- 25% ▲ 5.00%
- Reading proficiency
- 35% ▲ 4.00%
- Median HH income
- $49,759
- Composite
- 28.99/100
- National rank
- #11932
- State rank
- #486 of 919 in IL
Livability — Peoria
- Score
- 73/100
- State rank
- #270
- US rank
- #5096
Category grades
Schools grade is shown separately in the Schools card above.
Census & demographics
- Census place
- Peoria, IL
- County
- Peoria County · 120,495 people
- City population
- 114,670
- Metro
- Peoria, IL
- Population (ZIP)
- 28,313
- Household income
- $52,414
- Rent vs Own
- Severe rent burden
- 815.0
Population outlook (Peoria County) Hauer SSP2
- Today (2025)
- 183,007 people
- By 2030
- 179,643 · -1.8%
- By 2040
- 171,782 · -6.1%
- By 2050
- 163,508 · -10.7%
- By 2075
- 140,178 · -23.4%
- By 2100
- 114,493 · -37.4%
Race, ethnicity, and origin ACS 2023
- Neighborhood character
- Diverse neighborhood (Simpson 0.61)
- Race & ethnicity
- White 55% Black 29% Two or more races 10% Hispanic / Latino 7% Asian 2%
- Hispanic origin (detail)
- Mexican 5%
- Common ancestry
- Italian 2% Slovak 1% Iranian 1%
- Foreign-born
- 6% · Canada, China
- Languages at home
- 92% English-only · Spanish 4% Chinese 1% French/Haitian/Cajun 1%
Political lean MEDSL · Peoria
- 2024 margin
- Toss-up / Even · D 51.5% · R 46.9% · Other 1.6%
- 2008→2024 swing
- -9.2pp toward R · 2008: 13.9pp · 2024: 4.7pp
- All cycles
- 2024: D+4.7 2020: D+6.3 2016: D+2.8 2012: D+4.4 2008: D+13.9
Not yet ingested
- Civics
- —
Market trends
- HPI YoY
- ▼ -54.15%
- Current HPI
- 165.8838
- Rent YoY
- ▲ 2.30%
- Metro
- Peoria, IL
- State GDP YoY
- ▲ 1.59%
- F500 in state
- 60
Industry mix (Fortune 500 HQ in IL)
| Industry | F500 HQs | Revenue |
|---|---|---|
| Insurance | 4 | $201B |
|
||
| Consumer Goods | 4 | $87B |
|
||
| Industrial Machinery | 3 | $64B |
|
||
| Healthcare | 2 | $55B |
|
||
| Retail / Pharmacy | 1 | $148B |
|
||
| Agriculture / Food | 1 | $86B |
|
||
Price history
+38.7% since first listed12 events — show timeline
- 2026-04-29 Price Changed $90,000 RMLSA as Distributed by MLS Grid
- 2026-04-22 Listed $99,900 RMLSA as Distributed by MLS Grid
- 2021-08-06 Listing Removed — RMLSA as Distributed by MLS Grid
- 2021-08-06 Listing Removed — RMLSA as Distributed by MLS Grid
- 2021-08-06 Listing Removed — RMLSA as Distributed by MLS Grid
- 2021-08-06 Listing Removed — RMLSA as Distributed by MLS Grid
- 2021-08-06 Listing Removed — RMLSA as Distributed by MLS Grid
- 2020-10-14 Sold (Public Records) $43,900 Public Records
- 2011-03-08 Sold (Public Records) $64,000 Public Records
- 2009-06-04 Sold (Public Records) $63,000 Public Records
- 2009-06-02 Sold (MLS) $63,000 RMLSA as Distributed by MLS Grid
- 2008-11-24 Listed $64,900 RMLSA as Distributed by MLS Grid
Property tax history
+4.1%/yrLatest (2024): $2,002 · +7.2% YoY. Source: county tax records.
Cash-flow waterfall
monthlySold comps — $/sqft
last 12 mo · ≤1 miLoading sold comps…