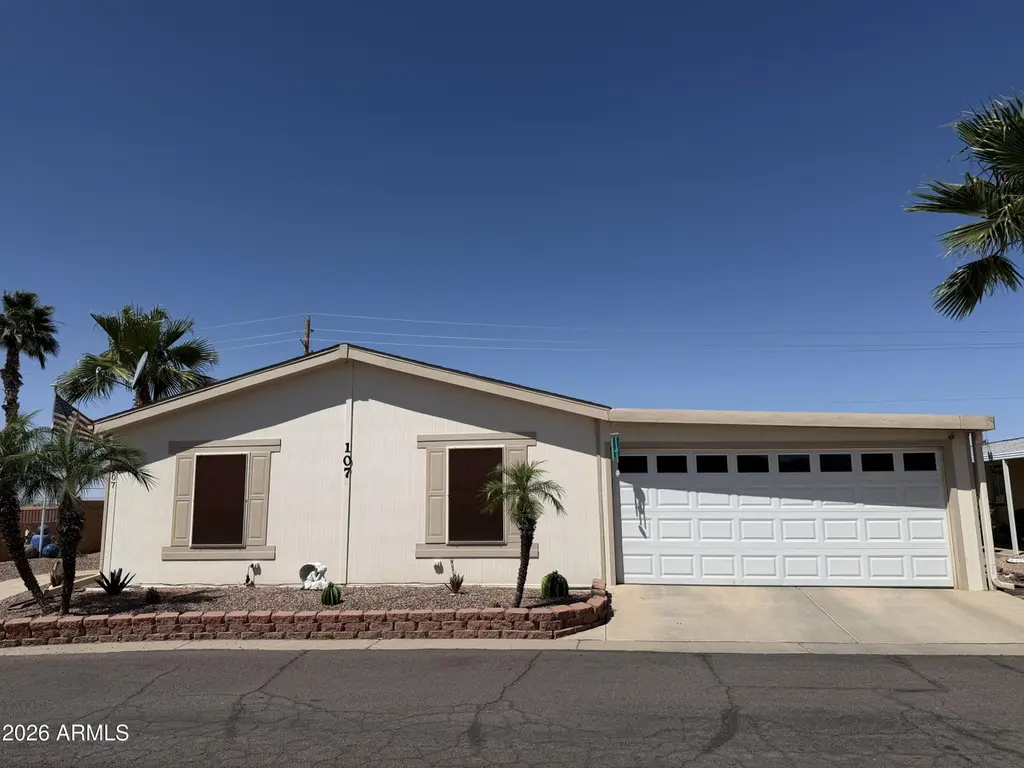
2208 W Baseline Ave #107 · Apache Junction, AZ
Flood risk 1/10 · Minimal
- FEMA flood zone
- X (unshaded)
- Chance of flooding over 30 yrs
- 0.0%
- Est. flood insurance / yr
- $507 – $1,088
Fire risk 5/10 · Moderate
- Est. fire insurance / yr
- $610 – $1,132
Heat risk 9/10 · Severe
- Hot days now (above 111°F)
- 6 days/yr
- Hot days in 30 yrs
- 14 days/yr
Wind risk 1/10 · Minimal
- Chance of severe wind over 30 yrs
- —
Air-quality risk 3/10 · Minor
- Unhealthy air days now
- 2 days/yr
- Unhealthy air days in 30 yrs
- 3 days/yr
Risk factors via First Street. Map © Google.
Why this score? — see what drove the C- grade
The composite is a weighted blend of 9 inputs, each scored 0–100. Each bar is that input's sub-score; the figure is the points it added to the 100-point composite (weight × sub-score).
- Cash flow +26.3/30.0
- DSCR +8.9/10.0
- 1% rule +7.0/10.0
- Condition / age +3.8/5.0
- Livability +3.3/5.0
- Rent growth +1.6/5.0
- Schools +1.5/10.0
- ARV discount +0.0/15.0
- Appreciation +0.0/10.0
$197,500
🖨 Deal sheet 📄 Offer letter ✓ Due diligence
Listing remarks
Spacious living meets exceptional amenities in this beautifully situated home on a huge corner lot! This fully furnished ground-set residence offers nearly 1,900 square feet of thoughtfully designed living space, featuring 3 bedrooms and 2 bathrooms . The oversized primary suite includes a massive walk-in closet and a large en-suite bathroom complete with a convenient linen closet. The second bedroom is impressively sized--nearly double a standard room--perfect for guests, hobbies, or a shared space. Enjoy versatile living with two separate family rooms, a formal dining area, and an eat-in kitchen equipped with abundant cabinetry and a functional island--ideal for everyday living and entert
Key facts
- Huge corner lot
- Eat-in kitchen
- En-suite bathroom
Tags
Property features AI
Finance
- Other: Heated spa; Building area sourced from builder; Lot size sourced from assessor
- HOA & community: Land lease (monthly $891); No association fees listed; Gated community with pool and community spa; Fitness center; Biking/walking path
Exterior
- Parking: Covered parking for 4; 4-car garage with direct access and attached garage cabinets
- Security: Owned security system
- Utilities: City water; Public sewer
- Home design: Manufactured / mobile home; Leasehold ownership
- Construction: Wood frame construction; Painted exterior; Composition roof
- Exterior features: Misting system; Corner lot; Gravel/stone front and back; Private maintained road; Mountain views
Interior
- Kitchen: Built-in microwave; Kitchen island; Laminate counters; Refrigerator; Dishwasher; Garbage disposal
- Bedrooms: 3 possible bedrooms
- Flooring: Carpet; Tile
- Bathrooms: 2 full bathrooms
- Heating & cooling: Heat pump; Central air; Ceiling fans
- Interior features: Double vanity; Eat-in kitchen; Furnished (see remarks); Vaulted ceilings; Kitchen island; 3/4 bath in primary bedroom; Laminate counters
- Laundry & utility: Indoor laundry
Neighborhood map
What this means for you Summary
Snapshot
- This is a 3-bed/2.0-bath manufactured listed at $198k. Condition is rated good.
Deal economics
- At list price, monthly cash flow is $508 ($6k/yr) — positive.
- The deal already cash-flows at list — no discount required.
- Meets the 1% rule at list price ($2k rent vs $198k).
- Recommended offer: $192k (3.0% below list) — sets the bar for market timing.
- Cap rate 9.4% vs local median 3.5% in Apache Junction — top-decile yield for the area; either an underpriced asset or a hidden risk that comps aren't pricing in. Stress-test before assuming the spread holds.
Location & tenants
- Location reads 66/100 on livability (#70 in AZ) — a middle-class / working-renter tenant base. Strengths: cost of living A+, housing A+; Watch: crime D+, schools F, amenities F.
- Apache Junction Unified District (4443) (suburban): math 15% / reading 20% proficiency, ranked #195 of 249 in AZ (top 78%) — low school quality limits family demand, transient renter base, plan for 1-2y turnover.
- Market conditions: Rents falling (-3.5%/yr); 455 active listings in the ZIP; 7 comparable units currently listed for rent nearby; rentals at typical pace (median 18d on market — plan ~3-4 weeks tenant-placement turnaround); 9,504 units permitted in Pinal County in 2024 (776 in 5+ unit buildings).
- At $2,370/mo this rent would consume 49% of the median local household income ($58k/yr) (locally 686% of renters already pay >50% of income on rent) — very limited rent-growth headroom before tenants either downsize or default.
Forward outlook
- Local home prices are declining (-3.0%/yr); year-one equity from $1k of loan paydown is wiped out by about $6k of value loss. Plan a longer hold.
Negotiation context
- It's been on market 46 days — a 3% lower offer ($192k) is reasonable based on typical stale-listing flexibility.
- 3 sale attempts since 4y ago with the ask held roughly flat each time — persistent listings suggest the price (not the market) is what's stuck; bring a comps-based counter.
Risks & watch-outs
- Climate carrying-cost: moderate wildfire risk; extreme-heat days projected 6→14/yr by 2055 (HVAC capex compounding) — expect insurance premiums to compound above CPI over the hold.
Questions for the listing agent
- It's been on market 46 days. Have you received any prior offers? Is the seller open to a 3% concession, seller financing, or rate buy-down credit?
- Is there a deadline driving the sale (1031 exchange, divorce, estate, relocation)? That informs how much negotiation room exists.
- Schools are F-rated, which usually means shorter tenancies and higher turnover. Who's the typical renter profile here, and what's been the actual vacancy rate?
- Crime grade is D in this area — have there been break-ins, vandalism, or insurance claims at this property in the last 3 years? What carrier currently insures it and at what premium?
- What's the average days-on-market for RENTAL listings here right now (not sales)? A rising rental-DOM trend means longer vacancies and softer asking-rent achievability than the comps imply.
- What's the recent tenant-quality profile in this submarket — average credit score on applications, eviction rate, late-payment / NSF rate, and stable-employment percentage? A property-management company in the area should have these aggregated.
- How much new for-sale + rental construction is in the pipeline within 1–3 miles? Heavy new supply typically softens prices + rents 12–24 months out; constrained supply supports both.
Investment metrics
- 1% rule
- 1.20% ✓
- Cap rate
- 9.38%
- Cash-on-cash
- 11.01%
- DSCR
- 1.49
- GRM
- 6.9
CMA / ARV
- ARV (on-the-fly)
- $136,656
- Comps found
- 3
Show comp detail 3 sales within ~0.75 mi
| Address | Dist | Beds/Ba | Sqft | Sold | Price | $/sf | Match |
|---|---|---|---|---|---|---|---|
| 2208 W Baseline Ave #171 | 0.15mi | 3/2.0 | 1,904 (+2%) | 8mo | $94,500 | $50 | 84 |
| 2208 W Baseline Ave #94 | 0.00mi | 2/2.0 (-1) | 1,680 (-10%) | 9mo | $122,500 | $73 | 71 |
| 2208 W Baseline Ave #21 | 0.00mi | 3/2.0 | 1,680 (-10%) | 15mo | $154,900 | $92 | 71 |
Match score weights: distance 35% · size 25% · config 20% · recency 20%. Top-matched comps best support the ARV.
Projected returns pro-forma
-3.0% appreciation · 0.0% rent growth · sell at horizon
- IRR
- -3.3%
- Equity multiple
- 0.88×
- Total profit
- $-6,584
- Equity at exit
- $29,448
- IRR
- 2.7%
- Equity multiple
- 1.17×
- Total profit
- $9,197
- Equity at exit
- $17,076
Cash invested: $55,300 (down + closing). Projections, not guarantees.
Landlord ↔ Tenant lean methodology
- Overall (STATE)
- 87 Strongly Landlord-Friendly
- State Arizona
- 87 Strongly Landlord-Friendly · R+3
- County
- — inherits STATE
- City
- — inherits STATE
ZIP-level market 85120
- Home prices YoY
- -29.0%
- Rents YoY
- -3.5%
- Active inventory
- 455
- Price-to-rent
- 6.9×
Monthly cashflow live
- Estimated rent
- $2,370 high interval (Pro) →
- Mortgage (P&I)
- −$1,036
- Tax est. 1.5%
- −$247 /mo · $2,962/yr
- Insurance
- −$82
- HOA
- −$0
- Vacancy / Maint / Mgmt
- −$498
- Net cashflow
- $508
Break-even live
UW: 25.0% down · 7.5% · 30yr · 1.5% tax · 5.0% vac · 8.0% maint · 8.0% mgmt
Financing live
Cash to close
- Down payment
- $49,375
- Closing costs
- $5,925
- Reserves months
- —
- Total cash needed
- —
Loan-product check · same deal, 3 products live
Conventional
25% down · 7.5% · 30yr
- Down + closing
- —
- Monthly P&I
- —
- Monthly cashflow
- —
- DSCR
- —
- Eligible?
- —
Personal DTI + credit; lowest rate.
DSCR
20% down · 8.5% · 30yr
- Down + closing
- —
- Monthly P&I
- —
- Monthly cashflow
- —
- DSCR
- —
- Eligible?
- —
No personal income docs; deal must DSCR.
Hard money
10% down · 12.0% · 12mo
- Down + closing
- —
- Monthly P&I
- —
- Monthly cashflow
- —
- DSCR
- —
- Eligible?
- —
Short-term bridge; refi at stabilization.
Rent comps 7 comps
| Address | Beds | Baths | Sqft | Rent | $/sqft | DOM | Units | Dist |
|---|---|---|---|---|---|---|---|---|
| 3668 S Warner Dr Apache Junction, AZ | 4.0 | 3.0 | 2264 | $2,550 | $1.13 | 24d | 1 | 0.29mi |
| 2611 W Gypsum Ave Apache Junction, AZ | 2.0 | 2.5 | 2001 | $2,235 | $1.12 | 2d | 1 | 0.35mi |
| 3454 S Warner Dr Apache Junction, AZ | 3.0 | 2.0 | 1300 | $2,500 | $1.92 | 24d | 1 | 0.46mi |
| 2101 S Yellow Wood #60 Mesa, AZ | 2.0 | 2.0 | 1371 | $2,600 | $1.90 | 1d | 1 | 0.93mi |
| 11401 E Medina Ave Mesa, AZ | 3.0 | 2.0 | 1986 | $2,600 | $1.31 | 17d | 1 | 1.18mi |
| 2043 S Thunderbird Dr Apache Junction, AZ | 3.0 | 2.0 | 1348 | $1,925 | $1.43 | 24d | 1 | 1.34mi |
| 650 W 22nd Ave Apache Junction, AZ | 4.0 | 2.0 | 1564 | $2,635 | $1.68 | 5d | 1 | 1.50mi |
Listing history 18 events
-
2026-06-18days on market $197,500 Active 46 DOM
-
2026-06-17days on market $197,500 Active 45 DOM
-
2026-06-16days on market $197,500 Active 44 DOM
-
2026-06-15days on market $197,500 Active 43 DOM
-
2026-06-13days on market $197,500 Active 41 DOM
-
2026-06-09days on market $197,500 Active 37 DOM
-
2026-06-08days on market $197,500 Active 36 DOM
-
2026-06-07days on market $197,500 Active 35 DOM
-
2026-06-04days on market $197,500 Active 32 DOM
-
2026-06-03days on market $197,500 Active 31 DOM
-
2026-06-02days on market $197,500 Active 30 DOM
-
2026-06-01days on market $197,500 Active 29 DOM
-
2026-05-31days on market $197,500 Active 28 DOM
-
2026-05-11status Active
-
2026-04-27status Pending
-
2026-04-19$197,500 Active
-
2022-12-31historical
-
2022-08-07$297,500 Active
ⓘ Source: listings_history table (triggers on properties + properties_extension) + one-shot
backfill from property_details.listing_events for pre-trigger history.
Climate risk First Street
- Flood 1/10 Low FEMA zone X (unshaded) · 0% chance over 30 yrs
- Wildfire 5/10 Major
- Heat 9/10 Extreme 6 d/yr ≥111°F today · 14 d/yr by 30 yrs out
- Wind 1/10 Low
- Air quality 3/10 Moderate 2 unhealthy d/yr today · 3 by 30 yrs out
Nearby sold comps map
Loading sold comps map…
Walkable amenities ~0.75 mi
Loading nearby amenities…
Taxation est. · year 1
- Rental income
- $28,443
- − Mortgage interest
- −$11,063
- − Property taxes
- −$2,962
- − Insurance
- −$988
- − Repairs & maintenance
- −$2,275
- − Management
- −$2,275
- − Depreciation
- −$5,745
- Taxable income
- $3,133
- Est. tax owed @ 24.0%
- −$752
- After-tax cash flow
- $5,339/yr
For passive investors: Depreciation is non-cash, so a rental often shows a tax loss while cash-flowing — sheltering income. Rental losses are passive: they offset passive income freely, and up to $25,000/yr can offset ordinary (W-2) income if you actively participate and your MAGI is under $100k (phasing out to $0 by $150k); unused losses carry forward. On sale, claimed depreciation is recaptured at up to 25%, and gains may owe capital-gains tax (a 1031 exchange can defer both). Figures are a year-1 estimate at your 24.0% rate — not tax advice; consult a CPA.
Condition & rehab AI · 13 photos
This well-maintained, fully furnished home on a corner lot offers a good condition with minimal repairs needed. It's ready for immediate move-in and would benefit from a fresh coat of paint and landscaping to further enhance its curb appeal and value.
Value-add opportunities
- Both paint exterior — enhances curb appeal and value
- Both landscaping — improves curb appeal and rental value
- Both HVAC maintenance — improves comfort and energy efficiency
Renovation cost estimate screening
Value-add ROI direction
- Both paint exterior — enhances curb appeal and value ↑
- Both landscaping — improves curb appeal and rental value ↑
- Both HVAC maintenance — improves comfort and energy efficiency ↑
ⓘ Cost ranges are severity-bucket heuristics (US national rule-of-thumb). Get contractor quotes + a written scope before underwriting a rehab budget.
Schools (NCES district)
- District
- Apache Junction Unified District (4443)
- NCES district ID
- 0400790
- Math proficiency
- 15% ▼ -17.00%
- Reading proficiency
- 20% ▼ -13.00%
- Median HH income
- $44,930
- Composite
- 15.34/100
- National rank
- #9325
- State rank
- #195 of 249 in AZ
Livability — Apache Junction
- Score
- 66/100
- State rank
- #70
- US rank
- #11242
Category grades
Schools grade is shown separately in the Schools card above.
Census & demographics
- Census place
- Apache Junction, AZ
- County
- Pinal County · 399,947 people
- City population
- 56,611
- Metro
- Phoenix-Mesa-Chandler, AZ
- Population (ZIP)
- 31,191
- Household income
- $57,786
- Rent vs Own
- Severe rent burden
- 686.0
Population outlook (Pinal County) Hauer SSP2
- Today (2025)
- 437,574 people
- By 2030
- 446,903 · +2.1%
- By 2040
- 452,589 · +3.4%
- By 2050
- 444,126 · +1.5%
- By 2075
- 430,300 · -1.7%
- By 2100
- 393,536 · -10.1%
Race, ethnicity, and origin ACS 2023
- Neighborhood character
- Predominantly White (77%)
- Race & ethnicity
- White 77% Hispanic / Latino 16% Two or more races 10% Asian 1%
- Hispanic origin (detail)
- Mexican 13%
- Common ancestry
- Romanian 3% Lithuanian 3% Portuguese 3%
- Foreign-born
- 7% · Canada
- Languages at home
- 89% English-only · Spanish 8% Tagalog/Filipino 1%
Political lean MEDSL · Pinal
- 2024 margin
- Strong R (+22.1) · D 38.5% · R 60.6%
- 2008→2024 swing
- -7.6pp toward R · 2008: -14.5pp · 2024: -22.1pp
- All cycles
- 2024: R+22.1 2020: R+17.3 2016: R+19.3 2012: R+17.1 2008: R+14.5
Not yet ingested
- Civics
- —
Market trends
- HPI YoY
- ▼ -128.31%
- Current HPI
- 313.4666
- Rent YoY
- ▼ -3.50%
- Metro
- Phoenix-Mesa-Chandler, AZ
- State GDP YoY
- ▲ 4.54%
- F500 in state
- 20
Industry mix (Fortune 500 HQ in AZ)
| Industry | F500 HQs | Revenue |
|---|---|---|
| Technology | 2 | $13B |
|
||
| Mining / Metals | 1 | $23B |
|
||
| Environmental Services | 1 | $16B |
|
||
| Metals / Steel | 1 | $14B |
|
||
| Technology Distribution | 1 | $9B |
|
||
| Homebuilding | 1 | $8B |
|
||
Price history
-33.6% since first listed5 events — show timeline
- 2026-05-11 Relisted — ARMLS
- 2026-04-27 Pending — ARMLS
- 2026-04-19 Listed $197,500 ARMLS
- 2022-12-31 Listing Removed — ARMLS
- 2022-08-07 Listed $297,500 ARMLS
Cash-flow waterfall
monthlySold comps — $/sqft
last 12 mo · ≤1 miLoading sold comps…