 🏗️ New Construction
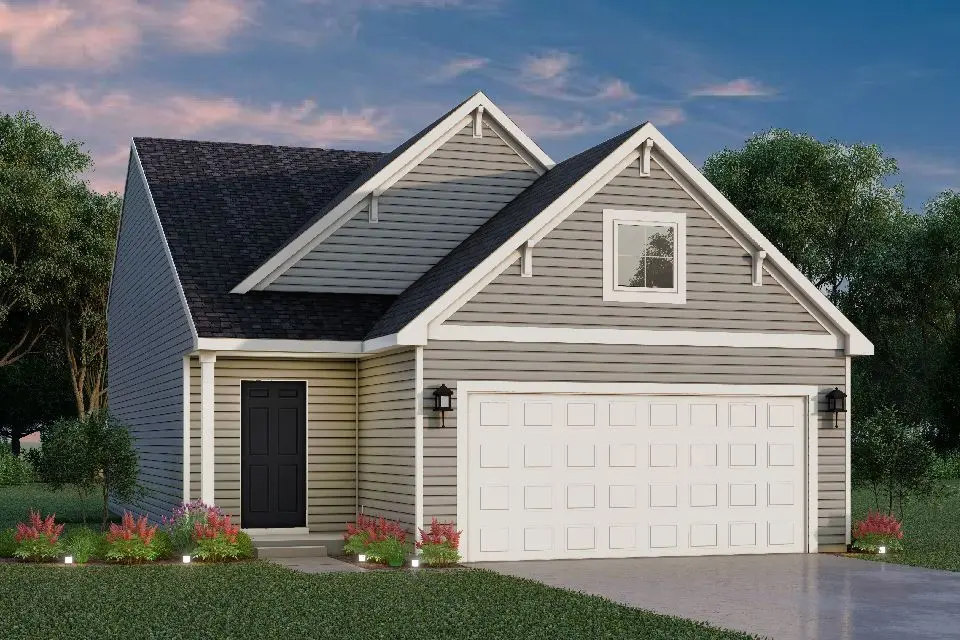
Integrity 1800 Plan · Portage, MI
Flood risk No data
- FEMA flood zone
- —
- Chance of flooding over 30 yrs
- —
- Est. flood insurance / yr
- —
Fire risk No data
- Est. fire insurance / yr
- —
Heat risk No data
- Hot days now (above threshold)
- —
- Hot days in 30 yrs
- —
Wind risk No data
- Chance of severe wind over 30 yrs
- —
Air-quality risk No data
- Unhealthy air days now
- —
- Unhealthy air days in 30 yrs
- —
Risk factors via First Street. Map © Google.
Why this score? — see what drove the F grade
The composite is a weighted blend of 9 inputs, each scored 0–100. Each bar is that input's sub-score; the figure is the points it added to the 100-point composite (weight × sub-score).
- ARV discount +7.5/15.0
- Cash flow +6.6/30.0
- Schools +4.8/10.0
- Rent growth +4.1/5.0
- Livability +4.0/5.0
- Condition / age +2.5/5.0
- 1% rule +1.7/10.0
- DSCR +0.8/10.0
- Appreciation +0.0/10.0
$296,630
🖨 Deal sheet 📄 Offer letter ✓ Due diligence
Listing remarks MLS
The Integrity 1800 is a traditional split-level floor plan with a footprint designed for optimal and inclusive living & storage.
Key facts
- 2 garage spots
- Listed 392 days
Neighborhood map
What this means for you Summary
Snapshot
- This is a 3-bed/2.5-bath single-family listed at $297k.
Deal economics
- At list price, monthly cash flow is $-558 ($-7k/yr) — negative.
- To cash-flow at today's rent, offer at most $257k (13.4% below list).
- To meet the 1% rule (rent ≥ 1% of price), the offer needs to be $225k (24.3% below list).
- Recommended offer: $225k (24.3% below list) — sets the bar for 1% rule.
- Cap rate 4.3% vs local median 3.3% in Portage — meaningfully above typical; check what's discounted (condition, days-on-market, listing class) to confirm the premium yield is real.
Location & tenants
- Location reads 79/100 on livability (#90 in MI, #2,044 nationally) — a middle-class / working-renter tenant base. Strengths: cost of living A+, housing A+, health & safety A+; Watch: crime D+, amenities D-, commute F.
- Portage Public Schools (urban): math 48% / reading 63% proficiency, ranked #67 of 540 in MI (top 12%) — acceptable for families but not a draw, mixed tenant base, ~2y average lease.
- Market conditions: Rents rising fast (+6.4%/yr); 185 active listings in the ZIP; 2 comparable units currently listed for rent nearby; solid renter incomes; 339 units permitted in Kalamazoo County in 2024 (22 in 5+ unit buildings).
Forward outlook
- Local home prices are declining (-3.0%/yr); year-one equity from $2k of loan paydown is wiped out by about $10k of value loss. Plan a longer hold.
- Kalamazoo County population projected at +18% by 2050 — long-run rental-demand tailwind backs the buy-and-hold thesis.
Negotiation context
- It's been on market 392 days — a 12% lower offer ($261k) is reasonable based on typical stale-listing flexibility.
Questions for the listing agent
- What do current leases actually rent for vs. the listed asking? Can we see a recent rent roll and the last 12 months of T-12 income?
- It's been on market 392 days. Have you received any prior offers? Is the seller open to a 24% concession, seller financing, or rate buy-down credit?
- Why hasn't it sold? Are there any deal-killer items the seller is aware of (foundation, flood, title, zoning, code violations)?
- Is there a deadline driving the sale (1031 exchange, divorce, estate, relocation)? That informs how much negotiation room exists.
- Schools are A-rated — typically a magnet for longer-tenancy family renters. What's the average tenant stay here, and is there a school-zone premium baked into asking?
- Crime grade is D in this area — have there been break-ins, vandalism, or insurance claims at this property in the last 3 years? What carrier currently insures it and at what premium?
- The area grade is low — what's the realistic commute time and amenity access for the typical tenant pool here? Any planned neighborhood developments (good or bad) we should know about?
- What's the average days-on-market for RENTAL listings here right now (not sales)? A rising rental-DOM trend means longer vacancies and softer asking-rent achievability than the comps imply.
- What's the recent tenant-quality profile in this submarket — average credit score on applications, eviction rate, late-payment / NSF rate, and stable-employment percentage? A property-management company in the area should have these aggregated.
- How much new for-sale + rental construction is in the pipeline within 1–3 miles? Heavy new supply typically softens prices + rents 12–24 months out; constrained supply supports both.
Investment metrics
- 1% rule
- 0.67% ✗
- Cap rate
- 4.31%
- Cash-on-cash
- -7.09%
- DSCR
- 0.68
- GRM
- 12.5
CMA / ARV
- ARV (median comp)
- $337,615
- List price
- $296,630
- Delta
- -12.14%
- Verdict
- UNDERPRICED
- Comps
- 20 within 1.0 mi
Show comp detail 12 sales within ~0.75 mi
| Address | Dist | Beds/Ba | Sqft | Sold | Price | $/sf | Match |
|---|---|---|---|---|---|---|---|
| 10029 Kearns Ct | 0.06mi | 3/2.5 | 1,796 (-0%) | 2mo | $275,935 | $154 | 95 |
| 10126 Pennridge Trl | 0.04mi | 3/2.5 | 1,798 (0%) | 8mo | $284,750 | $158 | 92 |
| 10170 Pennridge Dr | 0.03mi | 3/2.5 | 1,798 (0%) | 8mo | $299,900 | $167 | 92 |
| 10117 Pennridge Dr | 0.05mi | 3/2.5 | 1,798 (0%) | 9mo | $310,050 | $172 | 90 |
| 10025 Kearns Ct | 0.06mi | 4/2.5 (+1) | 1,910 (+6%) | 1mo | $319,900 | $167 | 81 |
| 10187 Pennridge Dr | 0.03mi | 4/2.5 (+1) | 1,910 (+6%) | 6mo | $337,900 | $177 | 78 |
| 10160 Pennridge Dr | 0.03mi | 4/2.5 (+1) | 1,910 (+6%) | 7mo | $331,395 | $174 | 77 |
| 10207 Pennridge Dr | 0.05mi | 4/2.5 (+1) | 1,910 (+6%) | 9mo | $330,050 | $173 | 74 |
| 2586 Ashford Trl | 0.59mi | 3/2.0 | 1,811 (+1%) | 3mo | $540,000 | $298 | 67 |
| 10382 Pennridge St | 0.22mi | 3/2.0 | 2,060 (+15%) | 2mo | $313,800 | $152 | 62 |
| 2311 Ashford Trl | 0.47mi | 4/3.0 (+1) | 1,998 (+11%) | 2mo | $380,000 | $190 | 51 |
| 2229 W Osterhout Ave | 0.46mi | 2/2.5 (-1) | 2,016 (+12%) | 4mo | $240,000 | $119 | 50 |
Match score weights: distance 35% · size 25% · config 20% · recency 20%. Top-matched comps best support the ARV.
Projected returns pro-forma
-3.0% appreciation · 6.36% rent growth · sell at horizon
- IRR
- -25.0%
- Equity multiple
- 0.13×
- Total profit
- $-82,379
- Equity at exit
- $50,339
- IRR
- -13.2%
- Equity multiple
- 0.12×
- Total profit
- $-82,857
- Equity at exit
- $29,191
Cash invested: $94,532 (down + closing). Projections, not guarantees.
Landlord ↔ Tenant lean methodology
- Overall (STATE)
- 62 Landlord-Friendly
- State Michigan
- 62 Landlord-Friendly · EVEN
- County
- — inherits STATE
- City
- — inherits STATE
ZIP-level market 49024
- Rents YoY
- 6.4%
- Active inventory
- 185
- Price-to-rent
- 11.0×
Monthly cashflow live
- Estimated rent
- $2,247 medium interval (Pro) →
- Mortgage (P&I)
- −$1,770
- Tax est. 1.5%
- −$422 /mo · $5,064/yr
- Insurance
- −$141
- HOA
- −$0
- Vacancy / Maint / Mgmt
- −$472
- Net cashflow
- $-558
Break-even live
UW: 25.0% down · 7.5% · 30yr · 1.5% tax · 5.0% vac · 8.0% maint · 8.0% mgmt
Financing live
Cash to close
- Down payment
- $84,404
- Closing costs
- $10,128
- Reserves months
- —
- Total cash needed
- —
Loan-product check · same deal, 3 products live
Conventional
25% down · 7.5% · 30yr
- Down + closing
- —
- Monthly P&I
- —
- Monthly cashflow
- —
- DSCR
- —
- Eligible?
- —
Personal DTI + credit; lowest rate.
DSCR
20% down · 8.5% · 30yr
- Down + closing
- —
- Monthly P&I
- —
- Monthly cashflow
- —
- DSCR
- —
- Eligible?
- —
No personal income docs; deal must DSCR.
Hard money
10% down · 12.0% · 12mo
- Down + closing
- —
- Monthly P&I
- —
- Monthly cashflow
- —
- DSCR
- —
- Eligible?
- —
Short-term bridge; refi at stabilization.
Rent comps 2 comps
| Address | Beds | Baths | Sqft | Rent | $/sqft | DOM | Units | Dist |
|---|---|---|---|---|---|---|---|---|
| 10240 Pennridge Dr Portage, MI | 3.0 | 2.0 | 1530 | $2,395 | $1.57 | 43d | 1 | 0.11mi |
| 10328 Pennridge Dr Portage, MI | 3.0 | 2.0 | 1530 | $2,295 | $1.50 | 43d | 1 | 0.20mi |
Listing history 19 events
-
2026-06-18days on market $296,630 Active 392 DOM
-
2026-06-17days on market $296,630 Active 391 DOM
-
2026-06-16days on market $296,630 Active 390 DOM
-
2026-06-15days on market $296,630 Active 389 DOM
-
2026-06-14days on market $296,630 Active 387 DOM
-
2026-06-13days on market $296,630 Active 386 DOM
-
2026-06-10days on market $296,630 Active 384 DOM
-
2026-06-09days on market $296,630 Active 383 DOM
-
2026-06-08days on market $296,630 Active 382 DOM
-
2026-06-07days on market $296,630 Active 381 DOM
-
2026-06-05days on market $296,630 Active 378 DOM
-
2026-06-03days on market $296,630 Active 377 DOM
-
2026-06-02days on market $296,630 Active 376 DOM
-
2026-06-01days on market $296,630 Active 375 DOM
-
2026-05-31days on market $296,630 Active 374 DOM
-
2026-05-30days on market $296,630 Active 373 DOM
-
2026-03-10price $296,630 134-char remark
Show marketing remark (134 chars)
The Integrity 1800 is a traditional split-level floor plan with a footprint designed for optimal and inclusive living & storage.
-
2025-09-04price $291,630 134-char remark
Show marketing remark (134 chars)
The Integrity 1800 is a traditional split-level floor plan with a footprint designed for optimal and inclusive living & storage.
-
2025-05-23$277,975 Active 134-char remark
Show marketing remark (134 chars)
The Integrity 1800 is a traditional split-level floor plan with a footprint designed for optimal and inclusive living & storage.
ⓘ Source: listings_history table (triggers on properties + properties_extension) + one-shot
backfill from property_details.listing_events for pre-trigger history.
Nearby sold comps map
Loading sold comps map…
Walkable amenities ~0.75 mi
Loading nearby amenities…
Taxation est. · year 1
- Rental income
- $26,961
- − Mortgage interest
- −$18,912
- − Property taxes
- −$5,064
- − Insurance
- −$1,688
- − Repairs & maintenance
- −$2,157
- − Management
- −$2,157
- − Depreciation
- −$9,822
- Taxable loss
- −$12,838
- Est. tax savings @ 24.0%
- +$3,081
- After-tax cash flow
- $-3,618/yr
For passive investors: Depreciation is non-cash, so a rental often shows a tax loss while cash-flowing — sheltering income. Rental losses are passive: they offset passive income freely, and up to $25,000/yr can offset ordinary (W-2) income if you actively participate and your MAGI is under $100k (phasing out to $0 by $150k); unused losses carry forward. On sale, claimed depreciation is recaptured at up to 25%, and gains may owe capital-gains tax (a 1031 exchange can defer both). Figures are a year-1 estimate at your 24.0% rate — not tax advice; consult a CPA.
Schools (NCES district)
- District
- Portage Public Schools
- NCES district ID
- 2628950
- Math proficiency
- 48% ▼ -9.00%
- Reading proficiency
- 63% ▼ -2.00%
- Median HH income
- $61,322
- Composite
- 48.37/100
- National rank
- #2142
- State rank
- #67 of 540 in MI
Livability — Portage
- Score
- 79/100
- State rank
- #90
- US rank
- #2044
Category grades
Schools grade is shown separately in the Schools card above.
Census & demographics
- Census place
- Portage, MI
- County
- Kalamazoo County · 224,317 people
- City population
- 50,560
- Metro
- Kalamazoo-Portage, MI
- Population (ZIP)
- 30,823
- Household income
- $91,105
- Rent vs Own
- Severe rent burden
- 698.0
Population outlook (Kalamazoo County) Hauer SSP2
- Today (2025)
- 280,982 people
- By 2030
- 292,068 · +3.9%
- By 2040
- 312,191 · +11.1%
- By 2050
- 331,196 · +17.9%
- By 2075
- 379,021 · +34.9%
- By 2100
- 396,579 · +41.1%
Race, ethnicity, and origin ACS 2023
- Neighborhood character
- Predominantly White (78%)
- Race & ethnicity
- White 78% Black 7% Two or more races 7% Hispanic / Latino 6% Asian 5%
- Hispanic origin (detail)
- Mexican 4%
- Common ancestry
- Iranian 9% Romanian 5% Italian 3%
- Foreign-born
- 8% · Canada, China, Vietnam
- Languages at home
- 90% English-only · Spanish 3% Other Indo-European 2% Other Asian/Pacific 2%
Political lean MEDSL · Kalamazoo
- 2024 margin
- D (+17.7) · D 58.0% · R 40.3% · Other 1.7%
- 2008→2024 swing
- -1.8pp toward R · 2008: 19.5pp · 2024: 17.7pp
- All cycles
- 2024: D+17.7 2020: D+18.7 2016: D+12.8 2012: D+13.3 2008: D+19.5
Not yet ingested
- Civics
- —
Market trends
- HPI YoY
- ▼ -239.74%
- Current HPI
- 215.2275
- Rent YoY
- ▲ 6.36%
- Metro
- Kalamazoo-Portage, MI
- State GDP YoY
- ▲ 1.37%
- F500 in state
- 28
Industry mix (Fortune 500 HQ in MI)
| Industry | F500 HQs | Revenue |
|---|---|---|
| Automotive Parts | 3 | $48B |
|
||
| Automotive | 2 | $372B |
|
||
| Chemicals | 1 | $45B |
|
||
| Automotive Retail | 1 | $29B |
|
||
| Healthcare / Medical Devices | 1 | $23B |
|
||
| Automotive Technology | 1 | $20B |
|
||
Price history
+6.7% since first listed3 events — show timeline
- 2026-03-10 Price Changed $296,630 Zillow
- 2025-09-04 Price Changed $291,630 Zillow
- 2025-05-23 Listed $277,975 Zillow
Cash-flow waterfall
monthlySold comps — $/sqft
last 12 mo · ≤1 miLoading sold comps…