6607 Prickly Pear Way · Abilene, TX
Flood risk 1/10 · Minimal
- FEMA flood zone
- X (shaded)
- Chance of flooding over 30 yrs
- 0.0%
- Est. flood insurance / yr
- $507 – $1,088
Fire risk 9/10 · Severe
- Est. fire insurance / yr
- $1,222 – $2,270
Heat risk 6/10 · Moderate
- Hot days now (above 103°F)
- 7 days/yr
- Hot days in 30 yrs
- 23 days/yr
Wind risk 4/10 · Minor
- Chance of severe wind over 30 yrs
- 18.0%
Air-quality risk 1/10 · Minimal
- Unhealthy air days now
- 0 days/yr
- Unhealthy air days in 30 yrs
- 0 days/yr
Risk factors via First Street. Map © Google.
Why this score? — see what drove the D grade
The composite is a weighted blend of 9 inputs, each scored 0–100. Each bar is that input's sub-score; the figure is the points it added to the 100-point composite (weight × sub-score).
- Cash flow +14.2/30.0
- Schools +5.6/10.0
- Rent growth +5.0/5.0
- Condition / age +5.0/5.0
- DSCR +4.3/10.0
- 1% rule +4.0/10.0
- Livability +3.8/5.0
- ARV discount +0.9/15.0
- Appreciation +0.0/10.0
$332,000
🖨 Deal sheet 📄 Offer letter ✓ Due diligence
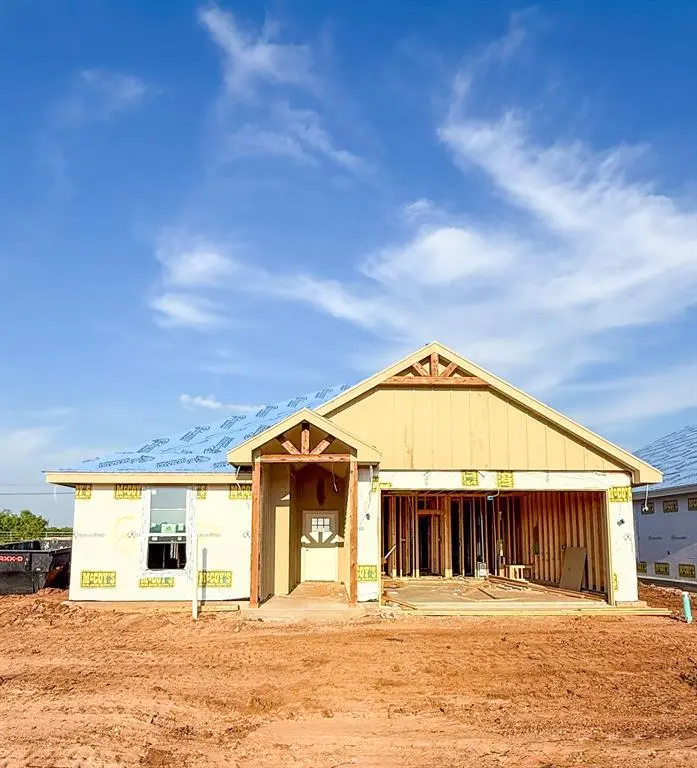
Listing remarks
Experience luxury living at an affordable price in this beautifully crafted new construction home located in the highly desired Fairway Oaks Village Subdivision, just minutes from the Fairway Oaks Golf Course. This thoughtfully designed brick home blends upscale finishes with everyday comfort, making it the perfect place to call home. Step inside to find soaring 9’ and 10’ ceilings and abundant natural light pouring through energy-efficient 6-foot windows, creating an open and inviting atmosphere. The kitchen is both stylish and functional, featuring a gas cooktop and modern conveniences ideal for cooking and entertaining. Designed with efficiency and ease in mind, the home incl
Key facts
- Gas cooktop
- 9 and 10 ceilings
- 6,665 sq ft lot
Tags
Property features AI
Finance
- Financial info: Loan types accepted: 1031 Exchange, Cash, Conventional, FHA, VA; Second mortgage: No; Treat as clear loan type
- HOA & community: Mandatory association; Association covers management fees; Association fee charged annually (amount listed as 0); HOA management company: TBD (phone: 325-669-3558)
Exterior
- Parking: 2 covered spaces; 2-car attached garage; Driveway; Asphalt parking; Garage with opener and garage faces front
- Utilities: City water; City sewer; Asphalt (road)
- Home design: Single-family residence; Residential property; One story; Entry level: One
- Construction: Built in 2026; Smart home features
- Exterior features: Less than 0.5 acre lot; Municipal utility district; Subdivision: Fairway Village; Directions: Antilly to Fairway then to Hardwick
Interior
- Kitchen: Dishwasher; Electric oven; Gas cooktop; Refrigerator; Vented exhaust fan; Pantry
- Bedrooms: 3 bedrooms; Primary bedroom on main level with ensuite bath and walk-in closet
- Bathrooms: 2 full bathrooms
- Interior features: Decorative lighting; Pantry; Smart home system; Walk-in closet(s); One living area; One dining area; Room count: 3; Levels: One
- Laundry & utility: Tankless water heater
Neighborhood map
What this means for you Summary
Snapshot
- This is a 3-bed/2.0-bath single-family listed at $332k. Condition is rated excellent.
Deal economics
- At list price, monthly cash flow is $58 ($691/yr) — positive.
- The deal already cash-flows at list — no discount required.
- To meet the 1% rule (rent ≥ 1% of price), the offer needs to be $298k (10.3% below list).
- Recommended offer: $298k (10.3% below list) — sets the bar for 1% rule.
Location & tenants
- Location reads 75/100 on livability (#142 in TX, #4,037 nationally) — a middle-class / working-renter tenant base. Strengths: cost of living A+, housing A+, health & safety A+; Watch: crime D, commute F.
- Wylie ISD (rural): math 63% / reading 62% proficiency, ranked #32 of 826 in TX (top 4%) — acceptable for families but not a draw, mixed tenant base, ~2y average lease; only 17% free/reduced lunch — higher-income household profile.
- Zoned schools: Wylie West El (428 students, 21% FRL) — zoned schools at 21% FRL track the district average.
- Market conditions: Rents rising fast (+40.7%/yr); 288 active listings in the ZIP; 13 comparable units currently listed for rent nearby; rentals leasing fast (median 14d on market — plan ~1-2 weeks tenant-placement turnaround); solid renter incomes; 508 units permitted in Taylor County in 2024 (0 in 5+ unit buildings).
- At $2,977/mo this rent would consume 45% of the median local household income ($79k/yr) (locally 1181% of renters already pay >50% of income on rent) — very limited rent-growth headroom before tenants either downsize or default.
Forward outlook
- Local home prices are declining (-3.0%/yr); year-one equity from $2k of loan paydown is wiped out by about $10k of value loss. Plan a longer hold.
- Taylor County population projected at +16% by 2050 — long-run rental-demand tailwind backs the buy-and-hold thesis.
Negotiation context
- Only 14 days on market — expect competitive offers; lowballing is unlikely to land.
Risks & watch-outs
- Climate carrying-cost: severe wildfire risk; extreme-heat days projected 7→23/yr by 2055 (HVAC capex compounding) — expect insurance premiums to compound above CPI over the hold.
Questions for the listing agent
- Is there a deadline driving the sale (1031 exchange, divorce, estate, relocation)? That informs how much negotiation room exists.
- Schools are D-rated, which usually means shorter tenancies and higher turnover. Who's the typical renter profile here, and what's been the actual vacancy rate?
- Crime grade is D in this area — have there been break-ins, vandalism, or insurance claims at this property in the last 3 years? What carrier currently insures it and at what premium?
- The area grade is low — what's the realistic commute time and amenity access for the typical tenant pool here? Any planned neighborhood developments (good or bad) we should know about?
- What's the average days-on-market for RENTAL listings here right now (not sales)? A rising rental-DOM trend means longer vacancies and softer asking-rent achievability than the comps imply.
- What's the recent tenant-quality profile in this submarket — average credit score on applications, eviction rate, late-payment / NSF rate, and stable-employment percentage? A property-management company in the area should have these aggregated.
- How much new for-sale + rental construction is in the pipeline within 1–3 miles? Heavy new supply typically softens prices + rents 12–24 months out; constrained supply supports both.
Investment metrics
- 1% rule
- 0.90% ✗
- Cap rate
- 6.50%
- Cash-on-cash
- 0.74%
- DSCR
- 1.03
- GRM
- 9.3
CMA / ARV
- ARV (on-the-fly)
- $289,536
- Comps found
- 12
Show comp detail 12 sales within ~0.75 mi
| Address | Dist | Beds/Ba | Sqft | Sold | Price | $/sf | Match |
|---|---|---|---|---|---|---|---|
| 3340 Muthu Veer Dr | 0.46mi | 3/2.0 | 1,547 (+3%) | 8mo | $294,000 | $190 | 68 |
| 3334 Laxmi Govind Dr | 0.51mi | 3/2.0 | 1,380 (-8%) | 1mo | $275,000 | $199 | 62 |
| 6909 Glen Abbey Rd | 0.52mi | 3/2.0 | 1,642 (+9%) | 2mo | $309,900 | $189 | 60 |
| 3299 Laxmi Govind | 0.51mi | 4/2.0 (+1) | 1,577 (+5%) | 7mo | $319,900 | $203 | 58 |
| 6947 Forrest Meadows Dr | 0.71mi | 3/2.0 | 1,569 (+4%) | 6mo | $289,000 | $184 | 55 |
| 6901 Glen Abbey Rd | 0.51mi | 4/2.0 (+1) | 1,648 (+9%) | 2mo | $309,900 | $188 | 54 |
| 7036 Tin Cup | 0.59mi | 3/2.0 | 1,380 (-8%) | 7mo | $269,999 | $196 | 53 |
| 7412 Olive Grove Ave | 0.66mi | 3/2.0 | 1,678 (+11%) | 2mo | $325,000 | $194 | 49 |
| 6939 Forrest Meadows Dr | 0.70mi | 4/2.0 (+1) | 1,619 (+7%) | 2mo | $310,000 | $191 | 49 |
| 7069 Tin Cup | 0.63mi | 3/2.0 | 1,300 (-14%) | 8mo | $249,900 | $192 | 41 |
| 7077 Tin Cup | 0.64mi | 3/2.0 | 1,300 (-14%) | 8mo | $249,900 | $192 | 40 |
| 7085 Tin Cup | 0.65mi | 3/2.0 | 1,300 (-14%) | 8mo | $249,900 | $192 | 40 |
Match score weights: distance 35% · size 25% · config 20% · recency 20%. Top-matched comps best support the ARV.
Projected returns pro-forma
-3.0% appreciation · 8.0% rent growth · sell at horizon
- IRR
- -9.6%
- Equity multiple
- 0.63×
- Total profit
- $-34,354
- Equity at exit
- $49,502
- IRR
- 5.5%
- Equity multiple
- 1.50×
- Total profit
- $46,598
- Equity at exit
- $28,705
Cash invested: $92,960 (down + closing). Projections, not guarantees.
Landlord ↔ Tenant lean methodology
- Overall (STATE)
- 87 Strongly Landlord-Friendly
- State Texas
- 87 Strongly Landlord-Friendly · R+5
- County
- — inherits STATE
- City
- — inherits STATE
ZIP-level market 79606
- Rents YoY
- 40.7%
- Active inventory
- 288
- Price-to-rent
- 9.3×
Monthly cashflow live
- Estimated rent
- $2,977 high interval (Pro) →
- Mortgage (P&I)
- −$1,741
- Tax est. 1.5%
- −$415 /mo · $4,980/yr
- Insurance
- −$138
- HOA
- −$0
- Vacancy / Maint / Mgmt
- −$625
- Net cashflow
- $58
Break-even live
UW: 25.0% down · 7.5% · 30yr · 1.5% tax · 5.0% vac · 8.0% maint · 8.0% mgmt
Financing live
Cash to close
- Down payment
- $83,000
- Closing costs
- $9,960
- Reserves months
- —
- Total cash needed
- —
Loan-product check · same deal, 3 products live
Conventional
25% down · 7.5% · 30yr
- Down + closing
- —
- Monthly P&I
- —
- Monthly cashflow
- —
- DSCR
- —
- Eligible?
- —
Personal DTI + credit; lowest rate.
DSCR
20% down · 8.5% · 30yr
- Down + closing
- —
- Monthly P&I
- —
- Monthly cashflow
- —
- DSCR
- —
- Eligible?
- —
No personal income docs; deal must DSCR.
Hard money
10% down · 12.0% · 12mo
- Down + closing
- —
- Monthly P&I
- —
- Monthly cashflow
- —
- DSCR
- —
- Eligible?
- —
Short-term bridge; refi at stabilization.
Rent comps 13 comps
| Address | Beds | Baths | Sqft | Rent | $/sqft | DOM | Units | Dist |
|---|---|---|---|---|---|---|---|---|
| 6901 Glen Abbey St Abilene, TX | 4.0 | 2.0 | 1648 | $3,795 | $2.30 | 21d | 1 | 0.50mi |
| 7061 Tin Cup Dr Abilene, TX | 4.0 | 2.0 | 1648 | $3,495 | $2.12 | 11d | 1 | 0.61mi |
| 3626 Yamini Dr Abilene, TX | 4.0 | 2.0 | 1788 | $2,799 | $1.57 | 21d | 1 | 0.74mi |
| 7045 Phoenix Dr Abilene, TX | 4.0 | 2.0 | 1571 | $2,714 | $1.73 | 24d | 1 | 0.79mi |
| 7039 Phoenix Dr Abilene, TX | 3.0 | 2.0 | 1298 | $2,591 | $2.00 | 24d | 1 | 0.80mi |
| 7610 Florence Dr Abilene, TX | 3.0 | 2.0 | 1405 | $2,640 | $1.88 | 21d | 1 | 0.86mi |
| 5733 Legacy Dr Abilene, TX | 3.0 | 2.0 | 1843 | $5,000 | $2.71 | 5d | 1 | 0.90mi |
| 3902 Karen Dr Abilene, TX | 3.0 | 2.0 | 1055 | $2,495 | $2.36 | 17d | 1 | 1.12mi |
| 4101 Karen Dr Abilene, TX | 3.0 | 2.0 | 1317 | $2,650 | $2.01 | 7d | 1 | 1.21mi |
| 7601 Thompson Pkwy Abilene, TX | 4.0 | 2.0 | 1495 | $2,795 | $1.87 | 13d | 1 | 1.35mi |
| 4925 Greenslope Dr Unit C Abilene, TX | 3.0 | 2.0 | 1100 | $1,900 | $1.73 | 13d | 1 | 1.41mi |
| 7534 John Carroll Dr Abilene, TX | 4.0 | 2.0 | 1984 | $2,795 | $1.41 | 4d | 1 | 1.46mi |
| 7825 Thompson Pkwy Abilene, TX | 3.0 | 2.0 | 1167 | $2,295 | $1.97 | 7d | 1 | 1.48mi |
Listing history 2 events
-
2026-05-01status Pending
-
2026-04-17$332,000 Active
ⓘ Source: listings_history table (triggers on properties + properties_extension) + one-shot
backfill from property_details.listing_events for pre-trigger history.
Climate risk First Street
- Flood 1/10 Low FEMA zone X (shaded) · 0% chance over 30 yrs
- Wildfire 9/10 Extreme
- Heat 6/10 Major 7 d/yr ≥103°F today · 23 d/yr by 30 yrs out
- Wind 4/10 Moderate 18% chance of damaging wind over 30 yrs
- Air quality 1/10 Low 0 unhealthy d/yr today · 0 by 30 yrs out
Nearby sold comps map
Loading sold comps map…
Walkable amenities ~0.75 mi
Loading nearby amenities…
Taxation est. · year 1
- Rental income
- $35,726
- − Mortgage interest
- −$18,597
- − Property taxes
- −$4,980
- − Insurance
- −$1,660
- − Repairs & maintenance
- −$2,858
- − Management
- −$2,858
- − Depreciation
- −$9,658
- Taxable loss
- −$4,886
- Est. tax savings @ 24.0%
- +$1,173
- After-tax cash flow
- $1,863/yr
For passive investors: Depreciation is non-cash, so a rental often shows a tax loss while cash-flowing — sheltering income. Rental losses are passive: they offset passive income freely, and up to $25,000/yr can offset ordinary (W-2) income if you actively participate and your MAGI is under $100k (phasing out to $0 by $150k); unused losses carry forward. On sale, claimed depreciation is recaptured at up to 25%, and gains may owe capital-gains tax (a 1031 exchange can defer both). Figures are a year-1 estimate at your 24.0% rate — not tax advice; consult a CPA.
Condition & rehab AI · 4 photos
This new construction home is in excellent condition and ready for completion. It offers a perfect blend of luxury and functionality, making it an ideal investment opportunity.
Value-add opportunities
- Both Complete construction and finishing — Finishing touches will make the home move-in ready and visually appealing
- Both Landscaping and curb appeal — Landscaping will enhance the home's curb appeal and attract potential buyers
- Both Interior finishing and fixtures — Interior finishing and fixtures will make the home move-in ready and visually appealing
Renovation cost estimate screening
Value-add ROI direction
- Both Complete construction and finishing — Finishing touches will make the home move-in ready and visually appealing ↑
- Both Landscaping and curb appeal — Landscaping will enhance the home's curb appeal and attract potential buyers ↑
- Both Interior finishing and fixtures — Interior finishing and fixtures will make the home move-in ready and visually appealing ↑
ⓘ Cost ranges are severity-bucket heuristics (US national rule-of-thumb). Get contractor quotes + a written scope before underwriting a rehab budget.
Schools (NCES district)
- District
- Wylie ISD
- NCES district ID
- 4846500
- Math proficiency
- 63% ▼ -12.00%
- Reading proficiency
- 62% ▼ -4.00%
- Median HH income
- $78,248
- Composite
- 55.86/100
- National rank
- #1206
- State rank
- #32 of 826 in TX
Livability — Abilene
- Score
- 75/100
- State rank
- #142
- US rank
- #4037
Category grades
Schools grade is shown separately in the Schools card above.
Census & demographics
- Census place
- Abilene, TX
- County
- Taylor County · 136,672 people
- City population
- 136,672
- Metro
- Abilene, TX
- Population (ZIP)
- 29,182
- Household income
- $79,196
- Rent vs Own
- Severe rent burden
- 1181.0
Population outlook (Taylor County) Hauer SSP2
- Today (2025)
- 145,270 people
- By 2030
- 150,050 · +3.3%
- By 2040
- 159,417 · +9.7%
- By 2050
- 168,883 · +16.3%
- By 2075
- 194,436 · +33.8%
- By 2100
- 203,163 · +39.9%
Race, ethnicity, and origin ACS 2023
- Neighborhood character
- Predominantly White (69%)
- Race & ethnicity
- White 69% Hispanic / Latino 19% Two or more races 11% Black 6% Asian 4%
- Hispanic origin (detail)
- Mexican 14%
- Common ancestry
- Italian 4% Slovak 2% Serbian 1%
- Foreign-born
- 7% · Canada, Vietnam
- Languages at home
- 86% English-only · Spanish 10% Tagalog/Filipino 1% Other Indo-European 1%
Political lean MEDSL · Taylor
- 2024 margin
- Solid R (+49.8) · D 24.6% · R 74.4% · Other 1.0%
- 2008→2024 swing
- -4.2pp toward R · 2008: -45.6pp · 2024: -49.8pp
- All cycles
- 2024: R+49.8 2020: R+45.3 2016: R+51.1 2012: R+53.6 2008: R+45.6
Not yet ingested
- Civics
- —
Market trends
- HPI YoY
- ▼ -167.33%
- Current HPI
- 179.2555
- Rent YoY
- ▲ 40.73%
- Metro
- Abilene, TX
- State GDP YoY
- ▲ 3.95%
- F500 in state
- 110
Industry mix (Fortune 500 HQ in TX)
| Industry | F500 HQs | Revenue |
|---|---|---|
| Energy | 16 | $1,198B |
|
||
| Technology | 5 | $198B |
|
||
| Engineering / Construction | 4 | $72B |
|
||
| Energy Services | 3 | $60B |
|
||
| Utilities | 3 | $41B |
|
||
| Healthcare | 2 | $330B |
|
||
Price history
2 events — show timeline
- 2026-05-01 Pending — NTREIS
- 2026-04-17 Listed $332,000 NTREIS
Cash-flow waterfall
monthlySold comps — $/sqft
last 12 mo · ≤1 miLoading sold comps…