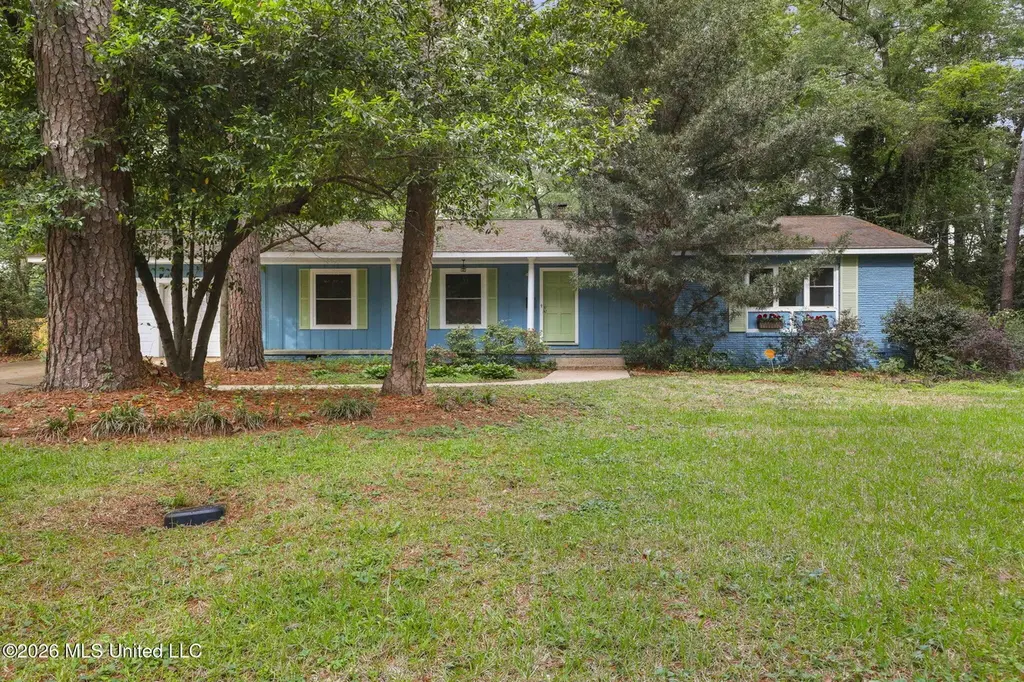
5445 Pine Lane Dr · Jackson, MS
Flood risk 1/10 · Minimal
- FEMA flood zone
- X (unshaded)
- Chance of flooding over 30 yrs
- 0.0%
- Est. flood insurance / yr
- $507 – $1,088
Fire risk 1/10 · Minimal
- Est. fire insurance / yr
- $1,241 – $2,305
Heat risk 7/10 · Major
- Hot days now (above 108°F)
- 7 days/yr
- Hot days in 30 yrs
- 18 days/yr
Wind risk 7/10 · Major
- Chance of severe wind over 30 yrs
- 78.0%
Air-quality risk 2/10 · Minimal
- Unhealthy air days now
- 0 days/yr
- Unhealthy air days in 30 yrs
- 1 days/yr
Risk factors via First Street. Map © Google.
Why this score? — see what drove the C- grade
The composite is a weighted blend of 9 inputs, each scored 0–100. Each bar is that input's sub-score; the figure is the points it added to the 100-point composite (weight × sub-score).
- ARV discount +15.0/15.0
- Cash flow +13.0/30.0
- Appreciation +5.0/10.0
- DSCR +3.9/10.0
- 1% rule +3.6/10.0
- Livability +3.4/5.0
- Rent growth +2.5/5.0
- Condition / age +2.5/5.0
- Schools +1.1/10.0
$190,000
🖨 Deal sheet (PDF) 📄 Offer letter ✓ Due diligence
Listing remarks MLS
So Cute! Spacious 3 bed/ 2 bath with den and additional formal living room, formal dining area and eat-in kitchen bar. Updates everywhere. Ceramic tile floors in the kitchen. NO CARPET. Fresh paint throughout, beautiful wood floors, extra closet storage, 2 car garage, fenced backyard with storage building/playhouse. Quiet tree-lined street. Lots of trees in the yard. Great access to everything. Great buy in a great area.
Key facts
- 0.33 acre lot
- 2 garage spots
- Built 1957
Property features AI
Exterior
- Parking: Attached garage (2 spaces); 6 total parking spaces; Garage faces front with inside entrance; Concrete parking surfaces
- Security: Security system
- Utilities: Public water; Public sewer; Electricity connected; Natural gas connected; Cable connected
- Home design: Single-family house; One story; Move-in ready
- Construction: Brick and siding exterior; Conventional foundation; Architectural asphalt shingles roof; Built in public records (year built source)
- Exterior features: Front porch; Patio with stone/tile; Fire pit; Portable building; Fenced yard (privacy wood fence)
Interior
- Kitchen: Dishwasher; Free-standing gas range; Microwave
- Flooring: Ceramic tile; Wood
- Bathrooms: 2 full bathrooms
- Heating & cooling: Central heating (natural gas); Central air conditioning
- Interior features: High-speed internet; Kitchen island; Recessed lighting; Wired for sound; ENERGY STAR qualified vinyl windows; Deadbolt locks; French doors; Wood-burning fireplace
- Laundry & utility: Washer hookup; Electric dryer hookup; Laundry area in garage
Neighborhood map
What this means for you Summary
Snapshot
- This is a 3-bed/2.0-bath single-family listed at $190k.
Deal economics
- At list price, monthly cash flow is $-10 ($-125/yr) — negative.
- To cash-flow at today's rent, offer at most $188k (1.0% below list).
- To meet the 1% rule (rent ≥ 1% of price), the offer needs to be $164k (13.8% below list).
- Recommended offer: $164k (13.8% below list) — sets the bar for 1% rule.
- Cap rate 6.2% vs local median 9.9% in Jackson — below-typical yield; the buyer is paying a premium for something (appreciation thesis, condition, location) that the cap rate doesn't capture.
Location & tenants
- Location reads 68/100 on livability (#66 in MS) — a middle-class / working-renter tenant base. Strengths: commute A+, cost of living A+, housing A+; Watch: amenities F, employment F, health & safety F.
- Jackson Public School District (urban): math 9% / reading 18% proficiency, ranked #112 of 130 in MS (top 86%) — low school quality limits family demand, transient renter base, plan for 1-2y turnover; 88% free/reduced lunch — lower-income household profile, screen leases tightly.
- Zoned schools: Spann Elementary School (math 7% / reading 21%, grade F, #289 of 375 statewide, top 78%, 395 students, 100% FRL); Chastain Middle School (math 5% / reading 11%, grade F, #165 of 179 statewide, top 93%, 499 students, 100% FRL); Murrah High School (math 12% / reading 27%, grade F, #130 of 197 statewide, top 68%, 1,326 students, 100% FRL).
- Market conditions: 3 active listings in the ZIP; 11 comparable units currently listed for rent nearby; rentals at typical pace (median 26d on market — plan ~3-4 weeks tenant-placement turnaround); 167 units permitted in Hinds County in 2024 (0 in 5+ unit buildings).
Forward outlook
- In year one you build about $7k of equity ($1k loan paydown + $6k appreciation (3.0% local appreciation)).
- Hinds County population projected to shrink 6% by 2050 — rents likely to lag national; underwrite the cash flow, not the appreciation.
- At projected returns (3.0% appreciation + 3.0% rent growth), your $53k cash investment doubles in ~7 years — after that, you're playing with house money.
- By year 5, paydown + projected appreciation supports a ~$30k cash-out refi (75% LTV) — recoverable capital for the next deal without selling this one.
Negotiation context
- Only 9 days on market — expect competitive offers; lowballing is unlikely to land.
- 2 sale attempts since 21y ago with the ask held roughly flat each time — persistent listings suggest the price (not the market) is what's stuck; bring a comps-based counter.
Risks & watch-outs
- Watch-outs: built in 1957 — expect roof / HVAC / electrical / plumbing capex.
- Climate carrying-cost: major wind risk, 78% chance of damaging wind over 30y; extreme-heat days projected 7→18/yr by 2055 (HVAC capex compounding) — expect insurance premiums to compound above CPI over the hold.
Questions for the listing agent
- What do current leases actually rent for vs. the listed asking? Can we see a recent rent roll and the last 12 months of T-12 income?
- Built in 1957 — when were the roof, HVAC, electrical panel, plumbing, and water heater last replaced?
- Is there a deadline driving the sale (1031 exchange, divorce, estate, relocation)? That informs how much negotiation room exists.
- Schools are F-rated, which usually means shorter tenancies and higher turnover. Who's the typical renter profile here, and what's been the actual vacancy rate?
- What's the average days-on-market for RENTAL listings here right now (not sales)? A rising rental-DOM trend means longer vacancies and softer asking-rent achievability than the comps imply.
- What's the recent tenant-quality profile in this submarket — average credit score on applications, eviction rate, late-payment / NSF rate, and stable-employment percentage? A property-management company in the area should have these aggregated.
- How much new for-sale + rental construction is in the pipeline within 1–3 miles? Heavy new supply typically softens prices + rents 12–24 months out; constrained supply supports both.
Investment metrics
- 1% rule
- 0.86% ✗
- Cap rate
- 6.23%
- Cash-on-cash
- -0.24%
- DSCR
- 0.99
- GRM
- 9.7
CMA / ARV
- ARV (on-the-fly)
- $231,660
- Comps found
- 12
Show comp detail 12 sales within ~0.75 mi
| Address | Dist | Beds/Ba | Sqft | Sold | Price | $/sf | Match |
|---|---|---|---|---|---|---|---|
| 5430 Pine Lane Dr | 0.05mi | 3/2.0 | 1,932 (-2%) | 9mo | $198,000 | $102 | 86 |
| 5457 Suffolk Dr | 0.36mi | 3/2.0 | 1,996 (+1%) | 10mo | $239,900 | $120 | 74 |
| 5207 Reddoch Dr | 0.62mi | 3/2.0 | 2,001 (+1%) | 1mo | $250,000 | $125 | 69 |
| 5438 Pine Lane Dr | 0.04mi | 3/3.0 | 2,231 (+13%) | 6mo | $197,500 | $89 | 68 |
| 1005 Briarwood Dr | 0.58mi | 3/2.0 | 1,994 (+1%) | 5mo | $239,000 | $120 | 67 |
| 5276 Saratoga Dr | 0.48mi | 4/2.0 (+1) | 2,100 (+6%) | 4mo | $269,900 | $129 | 59 |
| 5235 Hialeah Dr | 0.53mi | 4/2.5 (+1) | 2,100 (+6%) | 2mo | $245,000 | $117 | 57 |
| 5247 Suffolk Cir | 0.48mi | 3/2.0 | 1,691 (-15%) | 0mo | $262,500 | $155 | 53 |
| 5246 Saratoga Dr | 0.42mi | 3/2.0 | 2,273 (+15%) | 4mo | $220,000 | $97 | 52 |
| 1030 Adkins Blvd | 0.71mi | 4/2.0 (+1) | 2,178 (+10%) | 4mo | $153,000 | $70 | 42 |
| 5172 Kaywood Cir | 0.74mi | 4/2.5 (+1) | 2,255 (+14%) | 6mo | $214,900 | $95 | 30 |
| 5335 Red Fox Rd | 0.73mi | 4/2.0 (+1) | 2,265 (+14%) | 11mo | $254,900 | $113 | 28 |
Match score weights: distance 35% · size 25% · config 20% · recency 20%. Top-matched comps best support the ARV.
Projected returns pro-forma
3.0% appreciation · 3.0% rent growth · sell at horizon
- IRR
- 7.3%
- Equity multiple
- 1.42×
- Total profit
- $22,244
- Equity at exit
- $85,432
- IRR
- 10.0%
- Equity multiple
- 2.51×
- Total profit
- $80,172
- Equity at exit
- $131,661
Cash invested: $53,200 (down + closing). Projections, not guarantees.
Landlord ↔ Tenant lean methodology
- Overall (STATE)
- 90 Strongly Landlord-Friendly
- State Mississippi
- 90 Strongly Landlord-Friendly · R+11
- County
- — inherits STATE
- City
- — inherits STATE
ZIP-level market 39201
- Active inventory
- 3
- Price-to-rent
- 9.7×
Monthly cashflow live
- Estimated rent
- $1,638 high interval (Pro) →
- Mortgage (P&I)
- −$996
- Tax from tax record
- −$229 /mo · $2,747/yr
- Insurance
- −$79
- HOA
- −$0
- Vacancy / Maint / Mgmt
- −$344
- Net cashflow
- $-10
Break-even live
Sensitivity live
| Price | -10% $97 | -5% $43 | +0% $-10 | +5% $-64 | +10% $-118 |
|---|---|---|---|---|---|
| Rent | -10% $-140 | -5% $-75 | +0% $-10 | +5% $54 | +10% $119 |
| Rate | -1.0pp $85 | -0.5pp $38 | base $-10 | +0.5pp $-60 | +1.0pp $-110 |
UW: 25.0% down · 7.5% · 30yr · 1.5% tax · 5.0% vac · 8.0% maint · 8.0% mgmt
Financing live
Cash to close
- Down payment
- $47,500
- Closing costs
- $5,700
- Reserves months
- —
- Total cash needed
- —
Loan-product check · same deal, 3 products live
Conventional
25% down · 7.5% · 30yr
- Down + closing
- —
- Monthly P&I
- —
- Monthly cashflow
- —
- DSCR
- —
- Eligible?
- —
Personal DTI + credit; lowest rate.
DSCR
20% down · 8.5% · 30yr
- Down + closing
- —
- Monthly P&I
- —
- Monthly cashflow
- —
- DSCR
- —
- Eligible?
- —
No personal income docs; deal must DSCR.
Hard money
10% down · 12.0% · 12mo
- Down + closing
- —
- Monthly P&I
- —
- Monthly cashflow
- —
- DSCR
- —
- Eligible?
- —
Short-term bridge; refi at stabilization.
Rent comps 11 comps
| Address | Beds | Baths | Sqft | Rent | $/sqft | DOM | Units | Dist |
|---|---|---|---|---|---|---|---|---|
| 5538 Pine Lane Dr Jackson, MS | 3.0 | 2.0 | 1627 | $1,465 | $0.90 | 45d | 1 | 0.13mi |
| 5544 Wayneland Dr Jackson, MS | 3.0 | 2.0 | 1800 | $1,831 | $1.02 | 45d | 1 | 0.16mi |
| 5301 Ridgewood Rd Jackson, MS | 3.0 | 2.0 | 1482 | $1,850 | $1.25 | 45d | 1 | 0.43mi |
| 212 Pimlico Pl Jackson, MS | 3.0 | 2.0 | 1600 | $900 | $0.56 | 15d | 1 | 0.63mi |
| 5125 Old Canton Rd Jackson, MS | 3.0 | 3.0 | 2025 | $2,100 | $1.04 | 25d | 1 | 0.82mi |
| 492 E Beasley Rd Jackson, MS | 1.0–3.0 | 1.0–2.0 | 1133 | $1,440 | $1.27 | 15d | 8 | 0.85mi |
| 120 Parkway Dr Jackson, MS | 1.0–3.0 | 1.0–2.0 | 1076 | $2,255 | $2.10 | 15d | 15 | 1.14mi |
| 4750 Old Canton Rd Jackson, MS | 4.0 | 3.0 | 2085 | $2,200 | $1.06 | 25d | 1 | 1.17mi |
| 1702 Jamestown Way Unit 1702 Jackson, MS | 3.0 | 2.0 | 1465 | $1,495 | $1.02 | 45d | 1 | 1.27mi |
| 701 Cedarhurst Dr Jackson, MS | 4.0 | 2.0 | 1419 | $1,250 | $0.88 | 25d | 1 | 1.43mi |
| 119 S Canton Club Cir Jackson, MS | 3.0 | 2.0 | 1444 | $1,595 | $1.10 | 25d | 1 | 1.46mi |
Listing history 13 events
-
2026-06-15status $190,000 Pending 9 DOM
-
2026-06-15days on market $190,000 Active 9 DOM
-
2026-06-14days on market $190,000 Active 7 DOM
-
2026-06-13remarks 632-char remark
-
2026-06-13statusdays on market $190,000 Active 6 DOM
-
2026-04-14status Pending
-
2026-04-09$190,000 Active
-
2005-05-24soldstatus 424-char remark
Show marketing remark (424 chars)
So Cute! Spacious 3 bed/ 2 bath with den and additional formal living room, formal dining area and eat-in kitchen bar. Updates everywhere. Ceramic tile floors in the kitchen. NO CARPET. Fresh paint throughout, beautiful wood floors, extra closet storage, 2 car garage, fenced backyard with storage building/playhouse. Quiet tree-lined street. Lots of trees in the yard. Great access to everything. Great buy in a great area.
-
2005-05-23soldstatus
-
2005-03-17$127,900 424-char remark
Show marketing remark (424 chars)
So Cute! Spacious 3 bed/ 2 bath with den and additional formal living room, formal dining area and eat-in kitchen bar. Updates everywhere. Ceramic tile floors in the kitchen. NO CARPET. Fresh paint throughout, beautiful wood floors, extra closet storage, 2 car garage, fenced backyard with storage building/playhouse. Quiet tree-lined street. Lots of trees in the yard. Great access to everything. Great buy in a great area.
-
2000-05-24soldstatus
-
1997-04-30soldstatus
-
1996-01-03soldstatus
ⓘ Source: listings_history table (triggers on properties + properties_extension) + one-shot
backfill from property_details.listing_events for pre-trigger history.
Tax reassessment forecast MS · Resets to sale price
- Current annual tax
- $2,747 · $229/mo
- Projected year-2 tax
- $2,747 · $229/mo
- Expected delta
- $0/yr ($0/mo · 0.0%)
ⓘ Screening estimate from a state-policy table — verify with the county assessor before closing.
Climate risk First Street
- Flood 1/10 Low FEMA zone X (unshaded) · 0% chance over 30 yrs
- Wildfire 1/10 Low
- Heat 7/10 Severe 7 d/yr ≥108°F today · 18 d/yr by 30 yrs out
- Wind 7/10 Severe 78% chance of damaging wind over 30 yrs
- Air quality 2/10 Low 0 unhealthy d/yr today · 1 by 30 yrs out
Nearby sold comps map
Loading sold comps map…
Walkable amenities ~0.75 mi
Loading nearby amenities…
Taxation est. · year 1
- Rental income
- $19,656
- − Mortgage interest
- −$10,643
- − Property taxes
- −$2,747
- − Insurance
- −$950
- − Repairs & maintenance
- −$1,573
- − Management
- −$1,573
- − Depreciation
- −$5,527
- Taxable loss
- −$3,356
- Est. tax savings @ 24.0%
- +$805
- After-tax cash flow
- $680/yr
For passive investors: Depreciation is non-cash, so a rental often shows a tax loss while cash-flowing — sheltering income. Rental losses are passive: they offset passive income freely, and up to $25,000/yr can offset ordinary (W-2) income if you actively participate and your MAGI is under $100k (phasing out to $0 by $150k); unused losses carry forward. On sale, claimed depreciation is recaptured at up to 25%, and gains may owe capital-gains tax (a 1031 exchange can defer both). Figures are a year-1 estimate at your 24.0% rate — not tax advice; consult a CPA.
Schools (NCES district)
- District
- Jackson Public School District
- NCES district ID
- 2802190
- Math proficiency
- 9% ▼ -14.00%
- Reading proficiency
- 18% ▼ -7.00%
- Median HH income
- $33,234
- Composite
- 10.89/100
- National rank
- #9755
- State rank
- #112 of 130 in MS
Livability — Jackson
- Score
- 68/100
- State rank
- #66
- US rank
- #9695
Category grades
Schools grade is shown separately in the Schools card above.
Census & demographics
- Census place
- Jackson, MS
- City population
- 140,204
- Population (ZIP)
- 775
Population outlook (Hinds County) Hauer SSP2
- Today (2025)
- 242,528 people
- By 2030
- 241,113 · -0.6%
- By 2040
- 235,557 · -2.9%
- By 2050
- 226,946 · -6.4%
- By 2075
- 199,995 · -17.5%
- By 2100
- 164,165 · -32.3%
Race, ethnicity, and origin ACS 2023
- Neighborhood character
- Predominantly Black (80%)
- Race & ethnicity
- Black 80% White 19% Hispanic / Latino 1% Two or more races 1%
- Common ancestry
- German 4% Italian 3% Lithuanian 2%
- Foreign-born
- 0% · Canada
- Languages at home
- 91% English-only · French/Haitian/Cajun 5% Spanish 4%
Political lean MEDSL · Hinds
- 2024 margin
- Solid D (+46.1) · D 72.4% · R 26.3% · Other 1.4%
- 2008→2024 swing
- +7.1pp toward D · 2008: 39.0pp · 2024: 46.1pp
- All cycles
- 2024: D+46.1 2020: D+48.3 2016: D+43.7 2012: D+45.1 2008: D+39.0
Not yet ingested
- Civics
- —
Market trends
- HPI YoY
- —
- Current HPI
- —
- Rent YoY
- —
- Metro
- —
- State GDP YoY
- —
- F500 in state
- 0
Price history
+48.6% since first listed8 events — show timeline
- 2026-04-14 Pending — MLSU
- 2026-04-09 Listed $190,000 MLSU
- 2005-05-24 Sold (MLS) — MLSU
- 2005-05-23 Sold (Public Records) — Public Records
- 2005-03-17 Listed $127,900 MLSU
- 2000-05-24 Sold (Public Records) — Public Records
- 1997-04-30 Sold (Public Records) — Public Records
- 1996-01-03 Sold (Public Records) — Public Records
Property tax history
+1.2%/yrLatest (2025): $2,747 · +2.4% YoY. Source: county tax records.
Cash-flow waterfall
monthlySold comps — $/sqft
last 12 mo · ≤1 miLoading sold comps…