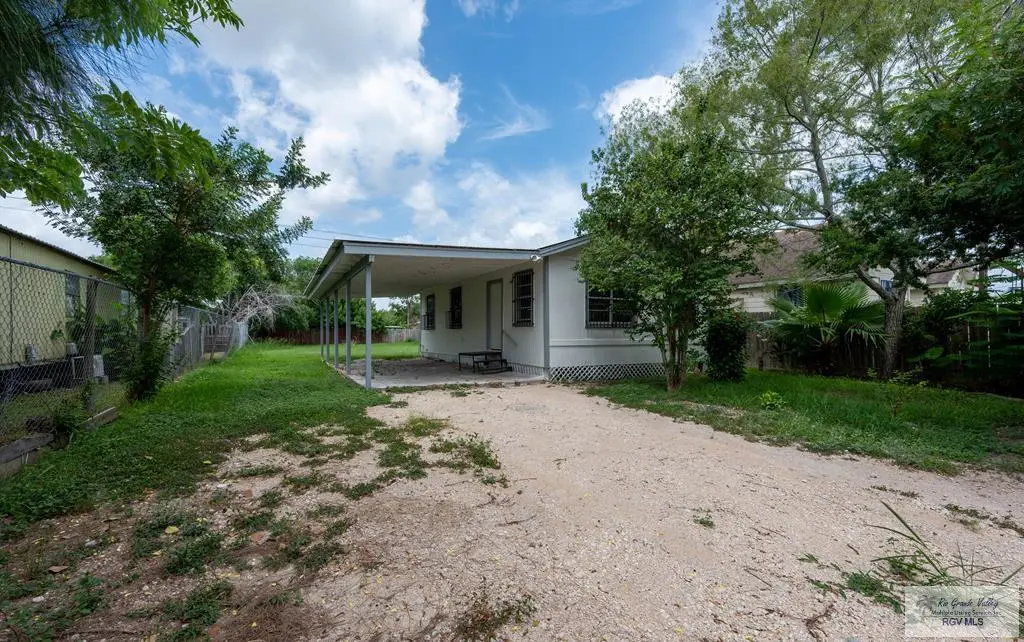
24864 Coral St · San Benito, TX
Flood risk 3/10 · Minor
- FEMA flood zone
- X (unshaded)
- Chance of flooding over 30 yrs
- 0.1%
- Est. flood insurance / yr
- $507 – $1,088
Fire risk 2/10 · Minimal
- Est. fire insurance / yr
- $1,222 – $2,270
Heat risk 9/10 · Severe
- Hot days now (above 110°F)
- 7 days/yr
- Hot days in 30 yrs
- 24 days/yr
Wind risk 9/10 · Severe
- Chance of severe wind over 30 yrs
- 99.0%
Air-quality risk 2/10 · Minimal
- Unhealthy air days now
- 1 days/yr
- Unhealthy air days in 30 yrs
- 1 days/yr
Risk factors via First Street. Map © Google.
Why this score? — see what drove the C- grade
The composite is a weighted blend of 9 inputs, each scored 0–100. Each bar is that input's sub-score; the figure is the points it added to the 100-point composite (weight × sub-score).
- Cash flow +20.4/30.0
- ARV discount +13.0/15.0
- DSCR +6.5/10.0
- 1% rule +4.9/10.0
- Livability +3.3/5.0
- Rent growth +2.5/5.0
- Condition / age +2.5/5.0
- Schools +1.6/10.0
- Appreciation +0.0/10.0
$105,000
🖨 Deal sheet 📄 Offer letter ✓ Due diligence
Listing remarks
Charming 3-bedroom, 1-bath home in a well-established neighborhood. Enjoy a spacious backyard perfect for family gatherings, outdoor activities, or relaxing afternoons. Conveniently located near the expressway and close to schools, shopping, and dining, this home combines comfort and accessibility in a desirable location. A great opportunity to make this inviting property your own!
Key facts
- Close to schools
- Spacious backyard
- Close to dining
Tags
Property features AI
Finance
- Other: Located in the Bent Tree Section IV subdivision
Exterior
- Utilities: Public water; Public sewer
- Home design: Single-family residence; One story; Residential property
- Construction: Wood siding construction
- Exterior features: Metal roof
Interior
- Flooring: Laminate
- Bathrooms: 1 full bathroom
- Interior features: Laminate flooring
Neighborhood map
What this means for you Summary
Snapshot
- This is a 3-bed/1.0-bath single-family listed at $105k.
Deal economics
- At list price, monthly cash flow is $137 ($2k/yr) — positive.
- The deal already cash-flows at list — no discount required.
- To meet the 1% rule (rent ≥ 1% of price), the offer needs to be $104k (1.3% below list).
- Recommended offer: $102k (3.0% below list) — sets the bar for market timing.
- Cap rate 7.9% vs local median 3.7% in San Benito — top-decile yield for the area; either an underpriced asset or a hidden risk that comps aren't pricing in. Stress-test before assuming the spread holds.
Location & tenants
- Location reads 66/100 on livability (#621 in TX) — a middle-class / working-renter tenant base. Strengths: cost of living A+, housing A+; Watch: crime C-, amenities F, commute F.
- San Benito CISD (suburban): math 14% / reading 27% proficiency, ranked #782 of 826 in TX (top 95%) — low school quality limits family demand, transient renter base, plan for 1-2y turnover; 78% free/reduced lunch — lower-income household profile, screen leases tightly.
- Zoned schools: Angela Gerusa Leal El (math 8% / reading 17%, grade F, #4,180 of 4,322 statewide, top 97%, 384 students, 94% FRL); Miller Jordan Middle (math 9% / reading 23%, grade F, #1,543 of 1,662 statewide, top 94%, 640 students, 91% FRL); San Benito H S (math 32% / reading 2%, grade F, #1,460 of 1,632 statewide, top 91%, 2,012 students, 80% FRL).
- Market conditions: 441 active listings in the ZIP; 2,326 units permitted in Cameron County in 2024 (503 in 5+ unit buildings).
Forward outlook
- Local home prices are declining (-3.0%/yr); year-one equity from $726 of loan paydown is wiped out by about $3k of value loss. Plan a longer hold.
- Cameron County population projected at +3% by 2050 — modest demand growth; plan on rents tracking national, not racing it.
Negotiation context
- It's been on market 43 days — a 3% lower offer ($102k) is reasonable based on typical stale-listing flexibility.
- 2 sale attempts with the ask held roughly flat each time — persistent listings suggest the price (not the market) is what's stuck; bring a comps-based counter.
Risks & watch-outs
- Climate carrying-cost: severe wind risk, 99% chance of damaging wind over 30y; extreme-heat days projected 7→24/yr by 2055 (HVAC capex compounding) — expect insurance premiums to compound above CPI over the hold.
Questions for the listing agent
- It's been on market 43 days. Have you received any prior offers? Is the seller open to a 3% concession, seller financing, or rate buy-down credit?
- Is there a deadline driving the sale (1031 exchange, divorce, estate, relocation)? That informs how much negotiation room exists.
- Schools are D-rated, which usually means shorter tenancies and higher turnover. Who's the typical renter profile here, and what's been the actual vacancy rate?
- What's the average days-on-market for RENTAL listings here right now (not sales)? A rising rental-DOM trend means longer vacancies and softer asking-rent achievability than the comps imply.
- What's the recent tenant-quality profile in this submarket — average credit score on applications, eviction rate, late-payment / NSF rate, and stable-employment percentage? A property-management company in the area should have these aggregated.
- How much new for-sale + rental construction is in the pipeline within 1–3 miles? Heavy new supply typically softens prices + rents 12–24 months out; constrained supply supports both.
Investment metrics
- 1% rule
- 0.99% ✗
- Cap rate
- 7.86%
- Cash-on-cash
- 5.58%
- DSCR
- 1.25
- GRM
- 8.4
CMA / ARV
- ARV (median comp)
- $119,561
- List price
- $105,000
- Delta
- -12.18%
- Verdict
- UNDERPRICED
- Comps
- 2 within 2.0 mi
Projected returns pro-forma
-3.0% appreciation · 3.0% rent growth · sell at horizon
- IRR
- -7.7%
- Equity multiple
- 0.72×
- Total profit
- $-8,317
- Equity at exit
- $15,656
- IRR
- 1.9%
- Equity multiple
- 1.13×
- Total profit
- $3,926
- Equity at exit
- $9,078
Cash invested: $29,400 (down + closing). Projections, not guarantees.
Landlord ↔ Tenant lean methodology
- Overall (STATE)
- 87 Strongly Landlord-Friendly
- State Texas
- 87 Strongly Landlord-Friendly · R+5
- County
- — inherits STATE
- City
- — inherits STATE
ZIP-level market 78586
- Home prices YoY
- -24.9%
- Active inventory
- 441
- Price-to-rent
- 8.4×
Monthly cashflow live
- Estimated rent
- $1,037 medium interval (Pro) →
- Mortgage (P&I)
- −$551
- Tax from tax record
- −$88 /mo · $1,054/yr
- Insurance
- −$44
- HOA
- −$0
- Vacancy / Maint / Mgmt
- −$218
- Net cashflow
- $137
Break-even live
UW: 25.0% down · 7.5% · 30yr · 1.5% tax · 5.0% vac · 8.0% maint · 8.0% mgmt
Financing live
Cash to close
- Down payment
- $26,250
- Closing costs
- $3,150
- Reserves months
- —
- Total cash needed
- —
Loan-product check · same deal, 3 products live
Conventional
25% down · 7.5% · 30yr
- Down + closing
- —
- Monthly P&I
- —
- Monthly cashflow
- —
- DSCR
- —
- Eligible?
- —
Personal DTI + credit; lowest rate.
DSCR
20% down · 8.5% · 30yr
- Down + closing
- —
- Monthly P&I
- —
- Monthly cashflow
- —
- DSCR
- —
- Eligible?
- —
No personal income docs; deal must DSCR.
Hard money
10% down · 12.0% · 12mo
- Down + closing
- —
- Monthly P&I
- —
- Monthly cashflow
- —
- DSCR
- —
- Eligible?
- —
Short-term bridge; refi at stabilization.
Listing history 21 events
-
2026-06-18days on market $105,000 Active 43 DOM
-
2026-06-17days on market $105,000 Active 42 DOM
-
2026-06-16days on market $105,000 Active 41 DOM
-
2026-06-15days on market $105,000 Active 40 DOM
-
2026-06-14days on market $105,000 Active 38 DOM
-
2026-06-10days on market $105,000 Active 35 DOM
-
2026-06-09days on market $105,000 Active 34 DOM
-
2026-06-08days on market $105,000 Active 33 DOM
-
2026-06-07days on market $105,000 Active 32 DOM
-
2026-06-03days on market $105,000 Active 28 DOM
-
2026-06-02days on market $105,000 Active 27 DOM
-
2026-06-01days on market $105,000 Active 26 DOM
-
2026-05-31days on market $105,000 Active 25 DOM
-
2026-05-30days on market $105,000 Active 24 DOM
-
2026-05-06$105,000 Active 384-char remark
-
2026-02-06price $105,000
-
2026-02-06price $105,000
-
2025-07-25price $115,000
-
2025-07-25price $115,000
-
2025-06-12$120,000 Active
-
2025-04-10soldstatus
ⓘ Source: listings_history table (triggers on properties + properties_extension) + one-shot
backfill from property_details.listing_events for pre-trigger history.
Tax reassessment forecast TX · Resets to sale price
- Current annual tax
- $1,054 · $88/mo
- Projected year-2 tax
- $1,922 · $160/mo
- Expected delta
- +$868/yr (+$72/mo · 82.3%)
ⓘ Screening estimate from a state-policy table — verify with the county assessor before closing.
Climate risk First Street
- Flood 3/10 Moderate FEMA zone X (unshaded) · 10% chance over 30 yrs
- Wildfire 2/10 Low
- Heat 9/10 Extreme 7 d/yr ≥110°F today · 24 d/yr by 30 yrs out
- Wind 9/10 Extreme 99% chance of damaging wind over 30 yrs
- Air quality 2/10 Low 1 unhealthy d/yr today · 1 by 30 yrs out
Nearby sold comps map
Loading sold comps map…
Walkable amenities ~0.75 mi
Loading nearby amenities…
Taxation est. · year 1
- Rental income
- $12,439
- − Mortgage interest
- −$5,882
- − Property taxes
- −$1,054
- − Insurance
- −$525
- − Repairs & maintenance
- −$995
- − Management
- −$995
- − Depreciation
- −$3,055
- Taxable loss
- −$66
- Est. tax savings @ 24.0%
- +$16
- After-tax cash flow
- $1,657/yr
For passive investors: Depreciation is non-cash, so a rental often shows a tax loss while cash-flowing — sheltering income. Rental losses are passive: they offset passive income freely, and up to $25,000/yr can offset ordinary (W-2) income if you actively participate and your MAGI is under $100k (phasing out to $0 by $150k); unused losses carry forward. On sale, claimed depreciation is recaptured at up to 25%, and gains may owe capital-gains tax (a 1031 exchange can defer both). Figures are a year-1 estimate at your 24.0% rate — not tax advice; consult a CPA.
Schools (NCES district)
- District
- San Benito CISD
- NCES district ID
- 4838790
- Math proficiency
- 14% ▼ -31.00%
- Reading proficiency
- 27% ▼ -10.00%
- Median HH income
- $29,403
- Composite
- 16.31/100
- National rank
- #9212
- State rank
- #782 of 826 in TX
Livability — San Benito
- Score
- 66/100
- State rank
- #621
- US rank
- #11846
Category grades
Schools grade is shown separately in the Schools card above.
Census & demographics
- Population (ZIP)
- 49,103
Population outlook (Cameron County) Hauer SSP2
- Today (2025)
- 441,603 people
- By 2030
- 448,113 · +1.5%
- By 2040
- 456,385 · +3.3%
- By 2050
- 456,294 · +3.3%
- By 2075
- 423,851 · -4.0%
- By 2100
- 342,787 · -22.4%
Race, ethnicity, and origin ACS 2023
- Neighborhood character
- Predominantly Hispanic (93%)
- Race & ethnicity
- Hispanic / Latino 93% Two or more races 42% White 6%
- Hispanic origin (detail)
- Mexican 90%
- Foreign-born
- 23% · Canada
- Languages at home
- 29% English-only · Spanish 70%
Political lean MEDSL · Cameron
- 2024 margin
- Lean R (+5.8) · D 46.7% · R 52.5%
- 2008→2024 swing
- -34.6pp toward R · 2008: 28.8pp · 2024: -5.8pp
- All cycles
- 2024: R+5.8 2020: D+13.2 2016: D+32.5 2012: D+32.4 2008: D+28.8
Not yet ingested
- Civics
- —
Market trends
- HPI YoY
- ▼ -62.37%
- Current HPI
- 188.147
- Rent YoY
- —
- Metro
- —
- State GDP YoY
- ▲ 3.95%
- F500 in state
- 110
Industry mix (Fortune 500 HQ in TX)
| Industry | F500 HQs | Revenue |
|---|---|---|
| Energy | 16 | $1,198B |
|
||
| Technology | 5 | $198B |
|
||
| Engineering / Construction | 4 | $72B |
|
||
| Energy Services | 3 | $60B |
|
||
| Utilities | 3 | $41B |
|
||
| Healthcare | 2 | $330B |
|
||
Price history
-12.5% since first listed7 events — show timeline
- 2026-05-06 Listed $105,000 RGVMLS
- 2026-02-06 Price Changed $105,000 RGVMLS
- 2026-02-06 Price Changed $105,000 MCALLENMLS
- 2025-07-25 Price Changed $115,000 RGVMLS
- 2025-07-25 Price Changed $115,000 MCALLENMLS
- 2025-06-12 Listed $120,000 MCALLENMLS
- 2025-04-10 Sold (Public Records) — Public Records
Property tax history
+5.5%/yrLatest (2025): $1,054 · +20.5% YoY. Source: county tax records.
Cash-flow waterfall
monthlySold comps — $/sqft
last 12 mo · ≤1 miLoading sold comps…