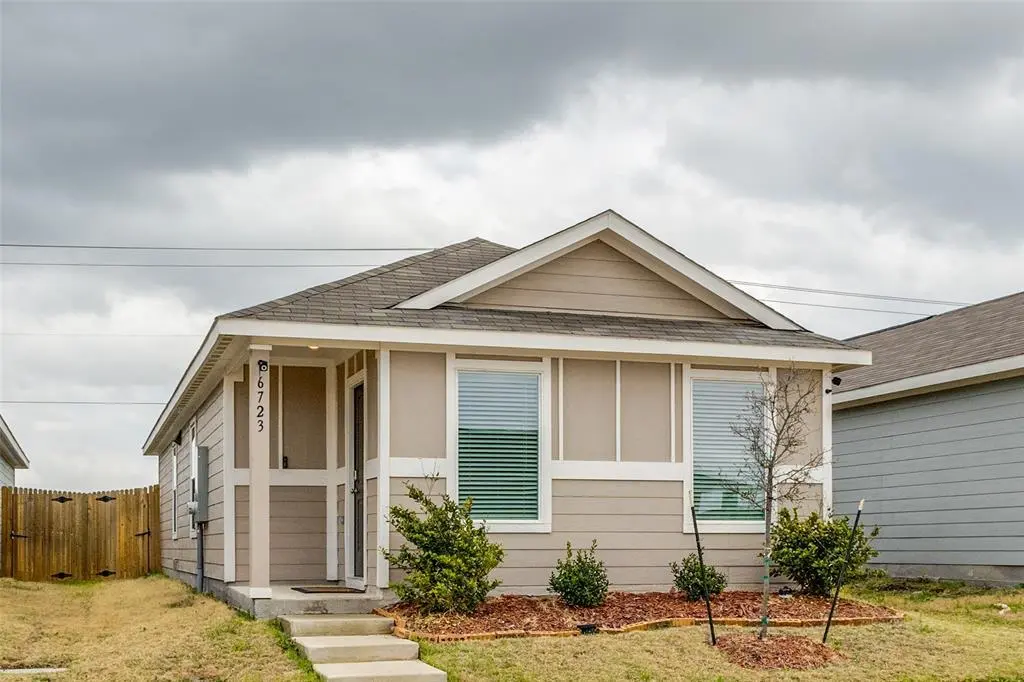
6723 Coulter Dr · Wylie, TX
Flood risk 1/10 · Minimal
- FEMA flood zone
- X (unshaded)
- Chance of flooding over 30 yrs
- 0.0%
- Est. flood insurance / yr
- $507 – $1,088
Fire risk 4/10 · Minor
- Est. fire insurance / yr
- $1,222 – $2,270
Heat risk 8/10 · Major
- Hot days now (above 110°F)
- 8 days/yr
- Hot days in 30 yrs
- 26 days/yr
Wind risk 6/10 · Moderate
- Chance of severe wind over 30 yrs
- 27.0%
Air-quality risk 3/10 · Minor
- Unhealthy air days now
- 3 days/yr
- Unhealthy air days in 30 yrs
- 3 days/yr
Risk factors via First Street. Map © Google.
Why this score? — see what drove the F grade
The composite is a weighted blend of 9 inputs, each scored 0–100. Each bar is that input's sub-score; the figure is the points it added to the 100-point composite (weight × sub-score).
- Cash flow +12.5/30.0
- 1% rule +4.4/10.0
- Schools +4.2/10.0
- Condition / age +4.0/5.0
- DSCR +3.7/10.0
- Livability +3.5/5.0
- Rent growth +2.2/5.0
- ARV discount +0.1/15.0
- Appreciation +0.0/10.0
$205,000
🖨 Deal sheet (PDF) 📄 Offer letter ✓ Due diligence
Listing remarks
Welcome to this beautifully maintained and lightly lived-in home in the rapidly growing community of Princeton. Built in 2023, this charming 3-bedroom, 2-bath residence offers approximately 1,017 square feet of thoughtfully designed living space, maximizing comfort, functionality, and modern style. The open-concept floor plan creates a bright and inviting atmosphere, seamlessly connecting the living, dining, and kitchen areas—perfect for both everyday living and entertaining. The well-appointed kitchen features modern finishes, ample cabinet space, and a layout designed to keep you connected with family and guests. Step outside and enjoy the newly added backyard patio, creating the pe
Key facts
- Manageable yard
- 3,311 sq ft lot
- Built 2023
Tags
Property features AI
Finance
- Other: Property type: Residential; Property sub-type: Single Family Residence; Subdivision: Tillage Farms Ph 1
- HOA & community: Mandatory association; Annual HOA fee; HOA covers internet; HOA managed by Insight Association
Exterior
- Parking: On-site parking; On-street parking
- Security: Carbon monoxide detector(s); Audio and video consent/notice for recording (visitors/surveillance)
- Utilities: City water; City sewer; Not in a municipal utility district
- Home design: Single family residence; One story; Not attached (detached); Pet restrictions
- Construction: Built in 2023; Board & batten siding and other siding; Slab foundation; Composition shingle roof
- Exterior features: Sidewalk; Community mailbox
Interior
- Kitchen: Dishwasher; Electric cooktop; Electric oven; Microwave; Electric water heater
- Bedrooms: 3 bedrooms (Primary bedroom on level 1)
- Flooring: Carpet; Tile
- Bathrooms: 2 full bathrooms
- Heating & cooling: Smart home features (controls)
- Interior features: Open floorplan; Granite counters; Smart home system; Walk-in closet(s); One living area; One dining area; Room count: 2
- Laundry & utility: Dryer
Neighborhood map
What this means for you Summary
Snapshot
- This is a 4-bed/2.0-bath single-family listed at $205k. Condition is rated good.
Deal economics
- At list price, monthly cash flow is $-29 ($-347/yr) — negative.
- To cash-flow at today's rent, offer at most $200k (2.5% below list).
- To meet the 1% rule (rent ≥ 1% of price), the offer needs to be $193k (6.0% below list).
- Recommended offer: $193k (6.0% below list) — sets the bar for 1% rule.
- Cap rate 6.1% vs local median 4.0% in Wylie — top-decile yield for the area; either an underpriced asset or a hidden risk that comps aren't pricing in. Stress-test before assuming the spread holds.
Location & tenants
- Location reads 69/100 on livability (#419 in TX) — a middle-class / working-renter tenant base. Strengths: crime A+, employment A+, housing A+; Watch: amenities F, commute F, health & safety F.
- Princeton ISD (suburban): math 51% / reading 47% proficiency, ranked #188 of 826 in TX (top 23%) — families likely to look elsewhere, expect single-tenant / working-renter base with shorter leases.
- Zoned schools: Harper El (math 50% / reading 41%, grade D-, #1,112 of 4,322 statewide, top 26%, 436 students, 56% FRL); Clark Middle (math 53% / reading 42%, grade C-, #408 of 1,662 statewide, top 25%, 707 students, 66% FRL); Princeton H S (math 52% / reading 54%, grade C-, #437 of 1,632 statewide, top 27%, 1,521 students, 57% FRL) — zoned schools at 60% FRL track the district average.
- Market conditions: Rents soft (-1.0%/yr); 1410 active listings in the ZIP; 40 comparable units currently listed for rent nearby; rentals at typical pace (median 27d on market — plan ~3-4 weeks tenant-placement turnaround); 40% of comp listings sitting > 30 days — soft ceiling on asking rent; solid renter incomes; 19,194 units permitted in Collin County in 2024 (3,988 in 5+ unit buildings).
Forward outlook
- Local home prices are declining (-3.0%/yr); year-one equity from $1k of loan paydown is wiped out by about $6k of value loss. Plan a longer hold.
- Collin County population projected at +60% by 2050 — long-run rental-demand tailwind backs the buy-and-hold thesis.
Negotiation context
- Only 12 days on market — expect competitive offers; lowballing is unlikely to land.
- 2 sale attempts with the ask held roughly flat each time — persistent listings suggest the price (not the market) is what's stuck; bring a comps-based counter.
Risks & watch-outs
- Climate carrying-cost: major wind risk, 27% chance of damaging wind over 30y; extreme-heat days projected 8→26/yr by 2055 (HVAC capex compounding) — expect insurance premiums to compound above CPI over the hold.
Questions for the listing agent
- What do current leases actually rent for vs. the listed asking? Can we see a recent rent roll and the last 12 months of T-12 income?
- What does the HOA fee cover, when was the last increase, and are there any pending special assessments or reserve-fund shortfalls?
- Is there a deadline driving the sale (1031 exchange, divorce, estate, relocation)? That informs how much negotiation room exists.
- Schools are B-rated — typically a magnet for longer-tenancy family renters. What's the average tenant stay here, and is there a school-zone premium baked into asking?
- The area grade is low — what's the realistic commute time and amenity access for the typical tenant pool here? Any planned neighborhood developments (good or bad) we should know about?
- What's the average days-on-market for RENTAL listings here right now (not sales)? A rising rental-DOM trend means longer vacancies and softer asking-rent achievability than the comps imply.
- What's the recent tenant-quality profile in this submarket — average credit score on applications, eviction rate, late-payment / NSF rate, and stable-employment percentage? A property-management company in the area should have these aggregated.
- How much new for-sale + rental construction is in the pipeline within 1–3 miles? Heavy new supply typically softens prices + rents 12–24 months out; constrained supply supports both.
Investment metrics
- 1% rule
- 0.94% ✗
- Cap rate
- 6.12%
- Cash-on-cash
- -0.61%
- DSCR
- 0.97
- GRM
- 8.9
CMA / ARV
- ARV (on-the-fly)
- $176,114
- Comps found
- 12
Show comp detail 12 sales within ~0.75 mi
| Address | Dist | Beds/Ba | Sqft | Sold | Price | $/sf | Match |
|---|---|---|---|---|---|---|---|
| 114 Sunflower St | 0.03mi | 3/2.0 (-1) | 1,018 (0%) | 15mo | $200,000 | $196 | 81 |
| 154 Herman Ln | 0.13mi | 3/2.0 (-1) | 1,017 (-0%) | 10mo | $199,999 | $197 | 81 |
| 125 Jethro Ln | 0.10mi | 3/2.0 (-1) | 1,033 (+2%) | 17mo | $164,900 | $160 | 74 |
| 6827 Coulter Dr | 0.09mi | 3/2.0 (-1) | 1,033 (+2%) | 18mo | $179,999 | $174 | 73 |
| 205 Jethro Ln | 0.13mi | 3/2.0 (-1) | 1,017 (-0%) | 19mo | $157,999 | $155 | 73 |
| 115 Sesame Ln | 0.14mi | 3/2.0 (-1) | 1,017 (-0%) | 19mo | $180,999 | $178 | 73 |
| 142 Sunflower St | 0.07mi | 3/2.0 (-1) | 1,162 (+14%) | 15mo | $204,995 | $176 | 56 |
| 6639 Coulter Dr | 0.04mi | 3/2.0 (-1) | 1,155 (+14%) | 18mo | $199,500 | $173 | 56 |
| 201 Jethro Ln | 0.12mi | 3/2.0 (-1) | 1,155 (+14%) | 18mo | $191,999 | $166 | 52 |
| 118 Sesame Ln | 0.11mi | 3/2.0 (-1) | 1,155 (+14%) | 20mo | $193,839 | $168 | 51 |
| 111 Sesame Ln | 0.14mi | 3/2.0 (-1) | 1,155 (+14%) | 19mo | $187,999 | $163 | 50 |
| 221 Jethro Ln | 0.15mi | 3/2.0 (-1) | 1,155 (+14%) | 19mo | $189,999 | $165 | 50 |
Match score weights: distance 35% · size 25% · config 20% · recency 20%. Top-matched comps best support the ARV.
Projected returns pro-forma
-3.0% appreciation · 0.0% rent growth · sell at horizon
- IRR
- -21.0%
- Equity multiple
- 0.29×
- Total profit
- $-40,597
- Equity at exit
- $30,566
- IRR
- -24.5%
- Equity multiple
- -0.03×
- Total profit
- $-59,091
- Equity at exit
- $17,725
Cash invested: $57,400 (down + closing). Projections, not guarantees.
Landlord ↔ Tenant lean methodology
- Overall (STATE)
- 87 Strongly Landlord-Friendly
- State Texas
- 87 Strongly Landlord-Friendly · R+5
- County
- — inherits STATE
- City
- — inherits STATE
ZIP-level market 75407
- Home prices YoY
- -30.3%
- Rents YoY
- -1.0%
- Active inventory
- 1410
- Price-to-rent
- 8.9×
Monthly cashflow live
- Estimated rent
- $1,926 high interval (Pro) →
- Mortgage (P&I)
- −$1,075
- Tax from tax record
- −$348 /mo · $4,181/yr
- Insurance
- −$85
- HOA
- −$42
- Vacancy / Maint / Mgmt
- −$405
- Net cashflow
- $-29
Break-even live
Sensitivity live
| Price | -10% $87 | -5% $29 | +0% $-29 | +5% $-87 | +10% $-145 |
|---|---|---|---|---|---|
| Rent | -10% $-181 | -5% $-105 | +0% $-29 | +5% $47 | +10% $123 |
| Rate | -1.0pp $74 | -0.5pp $23 | base $-29 | +0.5pp $-82 | +1.0pp $-136 |
UW: 25.0% down · 7.5% · 30yr · 1.5% tax · 5.0% vac · 8.0% maint · 8.0% mgmt
Financing live
Cash to close
- Down payment
- $51,250
- Closing costs
- $6,150
- Reserves months
- —
- Total cash needed
- —
Loan-product check · same deal, 3 products live
Conventional
25% down · 7.5% · 30yr
- Down + closing
- —
- Monthly P&I
- —
- Monthly cashflow
- —
- DSCR
- —
- Eligible?
- —
Personal DTI + credit; lowest rate.
DSCR
20% down · 8.5% · 30yr
- Down + closing
- —
- Monthly P&I
- —
- Monthly cashflow
- —
- DSCR
- —
- Eligible?
- —
No personal income docs; deal must DSCR.
Hard money
10% down · 12.0% · 12mo
- Down + closing
- —
- Monthly P&I
- —
- Monthly cashflow
- —
- DSCR
- —
- Eligible?
- —
Short-term bridge; refi at stabilization.
Rent comps 40 comps
| Address | Beds | Baths | Sqft | Rent | $/sqft | DOM | Units | Dist |
|---|---|---|---|---|---|---|---|---|
| 6739 Coulter Dr Princeton, TX | 3.0 | 2.0 | 1155 | $1,500 | $1.30 | 45d | 1 | 0.03mi |
| 6723 Coulter Dr Princeton, TX | 3.0 | 2.0 | 1018 | $1,500 | $1.47 | 45d | 1 | 0.03mi |
| 119 Sunflower St Princeton, TX | 4.0 | 2.0 | 1300 | $1,999 | $1.54 | 14d | 1 | 0.07mi |
| 150 Sunflower St Princeton, TX | 3.0 | 2.0 | 1017 | $1,899 | $1.87 | 7d | 1 | 0.11mi |
| 145 Jethro Ln Princeton, TX | 3.0 | 2.0 | 1033 | $1,499 | $1.45 | 26d | 1 | 0.12mi |
| 152 Thresher Ln Princeton, TX | 4.0 | 2.0 | 1300 | $1,750 | $1.35 | 14d | 1 | 0.13mi |
| 206 Sunflower St Princeton, TX | 3.0 | 2.0 | 1155 | $1,475 | $1.28 | 22d | 1 | 0.15mi |
| 211 Herman Ln Princeton, TX | 4.0 | 2.0 | 1295 | $1,595 | $1.23 | 45d | 1 | 0.16mi |
| 151 Sesame Ln Princeton, TX | 4.0 | 2.0 | 1299 | $1,634 | $1.26 | 26d | 1 | 0.16mi |
| 230 Sunflower St Princeton, TX | 4.0 | 2.0 | 1300 | $1,520 | $1.17 | 1d | 1 | 0.18mi |
| 252 Jethro Ln Princeton, TX | 4.0 | 2.0 | 1300 | $1,595 | $1.23 | 45d | 1 | 0.19mi |
| 6550 August Dr Princeton, TX | 3.0 | 2.0 | 1407 | $1,695 | $1.20 | 6d | 1 | 0.20mi |
| 6561 Alfalfa St Princeton, TX | 3.0 | 2.0 | 1436 | $1,599 | $1.11 | 45d | 1 | 0.20mi |
| 241 Thresher Ln Princeton, TX | 4.0 | 2.0 | 1295 | $1,850 | $1.43 | 26d | 1 | 0.20mi |
| 6808 Sunbeam Cir Princeton, TX | 3.0 | 2.0 | 1155 | $1,534 | $1.33 | 24d | 1 | 0.21mi |
| 6445 Middlebury Dr Princeton, TX | 3.0 | 2.0 | 1266 | $1,649 | $1.30 | 9d | 1 | 0.28mi |
| 6751 Highlands St Princeton, TX | 3.0 | 2.0 | 1411 | $1,639 | $1.16 | 19d | 1 | 0.29mi |
| 214 Wheatgrass Ln Princeton, TX | 3.0 | 2.0 | 1407 | $1,699 | $1.21 | 45d | 1 | 0.31mi |
| 321 Tall Cedar Way Princeton, TX | 3.0 | 3.0 | 1468 | $1,725 | $1.18 | 45d | 1 | 0.34mi |
| 402 Harvest St Princeton, TX | 3.0 | 2.0 | 1433 | $1,665 | $1.16 | 14d | 1 | 0.38mi |
| 6111 Shearwater Rd , TX | 3.0 | 2.0 | 1392 | $1,900 | $1.36 | 1d | 1 | 0.39mi |
| 134 Harvest St Princeton, TX | 3.0 | 2.0 | 1440 | $1,825 | $1.27 | 20d | 1 | 0.39mi |
| 7020 Vining DR Princeton, TX | 3.0 | 2.5 | 1382 | $1,850 | $1.34 | 26d | 1 | 0.44mi |
| 545 Holleman Dr Princeton, TX | 3.0 | 2.0 | 1474 | $1,750 | $1.19 | 45d | 1 | 0.52mi |
| 538 Montclair Ave Princeton, TX | 3.0 | 2.0 | 1260 | $1,775 | $1.41 | 12d | 1 | 0.52mi |
| 6744 Teal Cir Princeton, TX | 3.0 | 2.0 | 1474 | $1,790 | $1.21 | 22d | 1 | 0.54mi |
| 416 Finch CIR Princeton, TX | 3.0 | 2.0 | 1266 | $1,350 | $1.07 | 45d | 1 | 0.55mi |
| 613 Holleman Dr , TX | 3.0 | 2.0 | 1260 | $1,800 | $1.43 | 1d | 1 | 0.57mi |
| 619 Fisher Ln Princeton, TX | 3.0 | 2.0 | 1260 | $1,600 | $1.27 | 45d | 1 | 0.60mi |
| 600 Sandhill Crane Ln Princeton, TX | 3.0 | 2.0 | 1402 | $2,100 | $1.50 | 14d | 1 | 0.67mi |
| 241 Boxberry Way Princeton, TX | 3.0 | 2.0 | 1411 | $1,725 | $1.22 | 45d | 1 | 0.72mi |
| 143 Plumcove Dr Princeton, TX | 3.0 | 3.0 | 1376 | $2,150 | $1.56 | 45d | 1 | 0.74mi |
| 6222 Sandpiper Ln Unit NA Princeton, TX | 3.0 | 2.5 | 1400 | $1,750 | $1.25 | 9d | 1 | 0.82mi |
| 724 Wagtail Dr Princeton, TX | 3.0 | 2.5 | 1360 | $1,650 | $1.21 | 1d | 1 | 0.87mi |
| 724 Wagtail Dr Princeton, TX | 3.0 | 2.5 | 1360 | $1,675 | $1.23 | 5d | 1 | 0.87mi |
| 812 Sandhill Crane Ln Princeton, TX | 3.0 | 2.5 | 1309 | $1,850 | $1.41 | 45d | 1 | 0.89mi |
| 803 Wagtail Dr , TX | 3.0 | 2.5 | 1360 | $1,605 | $1.18 | 24d | 1 | 0.90mi |
| 623 Linden Rd Princeton, TX | 3.0 | 2.5 | 1419 | $1,650 | $1.16 | 45d | 1 | 0.90mi |
| 6313 Kingfisher Way Princeton, TX | 3.0 | 3.0 | 1360 | $1,650 | $1.21 | 45d | 1 | 0.93mi |
| 5825 Rockrose Ln Princeton, TX | 3.0 | 2.0 | 1440 | $1,780 | $1.24 | 45d | 1 | 0.94mi |
HOA detail
- Monthly dues
- $42 · $504/yr
Listing history 9 events
-
2026-06-21days on market $205,000 Active 12 DOM
-
2026-06-18days on market $205,000 Active 9 DOM
-
2026-06-17days on market $205,000 Active 8 DOM
-
2026-06-16days on market $205,000 Active 7 DOM
-
2026-06-15days on market $205,000 Active 6 DOM
-
2026-06-13days on market $205,000 Active 4 DOM
-
2026-06-13days on market $205,000 Active 3 DOM
-
2026-06-10remarks 693-char remark
-
2026-06-10$205,000 Active 1 DOM
ⓘ Source: listings_history table (triggers on properties + properties_extension) + one-shot
backfill from property_details.listing_events for pre-trigger history.
Tax reassessment forecast TX · Resets to sale price
- Current annual tax
- $4,181 · $348/mo
- Projected year-2 tax
- $4,181 · $348/mo
- Expected delta
- $0/yr ($0/mo · 0.0%)
ⓘ Screening estimate from a state-policy table — verify with the county assessor before closing.
Climate risk First Street
- Flood 1/10 Low FEMA zone X (unshaded) · 0% chance over 30 yrs
- Wildfire 4/10 Moderate
- Heat 8/10 Severe 8 d/yr ≥110°F today · 26 d/yr by 30 yrs out
- Wind 6/10 Major 27% chance of damaging wind over 30 yrs
- Air quality 3/10 Moderate 3 unhealthy d/yr today · 3 by 30 yrs out
Nearby sold comps map
Loading sold comps map…
Walkable amenities ~0.75 mi
Loading nearby amenities…
Taxation est. · year 1
- Rental income
- $23,118
- − Mortgage interest
- −$11,483
- − Property taxes
- −$4,181
- − Insurance
- −$1,025
- − Repairs & maintenance
- −$1,849
- − Management
- −$1,849
- − HOA
- −$504
- − Depreciation
- −$5,964
- Taxable loss
- −$3,738
- Est. tax savings @ 24.0%
- +$897
- After-tax cash flow
- $550/yr
For passive investors: Depreciation is non-cash, so a rental often shows a tax loss while cash-flowing — sheltering income. Rental losses are passive: they offset passive income freely, and up to $25,000/yr can offset ordinary (W-2) income if you actively participate and your MAGI is under $100k (phasing out to $0 by $150k); unused losses carry forward. On sale, claimed depreciation is recaptured at up to 25%, and gains may owe capital-gains tax (a 1031 exchange can defer both). Figures are a year-1 estimate at your 24.0% rate — not tax advice; consult a CPA.
Condition & rehab AI · 12 photos
This well-maintained, 2023-built home in Princeton offers a good condition with a good ROI potential for both resale and rental.
Value-add opportunities
- Resale Paint exterior — Enhances curb appeal and value
- Resale Replace shutters — Improves home's aesthetic and value
- Both Install new flooring — Modernizes interior and improves rental appeal
- Both Update kitchen cabinets — Enhances functionality and rental appeal
Renovation cost estimate screening
Value-add ROI direction
- Resale Paint exterior — Enhances curb appeal and value ↑
- Resale Replace shutters — Improves home's aesthetic and value ↑
- Both Install new flooring — Modernizes interior and improves rental appeal ↑
- Both Update kitchen cabinets — Enhances functionality and rental appeal ↑
ⓘ Cost ranges are severity-bucket heuristics (US national rule-of-thumb). Get contractor quotes + a written scope before underwriting a rehab budget.
Schools (NCES district)
- District
- Princeton ISD
- NCES district ID
- 4835850
- Math proficiency
- 51% ▼ -8.00%
- Reading proficiency
- 47% ▬ 0.00%
- Median HH income
- $54,827
- Composite
- 42.44/100
- National rank
- #3226
- State rank
- #188 of 826 in TX
Livability — Wylie
- Score
- 69/100
- State rank
- #419
- US rank
- #8623
Category grades
Schools grade is shown separately in the Schools card above.
Census & demographics
- County
- Collin County · 1,159,394 people
- City population
- 69,325
- Metro
- Dallas-Fort Worth-Arlington, TX
- Population (ZIP)
- 34,171
- Household income
- $100,037
- Rent vs Own
- Severe rent burden
- 368.0
Population outlook (Collin County) Hauer SSP2
- Today (2025)
- 1,210,074 people
- By 2030
- 1,358,201 · +12.2%
- By 2040
- 1,654,061 · +36.7%
- By 2050
- 1,937,359 · +60.1%
- By 2075
- 2,567,039 · +112.1%
- By 2100
- 2,952,048 · +144.0%
Race, ethnicity, and origin ACS 2023
- Neighborhood character
- Diverse neighborhood (Simpson 0.66)
- Race & ethnicity
- White 47% Hispanic / Latino 30% Black 17% Two or more races 10% Asian 4% Native American 1%
- Hispanic origin (detail)
- Mexican 26%
- Common ancestry
- Lithuanian 2% Romanian 1% Russian 1%
- Foreign-born
- 15% · Canada, China, Mexico
- Languages at home
- 70% English-only · Spanish 22% Other Indo-European 2% Other Asian/Pacific 1%
Political lean MEDSL · Collin
- 2024 margin
- R (+11.1) · D 43.1% · R 54.3% · Other 2.6%
- 2008→2024 swing
- +14.4pp toward D · 2008: -25.6pp · 2024: -11.1pp
- All cycles
- 2024: R+11.1 2020: R+4.3 2016: R+17.0 2012: R+31.6 2008: R+25.6
Not yet ingested
- Civics
- —
Market trends
- HPI YoY
- ▼ -103.99%
- Current HPI
- 238.9373
- Rent YoY
- ▼ -1.02%
- Metro
- Dallas-Fort Worth-Arlington, TX
- State GDP YoY
- ▲ 3.95%
- F500 in state
- 110
Industry mix (Fortune 500 HQ in TX)
| Industry | F500 HQs | Revenue |
|---|---|---|
| Energy | 16 | $1,198B |
|
||
| Technology | 5 | $198B |
|
||
| Engineering / Construction | 4 | $72B |
|
||
| Energy Services | 3 | $60B |
|
||
| Utilities | 3 | $41B |
|
||
| Healthcare | 2 | $330B |
|
||
Price history
+13566.7% since first listed3 events — show timeline
- 2026-06-09 Listed $205,000 NTREIS
- 2026-03-09 Listed for Rent $1,500 NTREIS
- 2023-11-27 Sold (Public Records) — Public Records
Property tax history
+164.0%/yrLatest (2025): $4,181 · -10.7% YoY. Source: county tax records.
Cash-flow waterfall
monthlySold comps — $/sqft
last 12 mo · ≤1 miLoading sold comps…