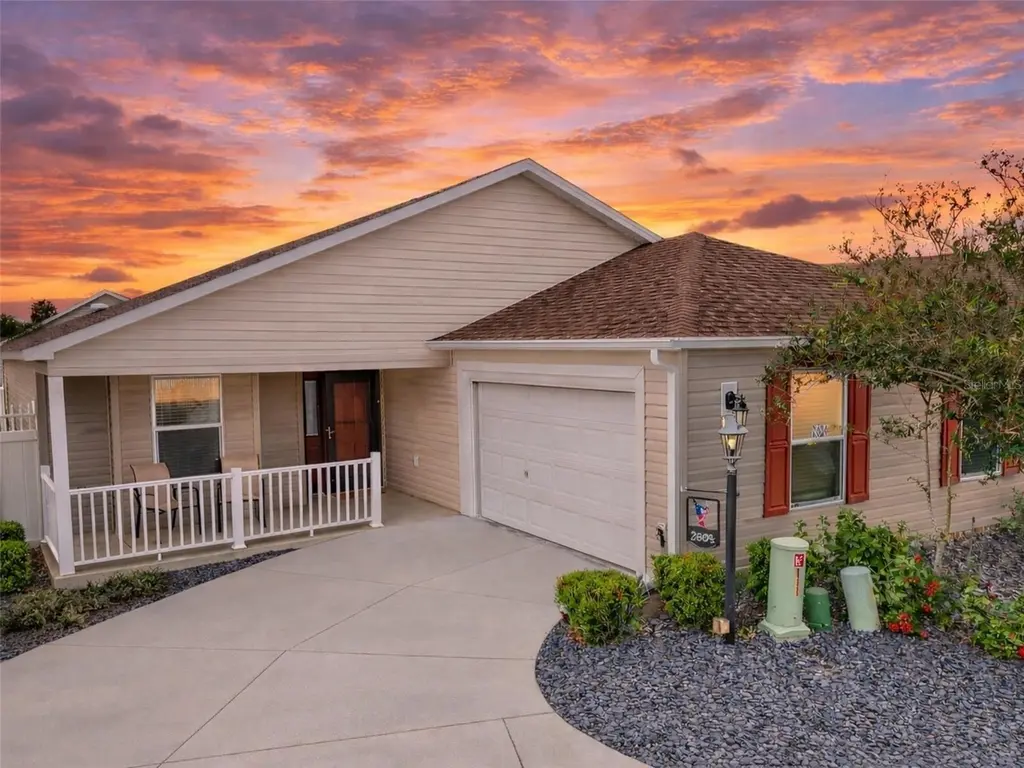
2604 Alcade Pl · The Villages, FL
Flood risk 1/10 · Minimal
- FEMA flood zone
- X (unshaded)
- Chance of flooding over 30 yrs
- 0.0%
- Est. flood insurance / yr
- $507 – $1,088
Fire risk 3/10 · Minor
- Est. fire insurance / yr
- $947 – $1,759
Heat risk 9/10 · Severe
- Hot days now (above 108°F)
- 7 days/yr
- Hot days in 30 yrs
- 23 days/yr
Wind risk 9/10 · Severe
- Chance of severe wind over 30 yrs
- 99.0%
Air-quality risk 2/10 · Minimal
- Unhealthy air days now
- 1 days/yr
- Unhealthy air days in 30 yrs
- 2 days/yr
Risk factors via First Street. Map © Google.
Why this score? — see what drove the D+ grade
The composite is a weighted blend of 9 inputs, each scored 0–100. Each bar is that input's sub-score; the figure is the points it added to the 100-point composite (weight × sub-score).
- ARV discount +15.0/15.0
- Appreciation +10.0/10.0
- Cash flow +6.9/30.0
- Schools +5.2/10.0
- Livability +3.5/5.0
- Rent growth +2.5/5.0
- Condition / age +2.5/5.0
- 1% rule +1.6/10.0
- DSCR +1.1/10.0
$389,990
🖨 Deal sheet (PDF) 📄 Offer letter ✓ Due diligence
Listing remarks
At 2604 Alcade Place, life begins to feel different the moment you arrive. Tucked inside the highly sought-after Village of Collier, within the world-renowned community of The Villages, Florida, this is where lifestyle isn’t just promised, it’s experienced every single day. Here, mornings unfold with a sense of possibility, whether it’s a peaceful coffee on the lanai or an early round of golf. Afternoons naturally turn into connection, with neighbors who become friends and a calendar that fills itself with things you actually look forward to. And as the day winds down, evenings lead you to unforgettable sunsets and the kind of energy that makes every night feel like a cele
Key facts
- Resort style pools
- Private backyard
- Screened lanai
Tags
Property features AI
Finance
- Other: Lot approximately 0.12 acres (about 0 to less than 1/4 acre); Asphalt road access
- HOA & community: CDD (community development district) present
Exterior
- Parking: Attached 2-car garage
- Utilities: Public water; Public sewer; Cable available; Broadband/High-speed internet available; Water connected; Sewer connected
- Home design: Single-family residence; One story; Faces north
- Construction: Vinyl siding; Wood frame construction; Shingle roof; Slab foundation; Built with a total building area of 2,334 square feet
- Exterior features: Outdoor lighting; Sidewalk; Sliding doors
Interior
- Kitchen: Dishwasher; Microwave; Range; Refrigerator
- Bedrooms: 3 bedrooms
- Bathrooms: 2 full bathrooms
- Heating & cooling: Central heating (electric); Central air conditioning
- Interior features: Ceiling fans; Kitchen/family room combo; Open floorplan; Solid surface counters; Thermostat
- Laundry & utility: Indoor laundry
Neighborhood map
What this means for you Summary
Snapshot
- This is a 3-bed/2.0-bath single-family listed at $390k.
Deal economics
- At list price, monthly cash flow is $-586 ($-7k/yr) — negative.
- To cash-flow at today's rent, offer at most $286k (26.6% below list).
- To meet the 1% rule (rent ≥ 1% of price), the offer needs to be $258k (33.7% below list).
- Recommended offer: $258k (33.7% below list) — sets the bar for 1% rule.
Location & tenants
- Location reads 70/100 on livability (#431 in FL) — a middle-class / working-renter tenant base. Strengths: crime A+, housing A, employment B+; Watch: amenities F, commute F, health & safety F.
- Sumter (rural): math 61% / reading 61% proficiency, ranked #11 of 73 in FL (top 15%) — acceptable for families but not a draw, mixed tenant base, ~2y average lease.
- Zoned schools: Wildwood Elementary School (math 49% / reading 52%, grade D+, #1,055 of 2,144 statewide, top 50%, 940 students, 76% FRL); South Sumter Middle School (math 55% / reading 54%, grade B-, #183 of 571 statewide, top 34%, 897 students, 61% FRL) — zoned schools average 68% FRL vs 51% district-wide (18 pts higher); higher-poverty schools than district average — tighter screening recommended.
- Market conditions: 269 active listings in the ZIP; 11 comparable units currently listed for rent nearby; rentals at typical pace (median 23d on market — plan ~3-4 weeks tenant-placement turnaround); solid renter incomes; 3,961 units permitted in Sumter County in 2024 (248 in 5+ unit buildings).
- This rent runs 32% of the median local income ($97k/yr) — at the standard rent-burdened threshold; future hikes will face affordability resistance.
Forward outlook
- In year one you build about $42k of equity ($3k loan paydown + $39k appreciation (10.0% local appreciation)).
- Sumter County population projected at +45% by 2050 — long-run rental-demand tailwind backs the buy-and-hold thesis.
- By year 2, paydown + projected appreciation supports a ~$67k cash-out refi (75% LTV) — recoverable capital for the next deal without selling this one.
Negotiation context
- It's been on market 74 days — a 6% lower offer ($367k) is reasonable based on typical stale-listing flexibility.
- Current owner paid $330k; 18% above their basis — modest negotiation headroom, anchor on the comps not their cost.
Risks & watch-outs
- Climate carrying-cost: severe wind risk, 99% chance of damaging wind over 30y; extreme-heat days projected 7→23/yr by 2055 (HVAC capex compounding) — expect insurance premiums to compound above CPI over the hold.
Questions for the listing agent
- What do current leases actually rent for vs. the listed asking? Can we see a recent rent roll and the last 12 months of T-12 income?
- It's been on market 74 days. Have you received any prior offers? Is the seller open to a 34% concession, seller financing, or rate buy-down credit?
- Why hasn't it sold? Are there any deal-killer items the seller is aware of (foundation, flood, title, zoning, code violations)?
- Is there a deadline driving the sale (1031 exchange, divorce, estate, relocation)? That informs how much negotiation room exists.
- Schools are A-rated — typically a magnet for longer-tenancy family renters. What's the average tenant stay here, and is there a school-zone premium baked into asking?
- The area grade is low — what's the realistic commute time and amenity access for the typical tenant pool here? Any planned neighborhood developments (good or bad) we should know about?
- What's the average days-on-market for RENTAL listings here right now (not sales)? A rising rental-DOM trend means longer vacancies and softer asking-rent achievability than the comps imply.
- What's the recent tenant-quality profile in this submarket — average credit score on applications, eviction rate, late-payment / NSF rate, and stable-employment percentage? A property-management company in the area should have these aggregated.
- How much new for-sale + rental construction is in the pipeline within 1–3 miles? Heavy new supply typically softens prices + rents 12–24 months out; constrained supply supports both.
Investment metrics
- 1% rule
- 0.66% ✗
- Cap rate
- 4.49%
- Cash-on-cash
- -6.44%
- DSCR
- 0.71
- GRM
- 12.6
CMA / ARV
- ARV (on-the-fly)
- $487,930
- Comps found
- 12
Show comp detail 12 sales within ~0.75 mi
| Address | Dist | Beds/Ba | Sqft | Sold | Price | $/sf | Match |
|---|---|---|---|---|---|---|---|
| 3563 Marianna Pl | 0.42mi | 3/2.0 | 1,608 (-3%) | 2mo | $465,000 | $289 | 74 |
| 3497 Oldham Ln | 0.51mi | 3/2.0 | 1,695 (+2%) | 6mo | $479,900 | $283 | 67 |
| 3412 Neaptide Path | 0.13mi | 3/2.0 | 1,890 (+14%) | 8mo | $520,000 | $275 | 64 |
| 3481 Oldham Ln | 0.51mi | 3/2.0 | 1,504 (-9%) | 2mo | $385,000 | $256 | 60 |
| 3776 E Torch Lake Dr | 0.53mi | 3/2.0 | 1,851 (+12%) | 0mo | $750,000 | $405 | 55 |
| 3493 Habersham Ct | 0.46mi | 3/2.0 | 1,446 (-13%) | 6mo | $438,000 | $303 | 53 |
| 2932 Beadle Pl | 0.56mi | 3/2.0 | 1,473 (-11%) | 4mo | $440,000 | $299 | 52 |
| 3562 Farrell Ave | 0.60mi | 3/2.0 | 1,473 (-11%) | 4mo | $435,000 | $295 | 50 |
| 3023 Charlevoix St | 0.59mi | 3/2.0 | 1,794 (+8%) | 12mo | $530,000 | $295 | 48 |
| 3709 Robertson Way | 0.46mi | 3/2.0 | 1,851 (+12%) | 19mo | $640,000 | $346 | 43 |
| 3459 Oldham Ln | 0.51mi | 3/2.0 | 1,446 (-13%) | 15mo | $420,000 | $290 | 42 |
| 3554 Marianna Pl | 0.43mi | 3/2.0 | 1,416 (-14%) | 17mo | $410,000 | $290 | 42 |
Match score weights: distance 35% · size 25% · config 20% · recency 20%. Top-matched comps best support the ARV.
Projected returns pro-forma
10.0% appreciation · 3.0% rent growth · sell at horizon
- IRR
- 19.7%
- Equity multiple
- 2.60×
- Total profit
- $175,062
- Equity at exit
- $351,334
- IRR
- 18.1%
- Equity multiple
- 5.99×
- Total profit
- $544,882
- Equity at exit
- $757,665
Cash invested: $109,197 (down + closing). Projections, not guarantees.
Landlord ↔ Tenant lean methodology
- Overall (STATE)
- 87 Strongly Landlord-Friendly
- State Florida
- 87 Strongly Landlord-Friendly · R+3
- County
- — inherits STATE
- City
- — inherits STATE
ZIP-level market 32163
- Home prices YoY
- 9.8%
- Active inventory
- 269
- Price-to-rent
- 12.6×
Monthly cashflow live
- Estimated rent
- $2,584 high interval (Pro) →
- Mortgage (P&I)
- −$2,045
- Tax from tax record
- −$420 /mo · $5,039/yr
- Insurance
- −$162
- HOA
- −$0
- Vacancy / Maint / Mgmt
- −$543
- Net cashflow
- $-586
Break-even live
Sensitivity live
| Price | -10% $-365 | -5% $-476 | +0% $-586 | +5% $-697 | +10% $-807 |
|---|---|---|---|---|---|
| Rent | -10% $-790 | -5% $-688 | +0% $-586 | +5% $-484 | +10% $-382 |
| Rate | -1.0pp $-390 | -0.5pp $-487 | base $-586 | +0.5pp $-687 | +1.0pp $-790 |
UW: 25.0% down · 7.5% · 30yr · 1.5% tax · 5.0% vac · 8.0% maint · 8.0% mgmt
Financing live
Cash to close
- Down payment
- $97,498
- Closing costs
- $11,700
- Reserves months
- —
- Total cash needed
- —
Loan-product check · same deal, 3 products live
Conventional
25% down · 7.5% · 30yr
- Down + closing
- —
- Monthly P&I
- —
- Monthly cashflow
- —
- DSCR
- —
- Eligible?
- —
Personal DTI + credit; lowest rate.
DSCR
20% down · 8.5% · 30yr
- Down + closing
- —
- Monthly P&I
- —
- Monthly cashflow
- —
- DSCR
- —
- Eligible?
- —
No personal income docs; deal must DSCR.
Hard money
10% down · 12.0% · 12mo
- Down + closing
- —
- Monthly P&I
- —
- Monthly cashflow
- —
- DSCR
- —
- Eligible?
- —
Short-term bridge; refi at stabilization.
Rent comps 11 comps
| Address | Beds | Baths | Sqft | Rent | $/sqft | DOM | Units | Dist |
|---|---|---|---|---|---|---|---|---|
| 2577 Lindewood St The Villages, FL | 2.0 | 2.0 | 1206 | $2,495 | $2.07 | 23d | 1 | 0.09mi |
| 6629 Dan DiCiolla Dr Wildwood, FL | 1.0–3.0 | 1.0–2.5 | 1075 | $2,399 | $2.23 | 23d | 44 | 0.54mi |
| 3480 Kewadin Ave The Villages, FL | 2.0 | 2.0 | 1758 | $2,500 | $1.42 | 23d | 1 | 0.58mi |
| 7011 Homestead Lp Wildwood, FL | 1.0–3.0 | 1.0–2.0 | 998 | $1,759 | $1.76 | 23d | 22 | 0.69mi |
| 3064 Gulfport Ct The Villages, FL | 2.0 | 2.0 | 1602 | $2,800 | $1.75 | 23d | 1 | 0.76mi |
| 3025 Bartow Ln The Villages, FL | 3.0 | 2.0 | 1415 | $3,500 | $2.47 | 23d | 1 | 0.83mi |
| 2910 Monument Way The Villages, FL | 2.0 | 2.0 | 1494 | $2,600 | $1.74 | 23d | 1 | 1.13mi |
| 5267 Dragonfly Dr Wildwood, FL | 3.0 | 2.5 | 1688 | $1,945 | $1.15 | 23d | 1 | 1.23mi |
| 5115 Spanish Harbor Dr Wildwood, FL | 1.0–3.0 | 1.0–2.0 | 990 | $1,680 | $1.70 | 23d | 29 | 1.29mi |
| 5339 Loblolly Ln Wildwood, FL | 3.0 | 2.5 | 1688 | $2,000 | $1.18 | 23d | 1 | 1.34mi |
| 208 Mason St Wildwood, FL | 2.0–3.0 | 1.0–2.0 | 2250 | $1,975 | $0.88 | 23d | 2 | 1.48mi |
Listing history 18 events
-
2026-06-22days on market $389,990 Active 74 DOM
-
2026-06-19days on market $389,990 Active 72 DOM
-
2026-06-18days on market $389,990 Active 71 DOM
-
2026-06-17days on market $389,990 Active 70 DOM
-
2026-06-16days on market $389,990 Active 69 DOM
-
2026-06-15days on market $389,990 Active 68 DOM
-
2026-06-14days on market $389,990 Active 66 DOM
-
2026-06-13days on market $389,990 Active 65 DOM
-
2026-06-10days on market $389,990 Active 63 DOM
-
2026-06-09days on market $389,990 Active 62 DOM
-
2026-06-08days on market $389,990 Active 61 DOM
-
2026-06-07days on market $389,990 Active 60 DOM
-
2026-06-02days on market $389,990 Active 55 DOM
-
2026-06-01days on market $389,990 Active 54 DOM
-
2026-05-31days on market $389,990 Active 53 DOM
-
2026-05-30days on market $389,990 Active 52 DOM
-
2026-04-08$399,990 Active
-
2021-09-09soldstatus $330,000
ⓘ Source: listings_history table (triggers on properties + properties_extension) + one-shot
backfill from property_details.listing_events for pre-trigger history.
Tax reassessment forecast FL · Resets to sale price
- Current annual tax
- $5,039 · $420/mo
- Projected year-2 tax
- $5,039 · $420/mo
- Expected delta
- $0/yr ($0/mo · 0.0%)
ⓘ Screening estimate from a state-policy table — verify with the county assessor before closing.
Climate risk First Street
- Flood 1/10 Low FEMA zone X (unshaded) · 0% chance over 30 yrs
- Wildfire 3/10 Moderate
- Heat 9/10 Extreme 7 d/yr ≥108°F today · 23 d/yr by 30 yrs out
- Wind 9/10 Extreme 99% chance of damaging wind over 30 yrs
- Air quality 2/10 Low 1 unhealthy d/yr today · 2 by 30 yrs out
Nearby sold comps map
Loading sold comps map…
Walkable amenities ~0.75 mi
Loading nearby amenities…
Taxation est. · year 1
- Rental income
- $31,009
- − Mortgage interest
- −$21,846
- − Property taxes
- −$5,039
- − Insurance
- −$1,950
- − Repairs & maintenance
- −$2,481
- − Management
- −$2,481
- − Depreciation
- −$11,345
- Taxable loss
- −$14,133
- Est. tax savings @ 24.0%
- +$3,392
- After-tax cash flow
- $-3,642/yr
For passive investors: Depreciation is non-cash, so a rental often shows a tax loss while cash-flowing — sheltering income. Rental losses are passive: they offset passive income freely, and up to $25,000/yr can offset ordinary (W-2) income if you actively participate and your MAGI is under $100k (phasing out to $0 by $150k); unused losses carry forward. On sale, claimed depreciation is recaptured at up to 25%, and gains may owe capital-gains tax (a 1031 exchange can defer both). Figures are a year-1 estimate at your 24.0% rate — not tax advice; consult a CPA.
Schools (NCES district)
- District
- Sumter
- NCES district ID
- 1201800
- Math proficiency
- 61% ▼ -4.00%
- Reading proficiency
- 61% ▼ -2.00%
- Median HH income
- $48,240
- Composite
- 51.74/100
- National rank
- #1682
- State rank
- #11 of 73 in FL
Livability — The Villages
- Score
- 70/100
- State rank
- #431
- US rank
- #7363
Category grades
Schools grade is shown separately in the Schools card above.
Census & demographics
- Census place
- The Villages, FL
- County
- Sumter County · 110,591 people
- City population
- 83,973
- Metro
- The Villages, FL
- Population (ZIP)
- 28,549
- Household income
- $96,775
- Rent vs Own
- Severe rent burden
- 307.0
Population outlook (Sumter County) Hauer SSP2
- Today (2025)
- 161,172 people
- By 2030
- 180,083 · +11.7%
- By 2040
- 209,892 · +30.2%
- By 2050
- 234,186 · +45.3%
- By 2075
- 284,602 · +76.6%
- By 2100
- 317,039 · +96.7%
Race, ethnicity, and origin ACS 2023
- Neighborhood character
- Predominantly White (95%)
- Race & ethnicity
- White 95% Two or more races 2% Hispanic / Latino 2% Asian 1%
- Common ancestry
- Romanian 6% Lithuanian 3% Iranian 3%
- Foreign-born
- 6% · Canada, Vietnam
- Languages at home
- 96% English-only · Spanish 2% Vietnamese 1% Other Indo-European 0%
Political lean MEDSL · Sumter
- 2024 margin
- Solid R (+37.6) · D 30.9% · R 68.6%
- 2008→2024 swing
- -10.6pp toward R · 2008: -27.0pp · 2024: -37.6pp
- All cycles
- 2024: R+37.6 2020: R+36.1 2016: R+39.2 2012: R+34.9 2008: R+27.0
Not yet ingested
- Civics
- —
Market trends
- HPI YoY
- ▲ 20.47%
- Current HPI
- 229.0075
- Rent YoY
- —
- Metro
- The Villages, FL
- State GDP YoY
- ▲ 3.28%
- F500 in state
- 36
Industry mix (Fortune 500 HQ in FL)
| Industry | F500 HQs | Revenue |
|---|---|---|
| Industrial Technology | 2 | $29B |
|
||
| Insurance | 2 | $17B |
|
||
| Retail | 1 | $60B |
|
||
| Technology Distribution | 1 | $58B |
|
||
| Homebuilding | 1 | $35B |
|
||
| Technology Manufacturing | 1 | $35B |
|
||
Price history
+21.2% since first listed2 events — show timeline
- 2026-04-08 Listed $399,990 Stellar MLS as Distributed by MLS Grid
- 2021-09-09 Sold (Public Records) $330,000 Public Records
Property tax history
+11.3%/yrLatest (2025): $5,039 · -2.1% YoY. Source: county tax records.
Cash-flow waterfall
monthlySold comps — $/sqft
last 12 mo · ≤1 miLoading sold comps…