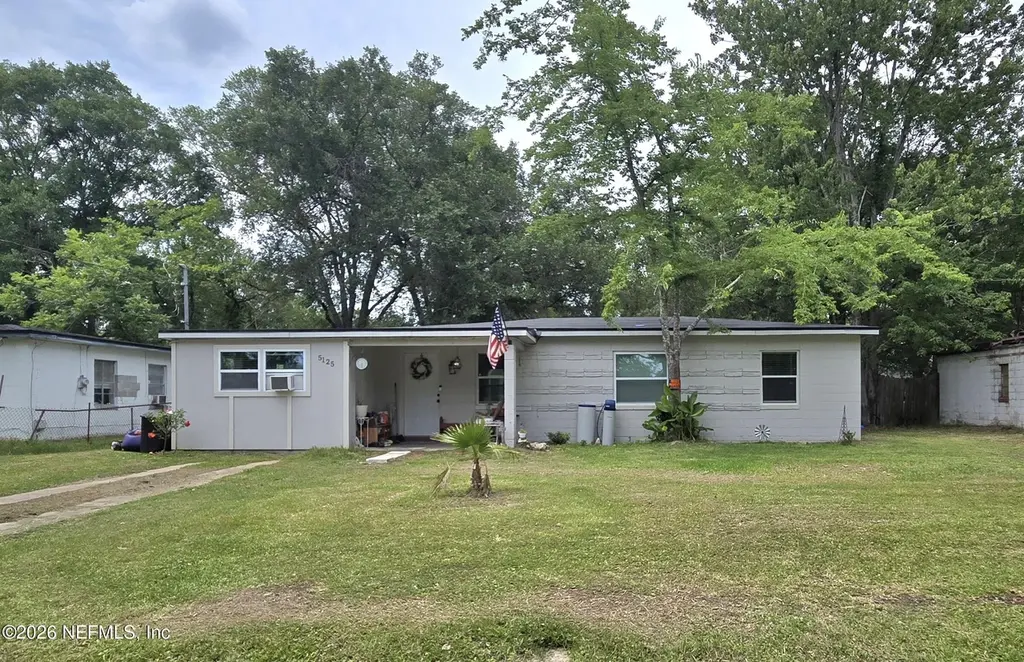
5125 Abel Ln · Jacksonville, FL
Flood risk 6/10 · Moderate
- FEMA flood zone
- X (unshaded)
- Chance of flooding over 30 yrs
- 0.71%
- Est. flood insurance / yr
- $507 – $1,088
Fire risk 2/10 · Minimal
- Est. fire insurance / yr
- $947 – $1,759
Heat risk 9/10 · Severe
- Hot days now (above 107°F)
- 7 days/yr
- Hot days in 30 yrs
- 20 days/yr
Wind risk 9/10 · Severe
- Chance of severe wind over 30 yrs
- 99.0%
Air-quality risk 5/10 · Moderate
- Unhealthy air days now
- 7 days/yr
- Unhealthy air days in 30 yrs
- 7 days/yr
Risk factors via First Street. Map © Google.
Why this score? — see what drove the D- grade
The composite is a weighted blend of 9 inputs, each scored 0–100. Each bar is that input's sub-score; the figure is the points it added to the 100-point composite (weight × sub-score).
- Cash flow +9.0/30.0
- Appreciation +6.7/10.0
- Livability +4.2/5.0
- Schools +3.9/10.0
- Rent growth +2.9/5.0
- 1% rule +2.5/10.0
- DSCR +2.5/10.0
- Condition / age +2.5/5.0
- ARV discount +1.1/15.0
$189,000
🖨 Deal sheet (PDF) 📄 Offer letter ✓ Due diligence
Listing remarks MLS
Perfectly updated 4/2 single-family home in Edgewood Heights! Thoughtfully renovated this property features an open, modern floor plan, Huge master bedroom with M/Bath with brand new LVP and tile flooring throughout hosting a Luxurious sleek kitchen complemented with custom Quartz countertops and Brand new SS appliances. Recent updates include a new Roof, Windows, Plumbing and Electrical. Have peace of mind property is on **City water and sewer - NO SEPTIC! Stylish, spacious, and move-in ready—Perfect for a growing family and just a skip away from Murry Hill and Historic Riverside nestled on a intimate street this home rests on a large private lo this property has it all ! * Bring the faimly and schedule a tour today.
Key facts
- 6,969 sq ft lot
- Built 1953
- Listed 7 days
Property features AI
Exterior
- Parking: Off-street parking
- Utilities: Public sewer; Electricity connected; Sewer connected; Water connected
- Home design: Single family residence; Two levels
- Construction: Concrete construction; Shingle roof
- Exterior features: Shed(s)
Interior
- Kitchen: Electric oven; Refrigerator
- Bedrooms: 3 bedrooms
- Bathrooms: 2 full bathrooms
- Heating & cooling: Central heating (electric); Central air conditioning
- Interior features: Ceiling fan(s); Eat-in kitchen; Primary bathroom with shower (no tub); Split bedroom layout
- Laundry & utility: Electric water heater
Neighborhood map
What this means for you Summary
Snapshot
- This is a 3-bed/1.0-bath single-family listed at $189k.
Deal economics
- At list price, monthly cash flow is $-149 ($-2k/yr) — negative.
- To cash-flow at today's rent, offer at most $163k (13.9% below list).
- To meet the 1% rule (rent ≥ 1% of price), the offer needs to be $141k (25.2% below list).
- Recommended offer: $141k (25.2% below list) — sets the bar for 1% rule.
- Cap rate 5.3% vs local median 4.0% in Jacksonville — top-decile yield for the area; either an underpriced asset or a hidden risk that comps aren't pricing in. Stress-test before assuming the spread holds.
Location & tenants
- Location reads 83/100 on livability (#50 in FL, #911 nationally) — a professional / high-income tenant draw. Strengths: amenities A+, commute A+, housing A+.
- Duval (urban): math 46% / reading 45% proficiency, ranked #48 of 73 in FL (top 66%) — families likely to look elsewhere, expect single-tenant / working-renter base with shorter leases.
- Market conditions: Rents rising (+1.7%/yr); 172 active listings in the ZIP; 40 comparable units currently listed for rent nearby; rentals at typical pace (median 24d on market — plan ~3-4 weeks tenant-placement turnaround); lower-income renter base — watch delinquency; 6,503 units permitted in Duval County in 2024 (1,131 in 5+ unit buildings).
- At $1,413/mo this rent would consume 49% of the median local household income ($35k/yr) (locally 882% of renters already pay >50% of income on rent) — very limited rent-growth headroom before tenants either downsize or default.
Forward outlook
- In year one you build about $8k of equity ($1k loan paydown + $6k appreciation (3.4% local appreciation)).
- Duval County population projected at +19% by 2050 — long-run rental-demand tailwind backs the buy-and-hold thesis.
- By year 5, paydown + projected appreciation supports a ~$34k cash-out refi (75% LTV) — recoverable capital for the next deal without selling this one.
Negotiation context
- Only 7 days on market — expect competitive offers; lowballing is unlikely to land.
- 3 sale attempts with the ask held roughly flat each time — persistent listings suggest the price (not the market) is what's stuck; bring a comps-based counter.
Risks & watch-outs
- Watch-outs: built in 1953 — expect roof / HVAC / electrical / plumbing capex.
- Climate carrying-cost: major flood risk; severe wind risk, 99% chance of damaging wind over 30y; extreme-heat days projected 7→20/yr by 2055 (HVAC capex compounding) — expect insurance premiums to compound above CPI over the hold.
Questions for the listing agent
- What do current leases actually rent for vs. the listed asking? Can we see a recent rent roll and the last 12 months of T-12 income?
- Built in 1953 — when were the roof, HVAC, electrical panel, plumbing, and water heater last replaced?
- Is there a deadline driving the sale (1031 exchange, divorce, estate, relocation)? That informs how much negotiation room exists.
- Schools are B-rated — typically a magnet for longer-tenancy family renters. What's the average tenant stay here, and is there a school-zone premium baked into asking?
- The area grade is low — what's the realistic commute time and amenity access for the typical tenant pool here? Any planned neighborhood developments (good or bad) we should know about?
- What's the average days-on-market for RENTAL listings here right now (not sales)? A rising rental-DOM trend means longer vacancies and softer asking-rent achievability than the comps imply.
- What's the recent tenant-quality profile in this submarket — average credit score on applications, eviction rate, late-payment / NSF rate, and stable-employment percentage? A property-management company in the area should have these aggregated.
- How much new for-sale + rental construction is in the pipeline within 1–3 miles? Heavy new supply typically softens prices + rents 12–24 months out; constrained supply supports both.
Investment metrics
- 1% rule
- 0.75% ✗
- Cap rate
- 5.35%
- Cash-on-cash
- -3.37%
- DSCR
- 0.85
- GRM
- 11.1
CMA / ARV
- ARV (on-the-fly)
- $165,584
- Comps found
- 12
Show comp detail 12 sales within ~0.75 mi
| Address | Dist | Beds/Ba | Sqft | Sold | Price | $/sf | Match |
|---|---|---|---|---|---|---|---|
| 5125 Abel Ln | 0.00mi | 4/2.0 (+1) | 1,264 (0%) | 7mo | $165,000 | $131 | 85 |
| 3461 Rockwood Dr | 0.29mi | 3/1.0 | 1,222 (-3%) | 2mo | $67,000 | $55 | 79 |
| 5140 Columbus Ave | 0.23mi | 3/1.0 | 1,314 (+4%) | 8mo | $165,000 | $126 | 76 |
| 3425 Greenbrier Dr | 0.38mi | 3/2.0 | 1,224 (-3%) | 1mo | $169,900 | $139 | 72 |
| 3406 Greenbrier Dr | 0.41mi | 2/1.0 (-1) | 1,184 (-6%) | 2mo | $132,500 | $112 | 64 |
| 3469 Lowell Ave | 0.32mi | 3/2.0 | 1,197 (-5%) | 14mo | $216,000 | $180 | 61 |
| 3242 Deason Ave | 0.58mi | 3/2.0 | 1,197 (-5%) | 2mo | $223,500 | $187 | 59 |
| 718 Melson Ave | 0.63mi | 3/2.0 | 1,287 (+2%) | 6mo | $200,000 | $155 | 58 |
| 3315 Sunnybrook Ave N | 0.51mi | 2/1.0 (-1) | 1,212 (-4%) | 10mo | $150,000 | $124 | 56 |
| 3510 Andrews St | 0.36mi | 4/1.0 (+1) | 1,152 (-9%) | 14mo | $125,000 | $109 | 52 |
| 3334 Mabry Ter | 0.50mi | 2/1.0 (-1) | 1,189 (-6%) | 13mo | $180,000 | $151 | 51 |
| 1064 Woodstock Ave | 0.74mi | 4/1.0 (+1) | 1,152 (-9%) | 3mo | $126,400 | $110 | 43 |
Match score weights: distance 35% · size 25% · config 20% · recency 20%. Top-matched comps best support the ARV.
Projected returns pro-forma
3.41% appreciation · 1.7% rent growth · sell at horizon
- IRR
- 5.0%
- Equity multiple
- 1.30×
- Total profit
- $15,626
- Equity at exit
- $89,410
- IRR
- 7.5%
- Equity multiple
- 2.16×
- Total profit
- $61,473
- Equity at exit
- $141,336
Cash invested: $52,920 (down + closing). Projections, not guarantees.
Landlord ↔ Tenant lean methodology
- Overall (STATE)
- 87 Strongly Landlord-Friendly
- State Florida
- 87 Strongly Landlord-Friendly · R+3
- County
- — inherits STATE
- City
- — inherits STATE
ZIP-level market 32254
- Home prices YoY
- 1.2%
- Rents YoY
- 1.7%
- Active inventory
- 172
- Price-to-rent
- 11.1×
Monthly cashflow live
- Estimated rent
- $1,413 high interval (Pro) →
- Mortgage (P&I)
- −$991
- Tax from tax record
- −$195 /mo · $2,346/yr
- Insurance
- −$79
- HOA
- −$0
- Vacancy / Maint / Mgmt
- −$297
- Net cashflow
- $-149
Break-even live
Sensitivity live
| Price | -10% $-42 | -5% $-95 | +0% $-149 | +5% $-202 | +10% $-256 |
|---|---|---|---|---|---|
| Rent | -10% $-260 | -5% $-205 | +0% $-149 | +5% $-93 | +10% $-37 |
| Rate | -1.0pp $-54 | -0.5pp $-101 | base $-149 | +0.5pp $-198 | +1.0pp $-248 |
UW: 25.0% down · 7.5% · 30yr · 1.5% tax · 5.0% vac · 8.0% maint · 8.0% mgmt
Financing live
Cash to close
- Down payment
- $47,250
- Closing costs
- $5,670
- Reserves months
- —
- Total cash needed
- —
Loan-product check · same deal, 3 products live
Conventional
25% down · 7.5% · 30yr
- Down + closing
- —
- Monthly P&I
- —
- Monthly cashflow
- —
- DSCR
- —
- Eligible?
- —
Personal DTI + credit; lowest rate.
DSCR
20% down · 8.5% · 30yr
- Down + closing
- —
- Monthly P&I
- —
- Monthly cashflow
- —
- DSCR
- —
- Eligible?
- —
No personal income docs; deal must DSCR.
Hard money
10% down · 12.0% · 12mo
- Down + closing
- —
- Monthly P&I
- —
- Monthly cashflow
- —
- DSCR
- —
- Eligible?
- —
Short-term bridge; refi at stabilization.
Rent comps 40 comps
| Address | Beds | Baths | Sqft | Rent | $/sqft | DOM | Units | Dist |
|---|---|---|---|---|---|---|---|---|
| 5148 Cain Ln Jacksonville, FL | 3.0 | 1.0 | 1104 | $1,306 | $1.18 | 21d | 1 | 0.08mi |
| 3450 Lowell Ave Jacksonville, FL | 3.0 | 2.0 | 1209 | $1,578 | $1.31 | 24d | 1 | 0.34mi |
| 3350 Sunnybrook Ave N Jacksonville, FL | 2.0 | 1.0 | 900 | $1,095 | $1.22 | 24d | 1 | 0.43mi |
| 3362 Lowell Ave Jacksonville, FL | 3.0 | 2.0 | 1682 | $1,400 | $0.83 | 8d | 1 | 0.47mi |
| 3305 Sunnybrook Ave N Jacksonville, FL | 2.0 | 1.0 | 1012 | $1,021 | $1.01 | 24d | 1 | 0.50mi |
| 3368 Columbus Ave Jacksonville, FL | 2.0 | 1.0 | 955 | $1,300 | $1.36 | 4d | 1 | 0.50mi |
| 3303 Broadway Ave Jacksonville, FL | 3.0 | 2.0 | 1072 | $1,550 | $1.45 | 4d | 1 | 0.51mi |
| 1021 Woodstock Ave Jacksonville, FL | 3.0 | 2.0 | 1012 | $1,495 | $1.48 | 8d | 1 | 0.70mi |
| 1021 Woodstock Ave Jacksonville, FL | 3.0 | 2.0 | 1012 | $1,495 | $1.48 | 24d | 1 | 0.70mi |
| 3012 Imperial St Jacksonville, FL | 3.0 | 1.0 | 1089 | $1,395 | $1.28 | 24d | 1 | 0.87mi |
| 5405 Leaming Ave Jacksonville, FL | 3.0 | 1.0 | 924 | $1,199 | $1.30 | 17d | 1 | 0.93mi |
| 1305 Melson Ave Jacksonville, FL | 3.0 | 2.0 | 1224 | $1,399 | $1.14 | 20d | 1 | 0.98mi |
| 3034 Detroit Cir E Jacksonville, FL | 3.0 | 2.0 | 1300 | $1,399 | $1.08 | 24d | 1 | 0.99mi |
| 1037 Detroit St Jacksonville, FL | 3.0 | 2.0 | 912 | $1,250 | $1.37 | 2d | 1 | 1.00mi |
| 3688 Dillon St Jacksonville, FL | 3.0 | 2.0 | 1230 | $1,421 | $1.16 | 24d | 1 | 1.03mi |
| 3055 2nd Street Cir Jacksonville, FL | 3.0 | 1.5 | 1050 | $1,340 | $1.28 | 17d | 1 | 1.04mi |
| 4650 Buxton St Jacksonville, FL | 3.0 | 2.0 | 1620 | $1,925 | $1.19 | 4d | 1 | 1.08mi |
| 1227 Dena St Jacksonville, FL | 3.0 | 1.0 | 1033 | $1,325 | $1.28 | 24d | 1 | 1.11mi |
| 912 Huron St Jacksonville, FL | 2.0 | 1.0 | 900 | $1,100 | $1.22 | 15d | 1 | 1.16mi |
| 3515 Dignan St Jacksonville, FL | 3.0 | 1.0 | 915 | $1,036 | $1.13 | 3d | 1 | 1.19mi |
| 4718 Ramona Blvd Jacksonville, FL | 3.0 | 1.0 | 1085 | $1,595 | $1.47 | 24d | 1 | 1.20mi |
| 3550 Edison Ave Jacksonville, FL | 3.0 | 2.0 | 1230 | $1,463 | $1.19 | 4d | 1 | 1.22mi |
| 3352 Dillon St Jacksonville, FL | 3.0 | 2.0 | 1229 | $1,372 | $1.12 | 24d | 1 | 1.23mi |
| 2965 Sunset St Jacksonville, FL | 3.0 | 1.5 | 1056 | $1,375 | $1.30 | 8d | 1 | 1.24mi |
| 2965 Sunset St Jacksonville, FL | 3.0 | 2.0 | 1056 | $1,375 | $1.30 | 4d | 1 | 1.24mi |
| 853 Mikael Ave Jacksonville, FL | 3.0 | 2.0 | 1025 | $1,600 | $1.56 | 24d | 1 | 1.26mi |
| 1612 Alfen St Jacksonville, FL | 3.0 | 1.5 | 945 | $1,113 | $1.18 | 8d | 1 | 1.26mi |
| 628 Meteor St Jacksonville, FL | 3.0 | 1.0 | 1123 | $1,395 | $1.24 | 24d | 1 | 1.27mi |
| 841 Ontario St Jacksonville, FL | 2.0 | 1.0 | 1000 | $1,285 | $1.28 | 24d | 1 | 1.29mi |
| 691 Herman St Jacksonville, FL | 4.0 | 2.5 | 1641 | $1,669 | $1.02 | 8d | 1 | 1.30mi |
| 3323 Nolan St Jacksonville, FL | 3.0 | 1.0 | 927 | $1,050 | $1.13 | 2d | 1 | 1.30mi |
| 3318 Dignan St Jacksonville, FL | 3.0 | 2.0 | 960 | $1,200 | $1.25 | 24d | 1 | 1.30mi |
| 3356 Lenox Ave Jacksonville, FL | 2.0 | 1.0 | 899 | $999 | $1.11 | 24d | 1 | 1.32mi |
| 3319 Hunt St Jacksonville, FL | 3.0 | 1.0 | 924 | $1,295 | $1.40 | 24d | 1 | 1.33mi |
| 676 Bridal Ave Jacksonville, FL | 3.0 | 2.0 | 1008 | $1,450 | $1.44 | 24d | 1 | 1.33mi |
| 2939 W 6th St Jacksonville, FL | 3.0 | 2.0 | 1269 | $1,225 | $0.97 | 2d | 1 | 1.33mi |
| 2902 W 5th St Jacksonville, FL | 3.0 | 2.0 | 1379 | $1,050 | $0.76 | 8d | 1 | 1.33mi |
| 5067 French St Jacksonville, FL | 3.0 | 1.0 | 1376 | $1,450 | $1.05 | 24d | 1 | 1.37mi |
| 3609 Dellwood Ave Jacksonville, FL | 2.0 | 2.0 | 936 | $1,495 | $1.60 | 24d | 1 | 1.39mi |
| 3347 Phyllis St Jacksonville, FL | 3.0 | 2.0 | 1145 | $1,395 | $1.22 | 24d | 1 | 1.40mi |
Listing history 7 events
-
2026-06-18days on market $189,000 Active 7 DOM
-
2026-06-17days on market $189,000 Active 6 DOM
-
2026-06-16days on market $189,000 Active 5 DOM
-
2026-06-15days on market $189,000 Active 4 DOM
-
2026-06-13days on market $189,000 Active 2 DOM
-
2026-06-13remarks 699-char remark
-
2026-06-13$189,000 Active 1 DOM
ⓘ Source: listings_history table (triggers on properties + properties_extension) + one-shot
backfill from property_details.listing_events for pre-trigger history.
Tax reassessment forecast FL · Resets to sale price
- Current annual tax
- $2,346 · $195/mo
- Projected year-2 tax
- $2,346 · $195/mo
- Expected delta
- $0/yr ($0/mo · 0.0%)
ⓘ Screening estimate from a state-policy table — verify with the county assessor before closing.
Climate risk First Street
- Flood 6/10 Major FEMA zone X (unshaded) · 71% chance over 30 yrs
- Wildfire 2/10 Low
- Heat 9/10 Extreme 7 d/yr ≥107°F today · 20 d/yr by 30 yrs out
- Wind 9/10 Extreme 99% chance of damaging wind over 30 yrs
- Air quality 5/10 Major 7 unhealthy d/yr today · 7 by 30 yrs out
Nearby sold comps map
Loading sold comps map…
Walkable amenities ~0.75 mi
Loading nearby amenities…
Taxation est. · year 1
- Rental income
- $16,961
- − Mortgage interest
- −$10,587
- − Property taxes
- −$2,346
- − Insurance
- −$945
- − Repairs & maintenance
- −$1,357
- − Management
- −$1,357
- − Depreciation
- −$5,498
- Taxable loss
- −$5,128
- Est. tax savings @ 24.0%
- +$1,231
- After-tax cash flow
- $-554/yr
For passive investors: Depreciation is non-cash, so a rental often shows a tax loss while cash-flowing — sheltering income. Rental losses are passive: they offset passive income freely, and up to $25,000/yr can offset ordinary (W-2) income if you actively participate and your MAGI is under $100k (phasing out to $0 by $150k); unused losses carry forward. On sale, claimed depreciation is recaptured at up to 25%, and gains may owe capital-gains tax (a 1031 exchange can defer both). Figures are a year-1 estimate at your 24.0% rate — not tax advice; consult a CPA.
Schools (NCES district)
- District
- Duval
- NCES district ID
- 1200480
- Math proficiency
- 46% ▼ -11.00%
- Reading proficiency
- 45% ▼ -4.00%
- Median HH income
- $48,987
- Composite
- 38.97/100
- National rank
- #4076
- State rank
- #48 of 73 in FL
Livability — Jacksonville
- Score
- 83/100
- State rank
- #50
- US rank
- #911
Category grades
Schools grade is shown separately in the Schools card above.
Census & demographics
- Census place
- Jacksonville, FL
- County
- Duval County · 1,015,274 people
- City population
- 979,034
- Metro
- Jacksonville, FL
- Population (ZIP)
- 13,927
- Household income
- $34,953
- Rent vs Own
- Severe rent burden
- 882.0
Population outlook (Duval County) Hauer SSP2
- Today (2025)
- 1,013,010 people
- By 2030
- 1,059,228 · +4.6%
- By 2040
- 1,141,439 · +12.7%
- By 2050
- 1,205,258 · +19.0%
- By 2075
- 1,324,282 · +30.7%
- By 2100
- 1,319,620 · +30.3%
Race, ethnicity, and origin ACS 2023
- Neighborhood character
- Diverse neighborhood (Simpson 0.56)
- Race & ethnicity
- Black 60% White 28% Two or more races 7% Hispanic / Latino 5%
- Hispanic origin (detail)
- Puerto Rican 1%
- Common ancestry
- Slovak 1% Hispanic 1% Lithuanian 1%
- Foreign-born
- 4% · Canada
- Languages at home
- 94% English-only · Spanish 4% French/Haitian/Cajun 2%
Political lean MEDSL · Duval
- 2024 margin
- Toss-up / Even · D 48.7% · R 50.1% · Other 1.2%
- 2008→2024 swing
- +0.4pp no change · 2008: -1.9pp · 2024: -1.5pp
- All cycles
- 2024: R+1.5 2020: D+3.8 2016: R+1.5 2012: R+3.6 2008: R+1.9
Not yet ingested
- Civics
- —
Market trends
- HPI YoY
- ▲ 3.41%
- Current HPI
- 282.2981
- Rent YoY
- ▲ 1.70%
- Metro
- Jacksonville, FL
- State GDP YoY
- ▲ 3.28%
- F500 in state
- 36
Industry mix (Fortune 500 HQ in FL)
| Industry | F500 HQs | Revenue |
|---|---|---|
| Industrial Technology | 2 | $29B |
|
||
| Insurance | 2 | $17B |
|
||
| Retail | 1 | $60B |
|
||
| Technology Distribution | 1 | $58B |
|
||
| Homebuilding | 1 | $35B |
|
||
| Technology Manufacturing | 1 | $35B |
|
||
Price history
+2262.5% since first listed10 events — show timeline
- 2026-06-11 Listed $189,000 realMLS
- 2025-12-12 Sold (Public Records) $165,000 Public Records
- 2025-11-26 Sold (MLS) $165,000 realMLS
- 2025-11-17 Contingent — realMLS
- 2025-10-22 Listed $167,500 realMLS
- 2025-10-20 Listing Removed — realMLS
- 2025-10-17 Price Changed $174,900 realMLS
- 2025-10-09 Price Changed $178,900 realMLS
- 2025-09-25 Listed $179,900 realMLS
- 1979-10-05 Sold (Public Records) $8,000 Public Records
Property tax history
+22.7%/yrLatest (2025): $2,346 · +564.9% YoY. Source: county tax records.
Cash-flow waterfall
monthlySold comps — $/sqft
last 12 mo · ≤1 miLoading sold comps…