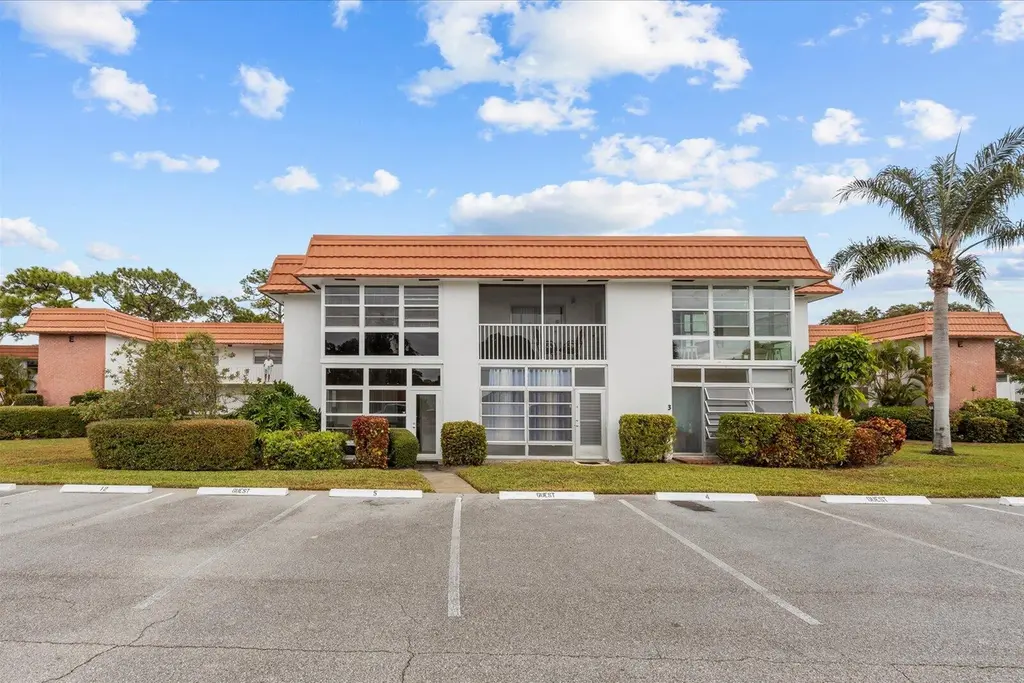
2600 SE Ocean Blvd Unit E5 · Stuart, FL
Flood risk 7/10 · Major
- FEMA flood zone
- X (unshaded)
- Chance of flooding over 30 yrs
- 0.95%
- Est. flood insurance / yr
- $507 – $1,088
Fire risk 1/10 · Minimal
- Est. fire insurance / yr
- $947 – $1,759
Heat risk 10/10 · Severe
- Hot days now (above 106°F)
- 7 days/yr
- Hot days in 30 yrs
- 26 days/yr
Wind risk 10/10 · Severe
- Chance of severe wind over 30 yrs
- 99.0%
Air-quality risk 2/10 · Minimal
- Unhealthy air days now
- 2 days/yr
- Unhealthy air days in 30 yrs
- 2 days/yr
Risk factors via First Street. Map © Google.
Why this score? — see what drove the A- grade
The composite is a weighted blend of 9 inputs, each scored 0–100. Each bar is that input's sub-score; the figure is the points it added to the 100-point composite (weight × sub-score).
- Cash flow +29.5/30.0
- ARV discount +11.2/15.0
- 1% rule +10.0/10.0
- DSCR +10.0/10.0
- Appreciation +10.0/10.0
- Schools +4.5/10.0
- Livability +4.2/5.0
- Rent growth +2.5/5.0
- Condition / age +2.5/5.0
$105,888
🖨 Deal sheet 📄 Offer letter ✓ Due diligence
Listing remarks MLS
Conveinant 1st floor condo with easy entry parking from rear to your condo.Plus you are seconds to pool, amenties & clubhouse. Condo has newer kitchen & appliances. Plus enclosed patio has impact glass. Price reflects need for new carpet & vanity in master bathroom. Best value for location, location, location. Best value for money make this yours. Big clubhouse, has pool, woodshop and shuffle board.
Key facts
- $480 HOA
- Built 1970
- Listed 146 days
Neighborhood map
What this means for you Summary
Snapshot
- This is a 1-bed/1.5-bath condo listed at $106k.
Deal economics
- At list price, monthly cash flow is $311 ($4k/yr) — positive.
- The deal already cash-flows at list — no discount required.
- Meets the 1% rule at list price ($2k rent vs $106k).
- Recommended offer: $93k (12.0% below list) — sets the bar for market timing.
- Cap rate 10.6% vs local median 4.1% in Stuart — top-decile yield for the area; either an underpriced asset or a hidden risk that comps aren't pricing in. Stress-test before assuming the spread holds.
Location & tenants
- Location reads 84/100 on livability (#39 in FL, #790 nationally) — a professional / high-income tenant draw. Strengths: commute A+, housing A+, health & safety A+; Watch: crime C-, employment C-, amenities D.
- Martin (suburban): math 52% / reading 53% proficiency, ranked #24 of 73 in FL (top 33%) — acceptable for families but not a draw, mixed tenant base, ~2y average lease.
- Market conditions: 251 active listings in the ZIP; 11 comparable units currently listed for rent nearby; rentals at typical pace (median 23d on market — plan ~3-4 weeks tenant-placement turnaround); solid renter incomes; 737 units permitted in Martin County in 2024 (167 in 5+ unit buildings).
Forward outlook
- In year one you build about $11k of equity ($732 loan paydown + $11k appreciation (10.0% local appreciation)).
- Martin County population projected at +19% by 2050 — long-run rental-demand tailwind backs the buy-and-hold thesis.
- At projected returns (10.0% appreciation + 3.0% rent growth), your $30k cash investment doubles in ~2 years — after that, you're playing with house money.
- By year 4, paydown + projected appreciation supports a ~$40k cash-out refi (75% LTV) — recoverable capital for the next deal without selling this one.
Negotiation context
- It's been on market 146 days — a 12% lower offer ($93k) is reasonable based on typical stale-listing flexibility.
- 5 sale attempts since 24y ago with the ask held roughly flat each time — persistent listings suggest the price (not the market) is what's stuck; bring a comps-based counter.
- Current owner paid $58k; list at $106k implies a 84% gain — meaningful room to come down on a strong offer.
Risks & watch-outs
- Watch-outs: flood insurance adds $66/mo; HOA is 26% of rent.
- Climate carrying-cost: major flood risk; severe wind risk, 99% chance of damaging wind over 30y; extreme-heat days projected 7→26/yr by 2055 (HVAC capex compounding) — expect insurance premiums to compound above CPI over the hold.
Questions for the listing agent
- It's been on market 146 days. Have you received any prior offers? Is the seller open to a 12% concession, seller financing, or rate buy-down credit?
- Built in 1970 — when were the roof, HVAC, electrical panel, plumbing, and water heater last replaced?
- What's the actual annual flood-insurance premium (NFIP or private), and is the property in a SFHA with mandatory coverage?
- What does the HOA fee cover, when was the last increase, and are there any pending special assessments or reserve-fund shortfalls?
- Any open or pending special assessments — roof, HVAC, plumbing, elevator, façade? What's the per-unit balance and payoff schedule, and is the seller paying it off at close or rolling it to the buyer?
- Why hasn't it sold? Are there any deal-killer items the seller is aware of (foundation, flood, title, zoning, code violations)?
- Is there a deadline driving the sale (1031 exchange, divorce, estate, relocation)? That informs how much negotiation room exists.
- Schools are A-rated — typically a magnet for longer-tenancy family renters. What's the average tenant stay here, and is there a school-zone premium baked into asking?
- What's the average days-on-market for RENTAL listings here right now (not sales)? A rising rental-DOM trend means longer vacancies and softer asking-rent achievability than the comps imply.
- What's the recent tenant-quality profile in this submarket — average credit score on applications, eviction rate, late-payment / NSF rate, and stable-employment percentage? A property-management company in the area should have these aggregated.
- How much new apartment / multifamily construction is in the pipeline within 1–3 miles? Heavy new supply (>2% of stock underway) typically softens rents 12–24 months out; light construction supports rent growth.
Investment metrics
- 1% rule
- 1.77% ✓
- Cap rate
- 10.57%
- Cash-on-cash
- 15.28%
- DSCR
- 1.68
- GRM
- 4.7
CMA / ARV
- ARV (median comp)
- $115,258
- List price
- $105,888
- Delta
- -8.13%
- Verdict
- FAIR
- Comps
- 20 within 1.0 mi
Projected returns pro-forma
10.0% appreciation · 3.0% rent growth · sell at horizon
- IRR
- 33.6%
- Equity multiple
- 3.62×
- Total profit
- $77,771
- Equity at exit
- $95,392
- IRR
- 29.1%
- Equity multiple
- 8.22×
- Total profit
- $214,040
- Equity at exit
- $205,717
Cash invested: $29,649 (down + closing). Projections, not guarantees.
Landlord ↔ Tenant lean methodology
- Overall (STATE)
- 87 Strongly Landlord-Friendly
- State Florida
- 87 Strongly Landlord-Friendly · R+3
- County
- — inherits STATE
- City
- — inherits STATE
ZIP-level market 34996
- Home prices YoY
- 2.1%
- Active inventory
- 251
- Price-to-rent
- 4.7×
Monthly cashflow live
- Estimated rent
- $1,874 high interval (Pro) →
- Mortgage (P&I)
- −$555
- Tax from tax record
- −$23 /mo · $282/yr
- Insurance
- −$44
- Flood insurance flood zone
- −$66 /mo · $798/yr
- HOA
- −$480
- Vacancy / Maint / Mgmt
- −$394
- Net cashflow
- $311
Break-even live
UW: 25.0% down · 7.5% · 30yr · 1.5% tax · 5.0% vac · 8.0% maint · 8.0% mgmt
Financing live
Cash to close
- Down payment
- $26,472
- Closing costs
- $3,177
- Reserves months
- —
- Total cash needed
- —
Loan-product check · same deal, 3 products live
Conventional
25% down · 7.5% · 30yr
- Down + closing
- —
- Monthly P&I
- —
- Monthly cashflow
- —
- DSCR
- —
- Eligible?
- —
Personal DTI + credit; lowest rate.
DSCR
20% down · 8.5% · 30yr
- Down + closing
- —
- Monthly P&I
- —
- Monthly cashflow
- —
- DSCR
- —
- Eligible?
- —
No personal income docs; deal must DSCR.
Hard money
10% down · 12.0% · 12mo
- Down + closing
- —
- Monthly P&I
- —
- Monthly cashflow
- —
- DSCR
- —
- Eligible?
- —
Short-term bridge; refi at stabilization.
Rent comps 11 comps
| Address | Beds | Baths | Sqft | Rent | $/sqft | DOM | Units | Dist |
|---|---|---|---|---|---|---|---|---|
| 2600 SE Ocean Blvd Stuart, FL | 1.0–2.0 | 1.5–2.0 | 951 | $1,500 | $1.58 | 13d | 3 | 0.07mi |
| 2929 SE Ocean Blvd Stuart, FL | 1.0–2.0 | 1.0–2.0 | 812 | $1,500 | $1.85 | 23d | 6 | 0.27mi |
| 2929 SE Ocean Blvd Stuart, FL | 1.0–2.0 | 1.0–2.0 | 812 | $1,450 | $1.79 | 13d | 8 | 0.27mi |
| 2950 SE Ocean Blvd Stuart, FL | 2.0 | 2.0 | 1157 | $1,800 | $1.56 | 13d | 3 | 0.27mi |
| 2929 SE Ocean Blvd Unit 130 Stuart, FL | 2.0 | 2.0 | 1005 | $1,800 | $1.79 | 23d | 1 | 0.34mi |
| 300 SE Saint Lucie Blvd Stuart, FL | 1.0–3.0 | 1.0–2.0 | 884 | $1,789 | $2.02 | 13d | 12 | 0.42mi |
| 333 SE Martin Ave Unit 1F Stuart, FL | 2.0 | 1.0 | 778 | $1,800 | $2.31 | 23d | 1 | 0.61mi |
| 1800 SE Saint Lucie Blvd Stuart, FL | 2.0 | 2.0 | 1044 | $2,600 | $2.49 | 23d | 3 | 0.93mi |
| 906 SE Tarpon Ave Unit B Stuart, FL | 1.0 | 1.0 | 600 | $1,350 | $2.25 | 23d | 1 | 1.44mi |
| 917 SE Nassau Ave Stuart, FL | 2.0 | 1.0 | 832 | $1,900 | $2.28 | 21d | 1 | 1.47mi |
| 917 SE Nassau Ave Stuart, FL | 2.0 | 1.0 | 832 | $3,800 | $4.57 | 23d | 1 | 1.47mi |
HOA detail condo
- Monthly dues
- $480 · $5,760/yr
- Likely covers
- pool
- Assessments
- None detected in remarks — confirm with the listing agent.
Listing history 26 events
-
2026-06-18days on market $105,888 Active 146 DOM
-
2026-06-17days on market $105,888 Active 145 DOM
-
2026-06-16days on market $105,888 Active 144 DOM
-
2026-06-15days on market $105,888 Active 143 DOM
-
2026-06-14days on market $105,888 Active 141 DOM
-
2026-06-13days on market $105,888 Active 140 DOM
-
2026-06-10days on market $105,888 Active 138 DOM
-
2026-06-09days on market $105,888 Active 137 DOM
-
2026-06-08days on market $105,888 Active 136 DOM
-
2026-06-07days on market $105,888 Active 135 DOM
-
2026-06-03days on market $105,888 Active 131 DOM
-
2026-06-02days on market $105,888 Active 130 DOM
-
2026-06-01days on market $105,888 Active 129 DOM
-
2026-05-31days on market $105,888 Active 128 DOM
-
2026-05-31days on market $105,888 Active 127 DOM
-
2026-01-20$105,888 Active 417-char remark
Show marketing remark (422 chars)
Convenient 1st floor condo with easy entry parking from rear to your condo. Plus you are seconds to pool, amenities & clubhouse. Condo has newer kitchen & appliances. Plus enclosed patio has impact glass. Price reflects need for new carpet & vanity in master bathroom. Best value for location, location, location. Best value for money make this yours. Big clubhouse, has pool, woodshop and shuffle board.
-
2026-01-20$105,888 Active 422-char remark
Show marketing remark (422 chars)
Convenient 1st floor condo with easy entry parking from rear to your condo. Plus you are seconds to pool, amenities & clubhouse. Condo has newer kitchen & appliances. Plus enclosed patio has impact glass. Price reflects need for new carpet & vanity in master bathroom. Best value for location, location, location. Best value for money make this yours. Big clubhouse, has pool, woodshop and shuffle board.
-
2025-10-01historical
-
2025-04-05price $140,000
-
2025-04-02$1,400,000 Active
-
2002-12-20soldstatus $57,500
-
2002-12-16soldstatus $57,500
-
2002-10-31historical
-
2002-10-17$58,900
-
2002-10-17$58,900
-
2000-08-29soldstatus $36,500
ⓘ Source: listings_history table (triggers on properties + properties_extension) + one-shot
backfill from property_details.listing_events for pre-trigger history.
Tax reassessment forecast FL · Resets to sale price
- Current annual tax
- $282 · $23/mo
- Projected year-2 tax
- $879 · $73/mo
- Expected delta
- +$597/yr (+$50/mo · 211.8%)
ⓘ Screening estimate from a state-policy table — verify with the county assessor before closing.
Climate risk First Street
- Flood 7/10 Severe FEMA zone X (unshaded) · 95% chance over 30 yrs
- Wildfire 1/10 Low
- Heat 10/10 Extreme 7 d/yr ≥106°F today · 26 d/yr by 30 yrs out
- Wind 10/10 Extreme 99% chance of damaging wind over 30 yrs
- Air quality 2/10 Low 2 unhealthy d/yr today · 2 by 30 yrs out
Nearby sold comps map
Loading sold comps map…
Walkable amenities ~0.75 mi
Loading nearby amenities…
Taxation est. · year 1
- Rental income
- $22,486
- − Mortgage interest
- −$5,931
- − Property taxes
- −$282
- − Insurance
- −$1,327
- − Repairs & maintenance
- −$1,799
- − Management
- −$1,799
- − HOA
- −$5,760
- − Depreciation
- −$3,080
- Taxable income
- $2,507
- Est. tax owed @ 24.0%
- −$602
- After-tax cash flow
- $3,130/yr
For passive investors: Depreciation is non-cash, so a rental often shows a tax loss while cash-flowing — sheltering income. Rental losses are passive: they offset passive income freely, and up to $25,000/yr can offset ordinary (W-2) income if you actively participate and your MAGI is under $100k (phasing out to $0 by $150k); unused losses carry forward. On sale, claimed depreciation is recaptured at up to 25%, and gains may owe capital-gains tax (a 1031 exchange can defer both). Figures are a year-1 estimate at your 24.0% rate — not tax advice; consult a CPA.
Schools (NCES district)
- District
- Martin
- NCES district ID
- 1201290
- Math proficiency
- 52% ▼ -14.00%
- Reading proficiency
- 53% ▼ -4.00%
- Median HH income
- $52,482
- Composite
- 45.1/100
- National rank
- #2690
- State rank
- #24 of 73 in FL
Livability — Stuart
- Score
- 84/100
- State rank
- #39
- US rank
- #790
Category grades
Schools grade is shown separately in the Schools card above.
Census & demographics
- Census place
- Stuart, FL
- County
- Martin County · 165,223 people
- City population
- 65,812
- Metro
- Port St. Lucie, FL
- Population (ZIP)
- 10,653
- Household income
- $83,929
- Rent vs Own
- Severe rent burden
- 247.0
Population outlook (Martin County) Hauer SSP2
- Today (2025)
- 172,383 people
- By 2030
- 180,192 · +4.5%
- By 2040
- 194,114 · +12.6%
- By 2050
- 204,992 · +18.9%
- By 2075
- 229,641 · +33.2%
- By 2100
- 232,146 · +34.7%
Race, ethnicity, and origin ACS 2023
- Neighborhood character
- Predominantly White (90%)
- Race & ethnicity
- White 90% Hispanic / Latino 7% Two or more races 5%
- Hispanic origin (detail)
- Puerto Rican 2%
- Common ancestry
- Italian 3% Romanian 3% Slovak 3%
- Foreign-born
- 6% · Canada
- Languages at home
- 94% English-only · Spanish 3% Other Indo-European 1% French/Haitian/Cajun 1%
Political lean MEDSL · Martin
- 2024 margin
- Solid R (+31.1) · D 34.1% · R 65.2%
- 2008→2024 swing
- -17.5pp toward R · 2008: -13.6pp · 2024: -31.1pp
- All cycles
- 2024: R+31.1 2020: R+24.6 2016: R+26.9 2012: R+22.9 2008: R+13.6
Not yet ingested
- Civics
- —
Market trends
- HPI YoY
- ▲ 13.71%
- Current HPI
- 658.96
- Rent YoY
- —
- Metro
- Port St. Lucie, FL
- State GDP YoY
- ▲ 3.28%
- F500 in state
- 36
Industry mix (Fortune 500 HQ in FL)
| Industry | F500 HQs | Revenue |
|---|---|---|
| Industrial Technology | 2 | $29B |
|
||
| Insurance | 2 | $17B |
|
||
| Retail | 1 | $60B |
|
||
| Technology Distribution | 1 | $58B |
|
||
| Homebuilding | 1 | $35B |
|
||
| Technology Manufacturing | 1 | $35B |
|
||
Price history
+190.1% since first listed11 events — show timeline
- 2026-01-20 Listed $105,888 MCRTC
- 2026-01-20 Listed $105,888 Beaches MLS
- 2025-10-01 Listing Removed — MCRTC
- 2025-04-05 Price Changed $140,000 MCRTC
- 2025-04-02 Listed $1,400,000 MCRTC
- 2002-12-20 Sold (Public Records) $57,500 Public Records
- 2002-12-16 Sold (MLS) $57,500 Beaches MLS
- 2002-10-31 Listing Removed — Beaches MLS
- 2002-10-17 Listed $58,900 Beaches MLS
- 2002-10-17 Listed $58,900 MCRTC
- 2000-08-29 Sold (Public Records) $36,500 Public Records
Property tax history
+6.6%/yrLatest (2025): $282 · +5.2% YoY. Source: county tax records.
Cash-flow waterfall
monthlySold comps — $/sqft
last 12 mo · ≤1 miLoading sold comps…