 Duplex
6617 Bacher St · Houston, TX
Flood risk No data
- FEMA flood zone
- —
- Chance of flooding over 30 yrs
- —
- Est. flood insurance / yr
- —
Fire risk No data
- Est. fire insurance / yr
- —
Heat risk No data
- Hot days now (above threshold)
- —
- Hot days in 30 yrs
- —
Wind risk No data
- Chance of severe wind over 30 yrs
- —
Air-quality risk No data
- Unhealthy air days now
- —
- Unhealthy air days in 30 yrs
- —
Risk factors via First Street. Map © Google.
Why this score? — see what drove the C grade
The composite is a weighted blend of 9 inputs, each scored 0–100. Each bar is that input's sub-score; the figure is the points it added to the 100-point composite (weight × sub-score).
- Cash flow +15.9/30.0
- ARV discount +10.7/15.0
- Appreciation +7.6/10.0
- DSCR +4.9/10.0
- 1% rule +4.3/10.0
- Condition / age +4.0/5.0
- Livability +3.7/5.0
- Schools +2.7/10.0
- Rent growth +2.1/5.0
$365,000
🖨 Deal sheet (PDF) 📄 Offer letter ✓ Due diligence
Multi-family units
County records classify this as Multi-Family (2-4 Unit). Listing-text estimate: 2 units. confirmed
Listing remarks MLS
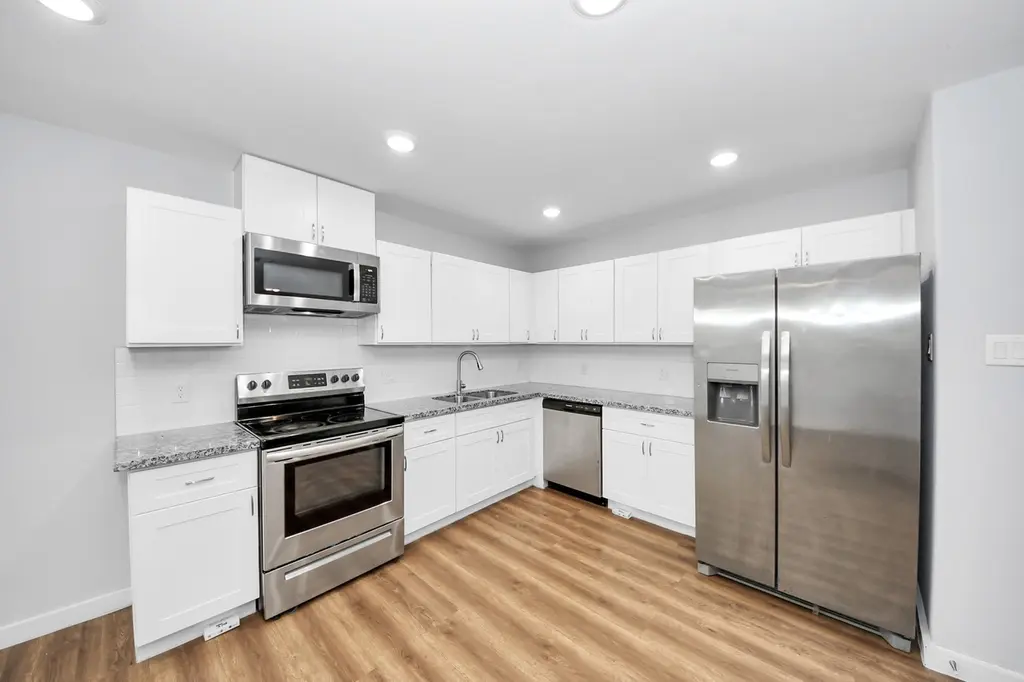
Excellent investment opportunity featuring a well-maintained duplex, each unit offering 3 bedrooms, 2 bathrooms, and approximately 1,150 square feet of living space. Both units showcase laminate flooring throughout, a well-appointed kitchen with granite countertops, and ample cabinetry for storage. The bedrooms are generously sized, with the primary suite including a large walk-in closet. Each unit also includes electric washer and dryer connections, with appliances available upon request. Unit A is currently occupied by a tenant at $1,700 per month, providing immediate rental income. Unit B is vacant and has a rental potential of $1,800 per month. This property offers strong cash flow potential in a desirable rental market, making it ideal for investors seeking a turnkey opportunity.
Key facts
- Built 2023
- Listed 48 days
Neighborhood map
What this means for you Summary
Snapshot
- This is a 2 × 3-bed/2.0-bath units multifamily listed at $365k. Condition is rated good.
Deal economics
- At list price, monthly cash flow is $171 ($2k/yr) — positive. Per door: $86/mo.
- The deal already cash-flows at list — no discount required.
- To meet the 1% rule (rent ≥ 1% of price), the offer needs to be $341k (6.6% below list).
- Recommended offer: $341k (6.6% below list) — sets the bar for 1% rule.
- Cap rate 6.9% vs local median 3.1% in Houston — top-decile yield for the area; either an underpriced asset or a hidden risk that comps aren't pricing in. Stress-test before assuming the spread holds.
Location & tenants
- Location reads 74/100 on livability (#184 in TX, #4,771 nationally) — a middle-class / working-renter tenant base. Strengths: amenities A+, cost of living A+, housing A+; Watch: schools D, crime F.
- Houston ISD (urban): math 27% / reading 35% proficiency, ranked #593 of 826 in TX (top 72%) — families likely to look elsewhere, expect single-tenant / working-renter base with shorter leases; 71% free/reduced lunch — lower-income household profile, screen leases tightly.
- Market conditions: Rents soft (-1.6%/yr); 354 active listings in the ZIP; 1 comparable units currently listed for rent nearby; lower-income renter base — watch delinquency; 29,883 units permitted in Harris County in 2024 (8,621 in 5+ unit buildings).
- At $3,410/mo this rent would consume 107% of the median local household income ($38k/yr) (locally 1177% of renters already pay >50% of income on rent) — very limited rent-growth headroom before tenants either downsize or default.
Forward outlook
- In year one you build about $22k of equity ($3k loan paydown + $19k appreciation (5.2% local appreciation)).
- Harris County population projected at +47% by 2050 — long-run rental-demand tailwind backs the buy-and-hold thesis.
- At projected returns (5.2% appreciation + 0.0% rent growth), your $102k cash investment doubles in ~5 years — after that, you're playing with house money.
- By year 2, paydown + projected appreciation supports a ~$35k cash-out refi (75% LTV) — recoverable capital for the next deal without selling this one.
Negotiation context
- It's been on market 49 days — a 3% lower offer ($354k) is reasonable based on typical stale-listing flexibility.
- 5 sale attempts since 3y ago; this cycle's ask has dropped $20k (5%) from the opening price — seller is motivated, your offer sets the floor, not the list.
Questions for the listing agent
- It's been on market 49 days. Have you received any prior offers? Is the seller open to a 7% concession, seller financing, or rate buy-down credit?
- Can we see the unit-by-unit rent roll, current vacancy, and any below-market leases? What's the average tenancy length?
- What capital expenditures (roof, boiler, parking lot, exteriors) have been made in the last 5 years, and what's planned in the next 2?
- Is there a deadline driving the sale (1031 exchange, divorce, estate, relocation)? That informs how much negotiation room exists.
- Schools are D-rated, which usually means shorter tenancies and higher turnover. Who's the typical renter profile here, and what's been the actual vacancy rate?
- Crime grade is F in this area — have there been break-ins, vandalism, or insurance claims at this property in the last 3 years? What carrier currently insures it and at what premium?
- What's the average days-on-market for RENTAL listings here right now (not sales)? A rising rental-DOM trend means longer vacancies and softer asking-rent achievability than the comps imply.
- What's the recent tenant-quality profile in this submarket — average credit score on applications, eviction rate, late-payment / NSF rate, and stable-employment percentage? A property-management company in the area should have these aggregated.
- How much new apartment / multifamily construction is in the pipeline within 1–3 miles? Heavy new supply (>2% of stock underway) typically softens rents 12–24 months out; light construction supports rent growth.
Investment metrics
- 1% rule
- 0.93% ✗
- Cap rate
- 6.86%
- Cash-on-cash
- 2.01%
- DSCR
- 1.09
- GRM
- 8.9
CMA / ARV
- ARV (median comp)
- $392,777
- List price
- $365,000
- Delta
- -7.07%
- Verdict
- FAIR
- Comps
- 20 within 1.0 mi
Show comp detail 6 sales within ~0.75 mi
| Address | Dist | Beds/Ba | Sqft | Sold | Price | $/sf | Match |
|---|---|---|---|---|---|---|---|
| 8049 Ritz St Unit A | 0.27mi | 6/2.0 | 2,212 (-4%) | 19mo | $375,000 | $170 | 57 |
| 8202 Furray Rd | 0.46mi | 6/— | 2,436 (+6%) | 20mo | $374,900 | $154 | 52 |
| 6112 Fairchild St | 0.59mi | 6/2.0 | 2,452 (+7%) | 14mo | $412,000 | $168 | 42 |
| 6916 Tommye St Unit A-B | 0.24mi | 6/2.0 | 2,628 (+14%) | 20mo | $430,000 | $164 | 40 |
| 7815 Joy St | 0.59mi | 6/2.0 | 2,577 (+12%) | 12mo | $399,900 | $155 | 34 |
| 7709 St Louis St | 0.61mi | 6/2.0 | 2,545 (+11%) | 18mo | $405,500 | $159 | 31 |
Match score weights: distance 35% · size 25% · config 20% · recency 20%. Top-matched comps best support the ARV.
Projected returns pro-forma
5.25% appreciation · 0.0% rent growth · sell at horizon
- IRR
- 13.8%
- Equity multiple
- 1.88×
- Total profit
- $90,233
- Equity at exit
- $212,295
- IRR
- 13.4%
- Equity multiple
- 3.39×
- Total profit
- $244,058
- Equity at exit
- $370,982
Cash invested: $102,200 (down + closing). Projections, not guarantees.
Landlord ↔ Tenant lean methodology
- Overall (STATE)
- 87 Strongly Landlord-Friendly
- State Texas
- 87 Strongly Landlord-Friendly · R+5
- County
- — inherits STATE
- City
- — inherits STATE
ZIP-level market 77028
- Home prices YoY
- 2.0%
- Rents YoY
- -1.6%
- Active inventory
- 354
- Price-to-rent
- 17.8×
Monthly cashflow live
- Estimated rent
- $3,410 high interval (Pro) →
- Mortgage (P&I)
- −$1,914
- Tax est. 1.5%
- −$456 /mo · $5,475/yr
- Insurance
- −$152
- HOA
- −$0
- Vacancy / Maint / Mgmt
- −$716
- Net cashflow
- $171
Break-even live
Sensitivity live
| Price | -10% $424 | -5% $298 | +0% $171 | +5% $45 | +10% $-81 |
|---|---|---|---|---|---|
| Rent | -10% $-98 | -5% $37 | +0% $171 | +5% $306 | +10% $441 |
| Rate | -1.0pp $355 | -0.5pp $264 | base $171 | +0.5pp $77 | +1.0pp $-19 |
2-unit breakdown (identical units grouped — click to expand)
| Units | Beds | Baths | Est. rent |
|---|---|---|---|
| 2× units | 3 | 2 | $3,410 |
| #1 | 3 | 2 | $1,705 |
| #2 | 3 | 2 | $1,705 |
| Total (2 units) | $3,410 | ||
UW: 25.0% down · 7.5% · 30yr · 1.5% tax · 5.0% vac · 8.0% maint · 8.0% mgmt
Financing live
Cash to close
- Down payment
- $91,250
- Closing costs
- $10,950
- Reserves months
- —
- Total cash needed
- —
Loan-product check · same deal, 3 products live
Conventional
25% down · 7.5% · 30yr
- Down + closing
- —
- Monthly P&I
- —
- Monthly cashflow
- —
- DSCR
- —
- Eligible?
- —
Personal DTI + credit; lowest rate.
DSCR
20% down · 8.5% · 30yr
- Down + closing
- —
- Monthly P&I
- —
- Monthly cashflow
- —
- DSCR
- —
- Eligible?
- —
No personal income docs; deal must DSCR.
Hard money
10% down · 12.0% · 12mo
- Down + closing
- —
- Monthly P&I
- —
- Monthly cashflow
- —
- DSCR
- —
- Eligible?
- —
Short-term bridge; refi at stabilization.
Rent comps 1 comps
| Address | Beds | Baths | Sqft | Rent | $/sqft | DOM | Units | Dist |
|---|---|---|---|---|---|---|---|---|
| 8117 Richland Dr Houston, TX | 5.0 | 2.0 | 1671 | $1,983 | $1.19 | 3d | 1 | 1.06mi |
Listing history 10 events
-
2026-05-01price $365,000 795-char remark
Show marketing remark (795 chars)
Excellent investment opportunity featuring a well-maintained duplex, each unit offering 3 bedrooms, 2 bathrooms, and approximately 1,150 square feet of living space. Both units showcase laminate flooring throughout, a well-appointed kitchen with granite countertops, and ample cabinetry for storage. The bedrooms are generously sized, with the primary suite including a large walk-in closet. Each unit also includes electric washer and dryer connections, with appliances available upon request. Unit A is currently occupied by a tenant at $1,700 per month, providing immediate rental income. Unit B is vacant and has a rental potential of $1,800 per month. This property offers strong cash flow potential in a desirable rental market, making it ideal for investors seeking a turnkey opportunity.
-
2026-04-07$385,000 Active 795-char remark
Show marketing remark (795 chars)
Excellent investment opportunity featuring a well-maintained duplex, each unit offering 3 bedrooms, 2 bathrooms, and approximately 1,150 square feet of living space. Both units showcase laminate flooring throughout, a well-appointed kitchen with granite countertops, and ample cabinetry for storage. The bedrooms are generously sized, with the primary suite including a large walk-in closet. Each unit also includes electric washer and dryer connections, with appliances available upon request. Unit A is currently occupied by a tenant at $1,700 per month, providing immediate rental income. Unit B is vacant and has a rental potential of $1,800 per month. This property offers strong cash flow potential in a desirable rental market, making it ideal for investors seeking a turnkey opportunity.
-
2026-03-14
-
2026-02-02historical
-
2025-11-19historical
-
2025-08-06$435,000 Active
-
2025-07-08
-
2023-08-03soldstatus Sold
-
2023-07-17status Pending, Continue to Show
-
2023-07-06$389,000 Active
ⓘ Source: listings_history table (triggers on properties + properties_extension) + one-shot
backfill from property_details.listing_events for pre-trigger history.
Nearby sold comps map
Loading sold comps map…
Walkable amenities ~0.75 mi
Loading nearby amenities…
Taxation est. · year 1
- Rental income
- $40,920
- − Mortgage interest
- −$20,446
- − Property taxes
- −$5,475
- − Insurance
- −$1,825
- − Repairs & maintenance
- −$3,274
- − Management
- −$3,274
- − Depreciation
- −$10,618
- Taxable loss
- −$3,991
- Est. tax savings @ 24.0%
- +$958
- After-tax cash flow
- $3,015/yr
For passive investors: Depreciation is non-cash, so a rental often shows a tax loss while cash-flowing — sheltering income. Rental losses are passive: they offset passive income freely, and up to $25,000/yr can offset ordinary (W-2) income if you actively participate and your MAGI is under $100k (phasing out to $0 by $150k); unused losses carry forward. On sale, claimed depreciation is recaptured at up to 25%, and gains may owe capital-gains tax (a 1031 exchange can defer both). Figures are a year-1 estimate at your 24.0% rate — not tax advice; consult a CPA.
Condition & rehab AI · 3 photos
This well-maintained, move-in-ready duplex offers a good investment opportunity with immediate rental income and strong cash flow potential.
Value-add opportunities
- Both Paint interior walls — Fresh paint enhances curb appeal and interior aesthetics
- Both Replace ceiling fan with energy-efficient model — Modern fan improves air circulation and reduces energy consumption
- Both Install smart thermostat — Saves energy and provides comfort control
Renovation cost estimate screening
Value-add ROI direction
- Both Paint interior walls — Fresh paint enhances curb appeal and interior aesthetics ↑
- Both Replace ceiling fan with energy-efficient model — Modern fan improves air circulation and reduces energy consumption ↑
- Both Install smart thermostat — Saves energy and provides comfort control ↑
ⓘ Cost ranges are severity-bucket heuristics (US national rule-of-thumb). Get contractor quotes + a written scope before underwriting a rehab budget.
Schools (NCES district)
- District
- Houston ISD
- NCES district ID
- 4823640
- Math proficiency
- 27% ▼ -18.00%
- Reading proficiency
- 35% ▼ -6.00%
- Median HH income
- $46,054
- Composite
- 26.63/100
- National rank
- #7173
- State rank
- #593 of 826 in TX
Livability — Houston
- Score
- 74/100
- State rank
- #184
- US rank
- #4771
Category grades
Schools grade is shown separately in the Schools card above.
Census & demographics
- Census place
- Houston, TX
- County
- Harris County · 4,702,590 people
- City population
- 3,226,434
- Metro
- Houston-The Woodlands-Sugar Land, TX
- Population (ZIP)
- 19,109
- Household income
- $38,357
- Rent vs Own
- Severe rent burden
- 1177.0
Population outlook (Harris County) Hauer SSP2
- Today (2025)
- 5,571,493 people
- By 2030
- 6,089,821 · +9.3%
- By 2040
- 7,142,806 · +28.2%
- By 2050
- 8,185,864 · +46.9%
- By 2075
- 10,574,329 · +89.8%
- By 2100
- 12,109,958 · +117.4%
Race, ethnicity, and origin ACS 2023
- Neighborhood character
- Majority Black (57%)
- Race & ethnicity
- Black 57% Hispanic / Latino 41% Two or more races 15% White 2%
- Hispanic origin (detail)
- Mexican 36%
- Foreign-born
- 13% · Canada
- Languages at home
- 61% English-only · Spanish 38%
Political lean MEDSL · Harris
- 2024 margin
- Lean D (+5.5) · D 52.0% · R 46.4% · Other 1.6%
- 2008→2024 swing
- +3.9pp toward D · 2008: 1.6pp · 2024: 5.5pp
- All cycles
- 2024: D+5.5 2020: D+13.3 2016: D+12.4 2012: D+0.1 2008: D+1.6
Not yet ingested
- Civics
- —
Market trends
- HPI YoY
- ▲ 5.25%
- Current HPI
- 267.7798
- Rent YoY
- ▼ -1.55%
- Metro
- Houston-The Woodlands-Sugar Land, TX
- State GDP YoY
- ▲ 3.95%
- F500 in state
- 110
Industry mix (Fortune 500 HQ in TX)
| Industry | F500 HQs | Revenue |
|---|---|---|
| Energy | 16 | $1,198B |
|
||
| Technology | 5 | $198B |
|
||
| Engineering / Construction | 4 | $72B |
|
||
| Energy Services | 3 | $60B |
|
||
| Utilities | 3 | $41B |
|
||
| Healthcare | 2 | $330B |
|
||
Price history
-6.2% since first listed10 events — show timeline
- 2026-05-01 Price Changed $365,000 HARMLS
- 2026-04-07 Listed $385,000 HARMLS
- 2026-03-14 Listed for Rent — HARMLS
- 2026-02-02 Rental Removed — HARMLS
- 2025-11-19 Listing Removed — HARMLS
- 2025-08-06 Listed $435,000 HARMLS
- 2025-07-08 Listed for Rent — HARMLS
- 2023-08-03 Sold (MLS) — HARMLS
- 2023-07-17 Pending — HARMLS
- 2023-07-06 Listed $389,000 HARMLS
Cash-flow waterfall
monthlySold comps — $/sqft
last 12 mo · ≤1 miLoading sold comps…