2200 Northcrest Dr · Crescent City, CA
Flood risk 1/10 · Minimal
- FEMA flood zone
- X (unshaded)
- Chance of flooding over 30 yrs
- 0.0%
- Est. flood insurance / yr
- $507 – $1,088
Fire risk 3/10 · Minor
- Est. fire insurance / yr
- $659 – $1,223
Heat risk 2/10 · Minimal
- Hot days now (above 71°F)
- 7 days/yr
- Hot days in 30 yrs
- 24 days/yr
Wind risk 1/10 · Minimal
- Chance of severe wind over 30 yrs
- —
Air-quality risk 6/10 · Moderate
- Unhealthy air days now
- 8 days/yr
- Unhealthy air days in 30 yrs
- 9 days/yr
Risk factors via First Street. Map © Google.
Why this score? — see what drove the B- grade
The composite is a weighted blend of 9 inputs, each scored 0–100. Each bar is that input's sub-score; the figure is the points it added to the 100-point composite (weight × sub-score).
- Cash flow +30.0/30.0
- 1% rule +10.0/10.0
- DSCR +10.0/10.0
- ARV discount +7.5/15.0
- Livability +2.9/5.0
- Schools +2.8/10.0
- Rent growth +2.5/5.0
- Condition / age +2.5/5.0
- Appreciation +0.0/10.0
$105,000
🖨 Deal sheet 📄 Offer letter ✓ Due diligence
Listing remarks MLS
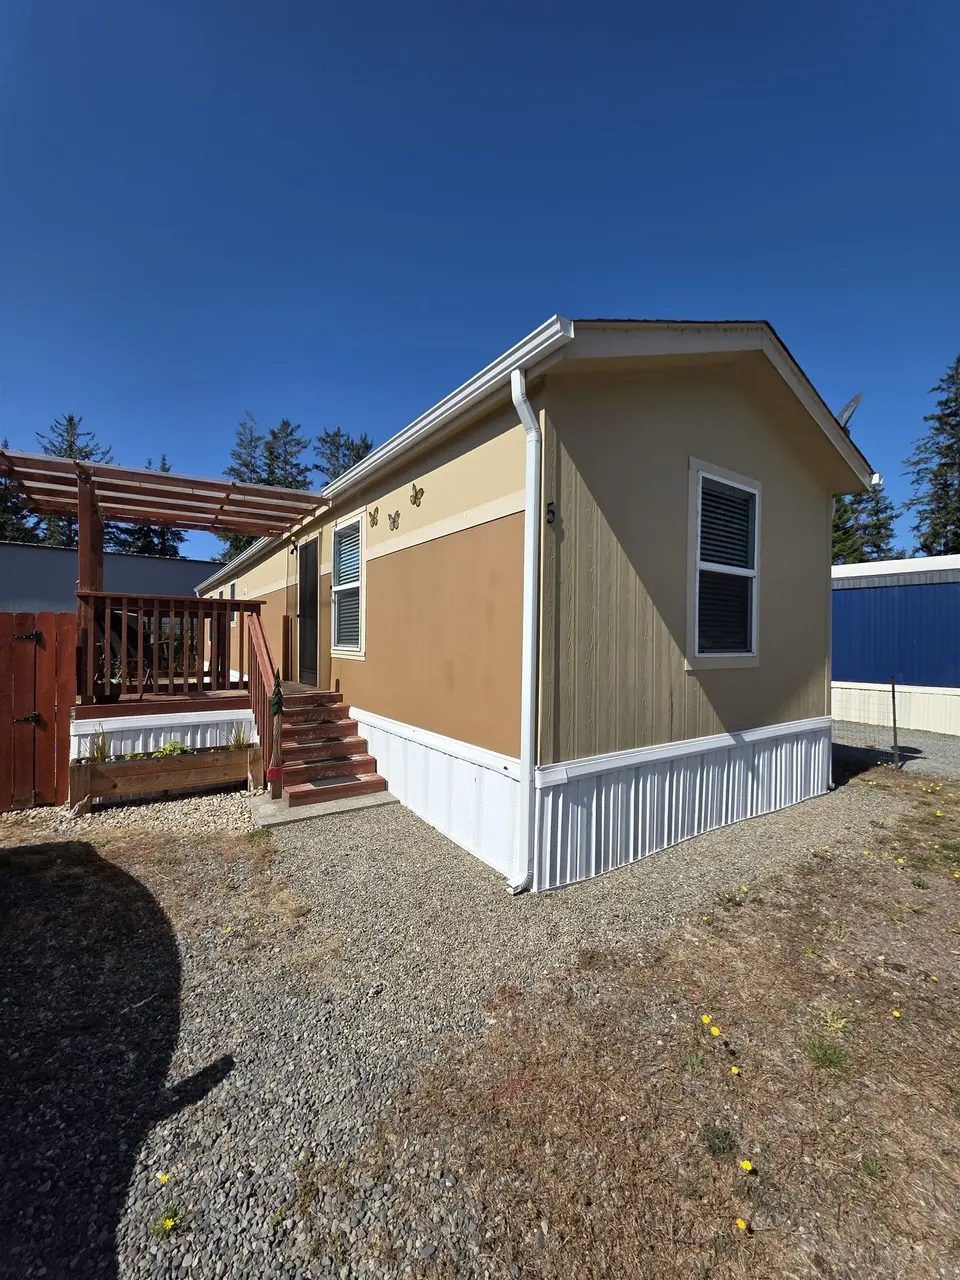
Discover comfort, efficiency, and modern living in this charming 2019 Palm Harbor “Tiny” home, offering 840 square feet of thoughtfully designed space in a welcoming, family-friendly park. Built with quality in mind, this home features durable Hardie board siding, finished sheetrock walls for a residential feel, and earthquake strapping for added structural security and peace of mind. The open and efficient layout maximizes every square foot, creating a bright and functional living environment. Outside, enjoy a generously sized fenced yard — perfect for entertaining, relaxing, or outdoor gatherings — along with a garden shed providing convenient additional storage. Space rent includes water, sewer, and trash services, simplifying monthly expenses. The park allows one small pet and is ideally situated near local schools and Sutter Coast Hospital, offering both convenience and community accessibility. A wonderful opportunity for affordable, low-maintenance coastal living.
Key facts
- Fenced yard
- Earthquake strapping
- Garden shed
Tags
Neighborhood map
What this means for you Summary
Snapshot
- This is a 2-bed/2.0-bath manufactured listed at $105k.
Deal economics
- At list price, monthly cash flow is $534 ($6k/yr) — positive.
- The deal already cash-flows at list — no discount required.
- Meets the 1% rule at list price ($2k rent vs $105k).
- Recommended offer: $92k (12.0% below list) — sets the bar for market timing.
- Cap rate 12.4% vs local median 3.1% in Crescent City — top-decile yield for the area; either an underpriced asset or a hidden risk that comps aren't pricing in. Stress-test before assuming the spread holds.
Location & tenants
- Location reads 57/100 on livability (#730 in CA) — a working-class tenant base; expect higher turnover. Strengths: health & safety A+, housing A; Watch: cost of living D, schools D-, crime F.
- Del Norte County Unified (town): math 25% / reading 36% proficiency, ranked #1,047 of 1,400 in CA (top 75%) — families likely to look elsewhere, expect single-tenant / working-renter base with shorter leases.
- Market conditions: 226 active listings in the ZIP; 55 units permitted in Del Norte County in 2024 (22 in 5+ unit buildings).
Forward outlook
- Local home prices are declining (-3.0%/yr); year-one equity from $726 of loan paydown is wiped out by about $3k of value loss. Plan a longer hold.
- Del Norte County population projected at -14% by 2050 — secular population decline; favor cash flow + early exit over multi-decade hold.
- At projected returns (-3.0% appreciation + 3.0% rent growth), your $29k cash investment doubles in ~6 years — after that, you're playing with house money.
Negotiation context
- It's been on market 122 days — a 12% lower offer ($92k) is reasonable based on typical stale-listing flexibility.
- 5 sale attempts since 2y ago with the ask held roughly flat each time — persistent listings suggest the price (not the market) is what's stuck; bring a comps-based counter.
- Current owner paid $65k; list at $105k implies a 62% gain — meaningful room to come down on a strong offer.
Questions for the listing agent
- It's been on market 122 days. Have you received any prior offers? Is the seller open to a 12% concession, seller financing, or rate buy-down credit?
- Why hasn't it sold? Are there any deal-killer items the seller is aware of (foundation, flood, title, zoning, code violations)?
- Is there a deadline driving the sale (1031 exchange, divorce, estate, relocation)? That informs how much negotiation room exists.
- Schools are D-rated, which usually means shorter tenancies and higher turnover. Who's the typical renter profile here, and what's been the actual vacancy rate?
- Crime grade is F in this area — have there been break-ins, vandalism, or insurance claims at this property in the last 3 years? What carrier currently insures it and at what premium?
- What's the average days-on-market for RENTAL listings here right now (not sales)? A rising rental-DOM trend means longer vacancies and softer asking-rent achievability than the comps imply.
- What's the recent tenant-quality profile in this submarket — average credit score on applications, eviction rate, late-payment / NSF rate, and stable-employment percentage? A property-management company in the area should have these aggregated.
- How much new for-sale + rental construction is in the pipeline within 1–3 miles? Heavy new supply typically softens prices + rents 12–24 months out; constrained supply supports both.
Investment metrics
- 1% rule
- 1.52% ✓
- Cap rate
- 12.39%
- Cash-on-cash
- 21.78%
- DSCR
- 1.97
- GRM
- 5.5
CMA / ARV
- ARV (median comp)
- $25,262
- List price
- $105,000
- Delta
- 315.65%
- Verdict
- OVERPRICED
- Comps
- 2 within 2.0 mi
Show comp detail 5 sales within ~0.75 mi
| Address | Dist | Beds/Ba | Sqft | Sold | Price | $/sf | Match |
|---|---|---|---|---|---|---|---|
| 2051 Northcrest Dr #4 | 0.29mi | 2/1.0 | 750 (-11%) | 13mo | $21,500 | $29 | 54 |
| 1811 Northcrest Dr #23 Dr | 0.53mi | 3/2.0 (+1) | 780 (-7%) | 6mo | $35,000 | $45 | 53 |
| 1811 Northcrest Dr #8 | 0.53mi | 2/2.0 | 768 (-9%) | 12mo | $15,000 | $20 | 51 |
| 1811 Northcrest Dr #16 | 0.53mi | 2/1.5 | 924 (+10%) | 16mo | $12,500 | $14 | 44 |
| 370 Alpine St | 0.42mi | 2/1.5 | 960 (+14%) | 18mo | $265,000 | $276 | 40 |
Match score weights: distance 35% · size 25% · config 20% · recency 20%. Top-matched comps best support the ARV.
Projected returns pro-forma
-3.0% appreciation · 3.0% rent growth · sell at horizon
- IRR
- 14.4%
- Equity multiple
- 1.58×
- Total profit
- $16,992
- Equity at exit
- $15,656
- IRR
- 23.2%
- Equity multiple
- 2.99×
- Total profit
- $58,652
- Equity at exit
- $9,078
Cash invested: $29,400 (down + closing). Projections, not guarantees.
Landlord ↔ Tenant lean methodology
- Overall (STATE)
- 18 Strongly Tenant-Friendly
- State California
- 18 Strongly Tenant-Friendly · D+13
- County
- — inherits STATE
- City
- — inherits STATE
ZIP-level market 95531
- Active inventory
- 226
- Price-to-rent
- 5.5×
Monthly cashflow live
- Estimated rent
- $1,594 medium interval (Pro) →
- Mortgage (P&I)
- −$551
- Tax est. 1.5%
- −$131 /mo · $1,575/yr
- Insurance
- −$44
- HOA
- −$0
- Vacancy / Maint / Mgmt
- −$335
- Net cashflow
- $534
Break-even live
UW: 25.0% down · 7.5% · 30yr · 1.5% tax · 5.0% vac · 8.0% maint · 8.0% mgmt
Financing live
Cash to close
- Down payment
- $26,250
- Closing costs
- $3,150
- Reserves months
- —
- Total cash needed
- —
Loan-product check · same deal, 3 products live
Conventional
25% down · 7.5% · 30yr
- Down + closing
- —
- Monthly P&I
- —
- Monthly cashflow
- —
- DSCR
- —
- Eligible?
- —
Personal DTI + credit; lowest rate.
DSCR
20% down · 8.5% · 30yr
- Down + closing
- —
- Monthly P&I
- —
- Monthly cashflow
- —
- DSCR
- —
- Eligible?
- —
No personal income docs; deal must DSCR.
Hard money
10% down · 12.0% · 12mo
- Down + closing
- —
- Monthly P&I
- —
- Monthly cashflow
- —
- DSCR
- —
- Eligible?
- —
Short-term bridge; refi at stabilization.
Listing history 36 events
-
2026-06-19days on market $105,000 Active 122 DOM
-
2026-06-18days on market $105,000 Active 121 DOM
-
2026-06-17days on market $105,000 Active 120 DOM
-
2026-06-16days on market $105,000 Active 119 DOM
-
2026-06-15days on market $105,000 Active 118 DOM
-
2026-06-14days on market $105,000 Active 116 DOM
-
2026-06-12days on market $105,000 Active 115 DOM
-
2026-06-09days on market $105,000 Active 112 DOM
-
2026-06-08days on market $105,000 Active 111 DOM
-
2026-06-07days on market $105,000 Active 110 DOM
-
2026-06-07days on market $105,000 Active 109 DOM
-
2026-06-04days on market $105,000 Active 106 DOM
-
2026-06-02days on market $105,000 Active 105 DOM
-
2026-06-01days on market $105,000 Active 104 DOM
-
2026-05-31days on market $105,000 Active 103 DOM
-
2026-05-31days on market $105,000 Active 102 DOM
-
2026-04-25price $105,000 1008-char remark
Show marketing remark (1008 chars)
Discover comfort, efficiency, and modern living in this charming 2019 Palm Harbor “Tiny” home, offering 840 square feet of thoughtfully designed space in a welcoming, family-friendly park. Built with quality in mind, this home features durable Hardie board siding, finished sheetrock walls for a residential feel, and earthquake strapping for added structural security and peace of mind. The open and efficient layout maximizes every square foot, creating a bright and functional living environment. Outside, enjoy a generously sized fenced yard — perfect for entertaining, relaxing, or outdoor gatherings — along with a garden shed providing convenient additional storage. Space rent includes water, sewer, and trash services, simplifying monthly expenses. The park allows one small pet and is ideally situated near local schools and Sutter Coast Hospital, offering both convenience and community accessibility. A wonderful opportunity for affordable, low-maintenance coastal living.
-
2026-02-18$110,000 Active 1008-char remark
Show marketing remark (1008 chars)
Discover comfort, efficiency, and modern living in this charming 2019 Palm Harbor “Tiny” home, offering 840 square feet of thoughtfully designed space in a welcoming, family-friendly park. Built with quality in mind, this home features durable Hardie board siding, finished sheetrock walls for a residential feel, and earthquake strapping for added structural security and peace of mind. The open and efficient layout maximizes every square foot, creating a bright and functional living environment. Outside, enjoy a generously sized fenced yard — perfect for entertaining, relaxing, or outdoor gatherings — along with a garden shed providing convenient additional storage. Space rent includes water, sewer, and trash services, simplifying monthly expenses. The park allows one small pet and is ideally situated near local schools and Sutter Coast Hospital, offering both convenience and community accessibility. A wonderful opportunity for affordable, low-maintenance coastal living.
-
2025-09-17price $105,000
-
2025-08-22$110,000 Active
-
2025-06-06soldstatus $65,000 Closed
-
2025-04-08price $68,500
-
2025-03-28$71,000 Active
-
2025-03-11soldstatus $6,700,000
-
2024-09-04price $73,500
-
2024-08-20price $83,900
-
2024-08-14$90,000 Active
-
2024-07-15soldstatus $90,000 Closed
-
2024-06-26historical Active Under Contract
-
2024-05-20price $95,500
-
2024-04-24price $97,500
-
2024-03-28price $99,900
-
2024-03-15price $105,000
-
2024-02-26$110,000 Active
-
2023-10-20soldstatus $4,750,000
-
2014-04-24soldstatus $515,000
ⓘ Source: listings_history table (triggers on properties + properties_extension) + one-shot
backfill from property_details.listing_events for pre-trigger history.
Climate risk First Street
- Flood 1/10 Low FEMA zone X (unshaded) · 0% chance over 30 yrs
- Wildfire 3/10 Moderate
- Heat 2/10 Low 7 d/yr ≥71°F today · 24 d/yr by 30 yrs out
- Wind 1/10 Low
- Air quality 6/10 Major 8 unhealthy d/yr today · 9 by 30 yrs out
Nearby sold comps map
Loading sold comps map…
Walkable amenities ~0.75 mi
Loading nearby amenities…
Taxation est. · year 1
- Rental income
- $19,127
- − Mortgage interest
- −$5,882
- − Property taxes
- −$1,575
- − Insurance
- −$525
- − Repairs & maintenance
- −$1,530
- − Management
- −$1,530
- − Depreciation
- −$3,055
- Taxable income
- $5,030
- Est. tax owed @ 24.0%
- −$1,207
- After-tax cash flow
- $5,195/yr
For passive investors: Depreciation is non-cash, so a rental often shows a tax loss while cash-flowing — sheltering income. Rental losses are passive: they offset passive income freely, and up to $25,000/yr can offset ordinary (W-2) income if you actively participate and your MAGI is under $100k (phasing out to $0 by $150k); unused losses carry forward. On sale, claimed depreciation is recaptured at up to 25%, and gains may owe capital-gains tax (a 1031 exchange can defer both). Figures are a year-1 estimate at your 24.0% rate — not tax advice; consult a CPA.
Schools (NCES district)
- District
- Del Norte County Unified
- NCES district ID
- 0610770
- Math proficiency
- 25% ▲ 1.00%
- Reading proficiency
- 36% ▲ 1.00%
- Median HH income
- $39,747
- Composite
- 28.43/100
- National rank
- #12110
- State rank
- #1047 of 1400 in CA
Livability — Crescent City
- Score
- 57/100
- State rank
- #730
- US rank
- #21544
Category grades
Schools grade is shown separately in the Schools card above.
Census & demographics
- Population (ZIP)
- 22,491
Population outlook (Del Norte County) Hauer SSP2
- Today (2025)
- 25,011 people
- By 2030
- 24,204 · -3.2%
- By 2040
- 22,826 · -8.7%
- By 2050
- 21,495 · -14.1%
- By 2075
- 18,487 · -26.1%
- By 2100
- 16,113 · -35.6%
Race, ethnicity, and origin ACS 2023
- Neighborhood character
- Diverse neighborhood (Simpson 0.58)
- Race & ethnicity
- White 61% Hispanic / Latino 20% Two or more races 12% Native American 5% Asian 4% Black 3%
- Hispanic origin (detail)
- Mexican 15%
- Common ancestry
- Slovak 4% Russian 2% Lithuanian 2%
- Foreign-born
- 8% · Canada, Vietnam, South Korea
- Languages at home
- 88% English-only · Spanish 8% Other Asian/Pacific 2% Vietnamese 1%
Political lean MEDSL · Del Norte
- 2024 margin
- R (+16.4) · D 40.4% · R 56.8% · Other 2.8%
- 2008→2024 swing
- -9.7pp toward R · 2008: -6.8pp · 2024: -16.4pp
- All cycles
- 2024: R+16.4 2020: R+15.6 2016: R+17.6 2012: R+10.8 2008: R+6.8
Not yet ingested
- Civics
- —
Market trends
- HPI YoY
- ▼ -300.53%
- Current HPI
- 148.4819
- Rent YoY
- —
- Metro
- —
- State GDP YoY
- ▲ 3.21%
- F500 in state
- 116
Industry mix (Fortune 500 HQ in CA)
| Industry | F500 HQs | Revenue |
|---|---|---|
| Technology | 27 | $1,492B |
|
||
| Financial Services | 3 | $174B |
|
||
| Retail | 3 | $44B |
|
||
| Insurance | 3 | $26B |
|
||
| Media / Entertainment | 2 | $115B |
|
||
| Pharmaceuticals / Biotech | 2 | $62B |
|
||
Price history
-79.6% since first listed20 events — show timeline
- 2026-04-25 Price Changed $105,000 DNAORMLS
- 2026-02-18 Listed $110,000 DNAORMLS
- 2025-09-17 Price Changed $105,000 DNAORMLS
- 2025-08-22 Listed $110,000 DNAORMLS
- 2025-06-06 Sold (MLS) $65,000 DNAORMLS
- 2025-04-08 Price Changed $68,500 DNAORMLS
- 2025-03-28 Listed $71,000 DNAORMLS
- 2025-03-11 Sold (Public Records) $6,700,000 Public Records
- 2024-09-04 Price Changed $73,500 DNAORMLS
- 2024-08-20 Price Changed $83,900 DNAORMLS
- 2024-08-14 Listed $90,000 DNAORMLS
- 2024-07-15 Sold (MLS) $90,000 DNAORMLS
- 2024-06-26 Contingent — DNAORMLS
- 2024-05-20 Price Changed $95,500 DNAORMLS
- 2024-04-24 Price Changed $97,500 DNAORMLS
- 2024-03-28 Price Changed $99,900 DNAORMLS
- 2024-03-15 Price Changed $105,000 DNAORMLS
- 2024-02-26 Listed $110,000 DNAORMLS
- 2023-10-20 Sold (Public Records) $4,750,000 Public Records
- 2014-04-24 Sold (Public Records) $515,000 Public Records
Property tax history
+16.9%/yrLatest (2025): $20,462 · +4.0% YoY. Source: county tax records.
Cash-flow waterfall
monthlySold comps — $/sqft
last 12 mo · ≤1 miLoading sold comps…