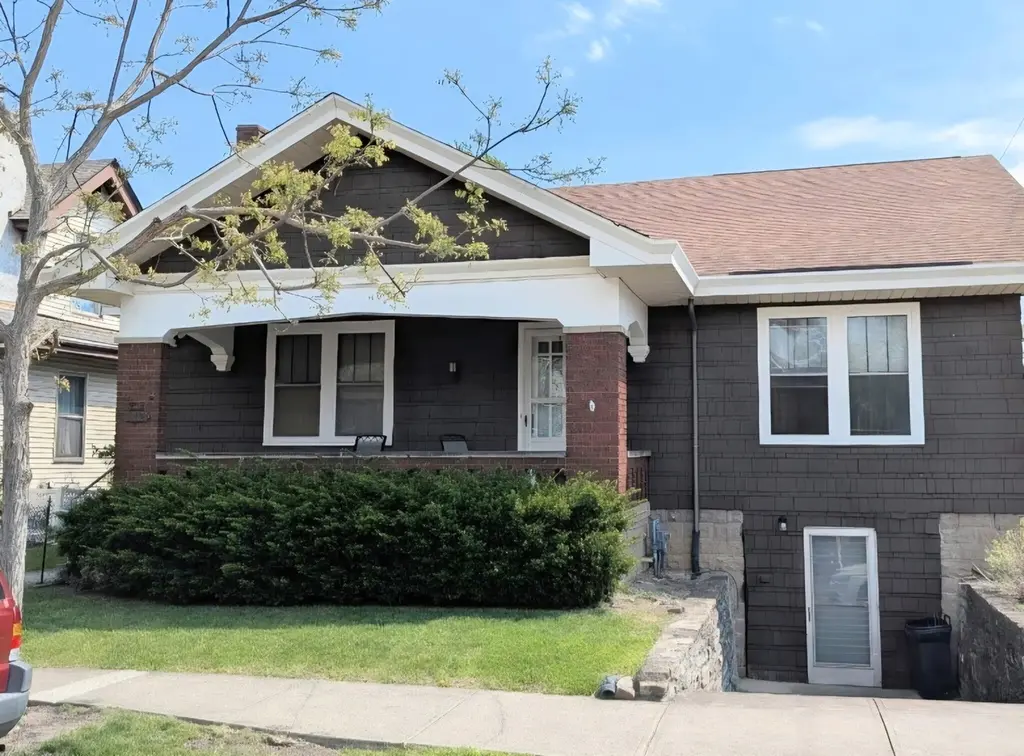
1942 Glenway Ave · Covington, KY
Flood risk 1/10 · Minimal
- FEMA flood zone
- X (unshaded)
- Chance of flooding over 30 yrs
- 0.0%
- Est. flood insurance / yr
- $507 – $1,088
Fire risk 1/10 · Minimal
- Est. fire insurance / yr
- $839 – $1,559
Heat risk 5/10 · Moderate
- Hot days now (above 103°F)
- 7 days/yr
- Hot days in 30 yrs
- 20 days/yr
Wind risk 2/10 · Minimal
- Chance of severe wind over 30 yrs
- 1.0%
Air-quality risk 3/10 · Minor
- Unhealthy air days now
- 2 days/yr
- Unhealthy air days in 30 yrs
- 3 days/yr
Risk factors via First Street. Map © Google.
Why this score? — see what drove the B- grade
The composite is a weighted blend of 9 inputs, each scored 0–100. Each bar is that input's sub-score; the figure is the points it added to the 100-point composite (weight × sub-score).
- Cash flow +30.0/30.0
- 1% rule +10.0/10.0
- DSCR +10.0/10.0
- ARV discount +7.5/15.0
- Livability +4.3/5.0
- Rent growth +3.8/5.0
- Condition / age +2.5/5.0
- Schools +1.5/10.0
- Appreciation +0.0/10.0
$60,000
🖨 Deal sheet 📄 Offer letter ✓ Due diligence
Listing remarks
Short sale. Property sold as-is. Foundation has vertical cracks at three corners extending from ground level--all require repair. Knob and tube electrical present and will need remediation. No A/C--system will need to be added. Flooring throughout is worn and needs updating. Kitchen is outdated and in rough condition. Bathroom floor has water damage and will need to be replaced.
Key facts
- 4,122 sq ft lot
- Garage
- Built 1923
Neighborhood map
What this means for you Summary
Snapshot
- This is a 3-bed/1.5-bath single-family listed at $60k.
Deal economics
- At list price, monthly cash flow is $1k ($15k/yr) — positive.
- The deal already cash-flows at list — no discount required.
- Meets the 1% rule at list price ($2k rent vs $60k).
- Cap rate 31.6% vs local median 5.3% in Covington — top-decile yield for the area; either an underpriced asset or a hidden risk that comps aren't pricing in. Stress-test before assuming the spread holds.
Location & tenants
- Location reads 86/100 on livability (#40 in KY, #376 nationally) — a professional / high-income tenant draw. Strengths: amenities A+, commute A+, cost of living A+; Watch: employment D+.
- Covington Independent (suburban): math 10% / reading 27% proficiency, ranked #162 of 165 in KY (top 98%) — low school quality limits family demand, transient renter base, plan for 1-2y turnover; 78% free/reduced lunch — lower-income household profile, screen leases tightly.
- Zoned schools: Sixth District Elementary School (math 8% / reading 17%, grade F, #630 of 676 statewide, top 95%, 446 students, 84% FRL); Holmes Middle School (math 8% / reading 26%, grade F, #211 of 217 statewide, top 97%, 656 students, 84% FRL); Holmes High School (math 12% / reading 17%, grade F, #227 of 254 statewide, top 89%, 878 students, 80% FRL) — zoned schools at 83% FRL track the district average.
- Market conditions: Rents rising fast (+5.1%/yr); 59 active listings in the ZIP; 5 comparable units currently listed for rent nearby; rentals leasing fast (median 12d on market — plan ~1-2 weeks tenant-placement turnaround); 699 units permitted in Kenton County in 2024 (287 in 5+ unit buildings).
- This rent runs 43% of the median local income ($61k/yr) — at the standard rent-burdened threshold; future hikes will face affordability resistance.
Forward outlook
- Local home prices are declining (-3.0%/yr); year-one equity from $415 of loan paydown is wiped out by about $2k of value loss. Plan a longer hold.
- Kenton County population projected at +5% by 2050 — modest demand growth; plan on rents tracking national, not racing it.
- At projected returns (-3.0% appreciation + 5.1% rent growth), your $17k cash investment doubles in ~2 years — after that, you're playing with house money.
Negotiation context
- Only 1 days on market — expect competitive offers; lowballing is unlikely to land.
Risks & watch-outs
- Watch-outs: property tax is 2.5% of price; built in 1923 — expect roof / HVAC / electrical / plumbing capex.
- Climate carrying-cost: extreme-heat days projected 7→20/yr by 2055 (HVAC capex compounding) — expect insurance premiums to compound above CPI over the hold.
Questions for the listing agent
- Built in 1923 — when were the roof, HVAC, electrical panel, plumbing, and water heater last replaced?
- Property tax is high relative to price — has the assessment been appealed recently, and will the sale trigger a re-assessment?
- Is there a deadline driving the sale (1031 exchange, divorce, estate, relocation)? That informs how much negotiation room exists.
- What's the average days-on-market for RENTAL listings here right now (not sales)? A rising rental-DOM trend means longer vacancies and softer asking-rent achievability than the comps imply.
- What's the recent tenant-quality profile in this submarket — average credit score on applications, eviction rate, late-payment / NSF rate, and stable-employment percentage? A property-management company in the area should have these aggregated.
- How much new for-sale + rental construction is in the pipeline within 1–3 miles? Heavy new supply typically softens prices + rents 12–24 months out; constrained supply supports both.
Investment metrics
- 1% rule
- 3.65% ✓
- Cap rate
- 31.62%
- Cash-on-cash
- 90.44%
- DSCR
- 5.02
- GRM
- 2.3
CMA / ARV
- ARV (on-the-fly)
- $313,740
- Comps found
- 12
Show comp detail 12 sales within ~0.75 mi
| Address | Dist | Beds/Ba | Sqft | Sold | Price | $/sf | Match |
|---|---|---|---|---|---|---|---|
| 2110 Eastern Ave | 0.16mi | 4/2.5 (+1) | 2,325 (0%) | 3mo | $450,000 | $194 | 81 |
| 1549 Nancy St | 0.45mi | 4/2.5 (+1) | 2,320 (-0%) | 12mo | $253,000 | $109 | 60 |
| 1613 Greenup St | 0.52mi | 4/3.0 (+1) | 2,280 (-2%) | 4mo | $350,000 | $154 | 58 |
| 1809 Greenup St | 0.43mi | 2/1.5 (-1) | 2,294 (-1%) | 20mo | $295,000 | $129 | 57 |
| 1919 Greenup St | 0.39mi | 4/3.5 (+1) | 2,288 (-2%) | 12mo | $391,500 | $171 | 56 |
| 13 E 24th St | 0.55mi | 3/1.5 | 2,110 (-9%) | 6mo | $270,000 | $128 | 54 |
| 1921 Russell St | 0.72mi | 4/2.0 (+1) | 2,280 (-2%) | 15mo | $307,000 | $135 | 44 |
| 302 Byrd St | 0.66mi | 3/2.0 | 2,064 (-11%) | 16mo | $275,000 | $133 | 35 |
| 1606 Scott St | 0.56mi | 4/2.0 (+1) | 2,588 (+11%) | 15mo | $285,000 | $110 | 35 |
| 501 Grandview Ave | 0.50mi | 3/2.5 | 1,978 (-15%) | 18mo | $368,000 | $186 | 33 |
| 615 Grandview Ave | 0.57mi | 3/2.5 | 2,000 (-14%) | 20mo | $200,000 | $100 | 30 |
| 2216 Madison Ave | 0.52mi | 4/3.0 (+1) | 2,000 (-14%) | 17mo | $310,000 | $155 | 27 |
Match score weights: distance 35% · size 25% · config 20% · recency 20%. Top-matched comps best support the ARV.
Projected returns pro-forma
-3.0% appreciation · 5.13% rent growth · sell at horizon
- IRR
- 93.6%
- Equity multiple
- 5.51×
- Total profit
- $75,784
- Equity at exit
- $8,946
- IRR
- 96.9%
- Equity multiple
- 12.35×
- Total profit
- $190,660
- Equity at exit
- $5,188
Cash invested: $16,800 (down + closing). Projections, not guarantees.
Landlord ↔ Tenant lean methodology
- Overall (STATE)
- 83 Strongly Landlord-Friendly
- State Kentucky
- 83 Strongly Landlord-Friendly · R+16
- County
- — inherits STATE
- City
- — inherits STATE
ZIP-level market 41014
- Rents YoY
- 5.1%
- Active inventory
- 59
- Price-to-rent
- 2.3×
Monthly cashflow live
- Estimated rent
- $2,192 high interval (Pro) →
- Mortgage (P&I)
- −$315
- Tax from tax record
- −$126 /mo · $1,510/yr
- Insurance
- −$25
- HOA
- −$0
- Vacancy / Maint / Mgmt
- −$460
- Net cashflow
- $1,266
Break-even live
UW: 25.0% down · 7.5% · 30yr · 1.5% tax · 5.0% vac · 8.0% maint · 8.0% mgmt
Financing live
Cash to close
- Down payment
- $15,000
- Closing costs
- $1,800
- Reserves months
- —
- Total cash needed
- —
Loan-product check · same deal, 3 products live
Conventional
25% down · 7.5% · 30yr
- Down + closing
- —
- Monthly P&I
- —
- Monthly cashflow
- —
- DSCR
- —
- Eligible?
- —
Personal DTI + credit; lowest rate.
DSCR
20% down · 8.5% · 30yr
- Down + closing
- —
- Monthly P&I
- —
- Monthly cashflow
- —
- DSCR
- —
- Eligible?
- —
No personal income docs; deal must DSCR.
Hard money
10% down · 12.0% · 12mo
- Down + closing
- —
- Monthly P&I
- —
- Monthly cashflow
- —
- DSCR
- —
- Eligible?
- —
Short-term bridge; refi at stabilization.
Rent comps 5 comps
| Address | Beds | Baths | Sqft | Rent | $/sqft | DOM | Units | Dist |
|---|---|---|---|---|---|---|---|---|
| 2030 Mackoy St Covington, KY | 3.0 | 1.5 | 1598 | $1,779 | $1.11 | 4d | 1 | 0.32mi |
| 1927 Scott St Apt 1 Covington, KY | 3.0 | 2.0 | 1865 | $2,100 | $1.13 | 20d | 1 | 0.46mi |
| 1700 Aspen Pines Dr Wilder, KY | 1.0–3.0 | 1.0–2.5 | 1420 | $2,365 | $1.67 | 2d | 14 | 0.74mi |
| 140 W 13th St Newport, KY | 3.0 | 3.5 | 2505 | $4,200 | $1.68 | 12d | 1 | 0.97mi |
| 1205 Lee St Unit 3 Covington, KY | 3.0 | 2.5 | 1850 | $3,000 | $1.62 | 23d | 1 | 1.19mi |
Listing history 3 events
-
2026-04-11status Pending
-
2026-04-10$60,000 Active
-
2018-06-26soldstatus $140,000
ⓘ Source: listings_history table (triggers on properties + properties_extension) + one-shot
backfill from property_details.listing_events for pre-trigger history.
Tax reassessment forecast KY · Resets to sale price
- Current annual tax
- $1,510 · $126/mo
- Projected year-2 tax
- $1,510 · $126/mo
- Expected delta
- $0/yr ($0/mo · 0.0%)
ⓘ Screening estimate from a state-policy table — verify with the county assessor before closing.
Climate risk First Street
- Flood 1/10 Low FEMA zone X (unshaded) · 0% chance over 30 yrs
- Wildfire 1/10 Low
- Heat 5/10 Major 7 d/yr ≥103°F today · 20 d/yr by 30 yrs out
- Wind 2/10 Low 100% chance of damaging wind over 30 yrs
- Air quality 3/10 Moderate 2 unhealthy d/yr today · 3 by 30 yrs out
Nearby sold comps map
Loading sold comps map…
Walkable amenities ~0.75 mi
Loading nearby amenities…
Taxation est. · year 1
- Rental income
- $26,304
- − Mortgage interest
- −$3,361
- − Property taxes
- −$1,510
- − Insurance
- −$300
- − Repairs & maintenance
- −$2,104
- − Management
- −$2,104
- − Depreciation
- −$1,745
- Taxable income
- $15,179
- Est. tax owed @ 24.0%
- −$3,643
- After-tax cash flow
- $11,551/yr
For passive investors: Depreciation is non-cash, so a rental often shows a tax loss while cash-flowing — sheltering income. Rental losses are passive: they offset passive income freely, and up to $25,000/yr can offset ordinary (W-2) income if you actively participate and your MAGI is under $100k (phasing out to $0 by $150k); unused losses carry forward. On sale, claimed depreciation is recaptured at up to 25%, and gains may owe capital-gains tax (a 1031 exchange can defer both). Figures are a year-1 estimate at your 24.0% rate — not tax advice; consult a CPA.
Schools (NCES district)
- District
- Covington Independent
- NCES district ID
- 2101350
- Math proficiency
- 10% ▼ -20.00%
- Reading proficiency
- 27% ▼ -14.00%
- Median HH income
- $33,681
- Composite
- 15.04/100
- National rank
- #9353
- State rank
- #162 of 165 in KY
Livability — Covington
- Score
- 86/100
- State rank
- #40
- US rank
- #376
Category grades
Schools grade is shown separately in the Schools card above.
Census & demographics
- Census place
- Covington, KY
- County
- Kenton County · 142,881 people
- City population
- 34,373
- Metro
- Cincinnati, OH-KY-IN
- Population (ZIP)
- 7,392
- Household income
- $61,382
- Rent vs Own
- Severe rent burden
- 511.0
Population outlook (Kenton County) Hauer SSP2
- Today (2025)
- 174,205 people
- By 2030
- 177,897 · +2.1%
- By 2040
- 182,671 · +4.9%
- By 2050
- 183,543 · +5.4%
- By 2075
- 178,977 · +2.7%
- By 2100
- 159,920 · -8.2%
Race, ethnicity, and origin ACS 2023
- Neighborhood character
- Predominantly White (71%)
- Race & ethnicity
- White 71% Two or more races 11% Hispanic / Latino 10% Black 8% Asian 2%
- Hispanic origin (detail)
- Mexican 1%
- Common ancestry
- Romanian 2% Lithuanian 1% Italian 1%
- Foreign-born
- 6% · Canada, China
- Languages at home
- 91% English-only · Spanish 8%
Political lean MEDSL · Kenton
- 2024 margin
- Strong R (+21.7) · D 38.2% · R 59.9% · Other 1.9%
- 2008→2024 swing
- -0.9pp no change · 2008: -20.9pp · 2024: -21.7pp
- All cycles
- 2024: R+21.7 2020: R+19.3 2016: R+26.1 2012: R+24.3 2008: R+20.9
Not yet ingested
- Civics
- —
Market trends
- HPI YoY
- ▼ -172.77%
- Current HPI
- 233.8216
- Rent YoY
- ▲ 5.13%
- Metro
- Cincinnati, OH-KY-IN
- State GDP YoY
- ▲ 1.81%
- F500 in state
- 4
Industry mix (Fortune 500 HQ in KY)
| Industry | F500 HQs | Revenue |
|---|---|---|
| Healthcare | 1 | $118B |
|
||
| Food / Beverage | 1 | $7B |
|
||
Price history
-57.1% since first listed3 events — show timeline
- 2026-04-11 Pending — NKMLS
- 2026-04-10 Listed $60,000 NKMLS
- 2018-06-26 Sold (Public Records) $140,000 Public Records
Property tax history
+6.5%/yrLatest (2025): $1,510 · -1.6% YoY. Source: county tax records.
Cash-flow waterfall
monthlySold comps — $/sqft
last 12 mo · ≤1 miLoading sold comps…