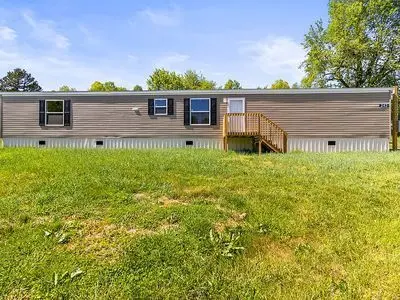
243 Mary Lyn Dr · Millers Creek, NC
Flood risk 1/10 · Minimal
- FEMA flood zone
- X (unshaded)
- Chance of flooding over 30 yrs
- 0.0%
- Est. flood insurance / yr
- $473 – $860
Fire risk 5/10 · Moderate
- Est. fire insurance / yr
- $906 – $1,684
Heat risk 4/10 · Minor
- Hot days now (above 99°F)
- 7 days/yr
- Hot days in 30 yrs
- 17 days/yr
Wind risk 2/10 · Minimal
- Chance of severe wind over 30 yrs
- 1.0%
Air-quality risk 1/10 · Minimal
- Unhealthy air days now
- 0 days/yr
- Unhealthy air days in 30 yrs
- 0 days/yr
Risk factors via First Street. Map © Google.
Why this score? — see what drove the B+ grade
The composite is a weighted blend of 9 inputs, each scored 0–100. Each bar is that input's sub-score; the figure is the points it added to the 100-point composite (weight × sub-score).
- Cash flow +26.8/30.0
- Appreciation +10.0/10.0
- DSCR +9.2/10.0
- ARV discount +7.5/15.0
- 1% rule +7.2/10.0
- Schools +4.3/10.0
- Condition / age +4.0/5.0
- Livability +3.5/5.0
- Rent growth +2.5/5.0
$86,250
🖨 Deal sheet 📄 Offer letter ✓ Due diligence
Listing remarks
FOR SALE & acirc; & euro; & ldquo; MOVE-IN READY 3 BED & acirc; & euro; & cent; 2 BATH MOBILE HOME & acirc; & euro; & ldquo; $76,500 Miller& apos; s Creek, NC & acirc; & euro; & cent; Quiet Community & acirc; & euro; & cent; Flexible Financing Available Looking for a beautiful home in a peaceful setting with easy access to everything? This 3 bedroom, 2 bathroom mobile home offers a modern, open layout in a calm, well-kept community. Home Features: * 3 comfortable bedrooms * 2 full bathrooms * Open-concept living room + kitchen * Kitchen island + pantry for extra space and storage * Move-in ready Location Highl
Key facts
- Kitchen island
- Move in ready
- Built 2026
Tags
Neighborhood map
What this means for you Summary
Snapshot
- This is a 3-bed/2.0-bath other listed at $86k. Condition is rated good.
Deal economics
- At list price, monthly cash flow is $236 ($3k/yr) — positive.
- The deal already cash-flows at list — no discount required.
- Meets the 1% rule at list price ($1k rent vs $86k).
- Recommended offer: $84k (3.0% below list) — sets the bar for market timing.
- Cap rate 9.6% vs local median 1.8% in Millers Creek — top-decile yield for the area; either an underpriced asset or a hidden risk that comps aren't pricing in. Stress-test before assuming the spread holds.
Location & tenants
- Location reads 69/100 on livability (#146 in NC) — a middle-class / working-renter tenant base. Strengths: crime A+, cost of living A+, housing A; Watch: health & safety C-, schools D+, amenities F.
- Wilkes County Schools (rural): math 55% / reading 50% proficiency, ranked #59 of 178 in NC (top 33%) — acceptable for families but not a draw, mixed tenant base, ~2y average lease.
- Market conditions: 44 active listings in the ZIP; 134 units permitted in Wilkes County in 2024 (0 in 5+ unit buildings).
Forward outlook
- In year one you build about $9k of equity ($596 loan paydown + $9k appreciation (10.0% local appreciation)).
- Wilkes County population projected at -18% by 2050 — secular population decline; favor cash flow + early exit over multi-decade hold.
- At projected returns (10.0% appreciation + 3.0% rent growth), your $24k cash investment doubles in ~2 years — after that, you're playing with house money.
- By year 4, paydown + projected appreciation supports a ~$33k cash-out refi (75% LTV) — recoverable capital for the next deal without selling this one.
Negotiation context
- It's been on market 38 days — a 3% lower offer ($84k) is reasonable based on typical stale-listing flexibility.
Risks & watch-outs
- Climate carrying-cost: moderate wildfire risk — expect insurance premiums to compound above CPI over the hold.
Questions for the listing agent
- It's been on market 38 days. Have you received any prior offers? Is the seller open to a 3% concession, seller financing, or rate buy-down credit?
- Is there a deadline driving the sale (1031 exchange, divorce, estate, relocation)? That informs how much negotiation room exists.
- Schools are D-rated, which usually means shorter tenancies and higher turnover. Who's the typical renter profile here, and what's been the actual vacancy rate?
- What's the average days-on-market for RENTAL listings here right now (not sales)? A rising rental-DOM trend means longer vacancies and softer asking-rent achievability than the comps imply.
- What's the recent tenant-quality profile in this submarket — average credit score on applications, eviction rate, late-payment / NSF rate, and stable-employment percentage? A property-management company in the area should have these aggregated.
- How much new for-sale + rental construction is in the pipeline within 1–3 miles? Heavy new supply typically softens prices + rents 12–24 months out; constrained supply supports both.
Investment metrics
- 1% rule
- 1.22% ✓
- Cap rate
- 9.57%
- Cash-on-cash
- 11.72%
- DSCR
- 1.52
- GRM
- 6.8
CMA / ARV
No comps found within radius.
Projected returns pro-forma
10.0% appreciation · 3.0% rent growth · sell at horizon
- IRR
- 32.9%
- Equity multiple
- 3.57×
- Total profit
- $62,014
- Equity at exit
- $77,701
- IRR
- 28.4%
- Equity multiple
- 8.07×
- Total profit
- $170,838
- Equity at exit
- $167,565
Cash invested: $24,150 (down + closing). Projections, not guarantees.
Landlord ↔ Tenant lean methodology
- Overall (STATE)
- 85 Strongly Landlord-Friendly
- State North Carolina
- 85 Strongly Landlord-Friendly · R+3
- County
- — inherits STATE
- City
- — inherits STATE
ZIP-level market 28651
- Home prices YoY
- 16.8%
- Active inventory
- 44
- Price-to-rent
- 6.8×
Monthly cashflow live
- Estimated rent
- $1,053 medium interval (Pro) →
- Mortgage (P&I)
- −$452
- Tax est. 1.5%
- −$108 /mo · $1,294/yr
- Insurance
- −$36
- HOA
- −$0
- Vacancy / Maint / Mgmt
- −$221
- Net cashflow
- $236
Break-even live
UW: 25.0% down · 7.5% · 30yr · 1.5% tax · 5.0% vac · 8.0% maint · 8.0% mgmt
Financing live
Cash to close
- Down payment
- $21,562
- Closing costs
- $2,588
- Reserves months
- —
- Total cash needed
- —
Loan-product check · same deal, 3 products live
Conventional
25% down · 7.5% · 30yr
- Down + closing
- —
- Monthly P&I
- —
- Monthly cashflow
- —
- DSCR
- —
- Eligible?
- —
Personal DTI + credit; lowest rate.
DSCR
20% down · 8.5% · 30yr
- Down + closing
- —
- Monthly P&I
- —
- Monthly cashflow
- —
- DSCR
- —
- Eligible?
- —
No personal income docs; deal must DSCR.
Hard money
10% down · 12.0% · 12mo
- Down + closing
- —
- Monthly P&I
- —
- Monthly cashflow
- —
- DSCR
- —
- Eligible?
- —
Short-term bridge; refi at stabilization.
Listing history 17 events
-
2026-06-19days on market $86,250 Active 38 DOM
-
2026-06-18days on market $86,250 Active 37 DOM
-
2026-06-17days on market $86,250 Active 36 DOM
-
2026-06-16days on market $86,250 Active 35 DOM
-
2026-06-15days on market $86,250 Active 34 DOM
-
2026-06-14days on market $86,250 Active 32 DOM
-
2026-06-12days on market $86,250 Active 31 DOM
-
2026-06-09days on market $86,250 Active 28 DOM
-
2026-06-08days on market $86,250 Active 27 DOM
-
2026-06-07days on market $86,250 Active 26 DOM
-
2026-06-03days on market $86,250 Active 22 DOM
-
2026-06-02days on market $86,250 Active 21 DOM
-
2026-06-01days on market $86,250 Active 20 DOM
-
2026-05-31days on market $86,250 Active 19 DOM
-
2026-05-30days on market $86,250 Active 18 DOM
-
2026-05-13price $86,250
-
2026-05-12$82,000 Active
ⓘ Source: listings_history table (triggers on properties + properties_extension) + one-shot
backfill from property_details.listing_events for pre-trigger history.
Climate risk First Street
- Flood 1/10 Low FEMA zone X (unshaded) · 0% chance over 30 yrs
- Wildfire 5/10 Major
- Heat 4/10 Moderate 7 d/yr ≥99°F today · 17 d/yr by 30 yrs out
- Wind 2/10 Low 100% chance of damaging wind over 30 yrs
- Air quality 1/10 Low 0 unhealthy d/yr today · 0 by 30 yrs out
Nearby sold comps map
Loading sold comps map…
Walkable amenities ~0.75 mi
Loading nearby amenities…
Taxation est. · year 1
- Rental income
- $12,637
- − Mortgage interest
- −$4,831
- − Property taxes
- −$1,294
- − Insurance
- −$431
- − Repairs & maintenance
- −$1,011
- − Management
- −$1,011
- − Depreciation
- −$2,509
- Taxable income
- $1,550
- Est. tax owed @ 24.0%
- −$372
- After-tax cash flow
- $2,459/yr
For passive investors: Depreciation is non-cash, so a rental often shows a tax loss while cash-flowing — sheltering income. Rental losses are passive: they offset passive income freely, and up to $25,000/yr can offset ordinary (W-2) income if you actively participate and your MAGI is under $100k (phasing out to $0 by $150k); unused losses carry forward. On sale, claimed depreciation is recaptured at up to 25%, and gains may owe capital-gains tax (a 1031 exchange can defer both). Figures are a year-1 estimate at your 24.0% rate — not tax advice; consult a CPA.
Condition & rehab AI · 2 photos
This mobile home is in good condition with a move-in-ready exterior. Painting the exterior and making some landscaping improvements would significantly enhance its value.
Value-add opportunities
- Both Paint the exterior — Painting the exterior can enhance the home's curb appeal and make it more attractive to potential buyers or renters.
- Both Landscaping improvements — Improving the landscaping can make the home more appealing and increase its value.
- Both Interior updates — Updating the interior can make the home more attractive and increase its value for both resale and rental purposes.
Renovation cost estimate screening
Value-add ROI direction
- Both Paint the exterior — Painting the exterior can enhance the home's curb appeal and make it more attractive to potential buyers or renters. ↑
- Both Landscaping improvements — Improving the landscaping can make the home more appealing and increase its value. ↑
- Both Interior updates — Updating the interior can make the home more attractive and increase its value for both resale and rental purposes. ↑
ⓘ Cost ranges are severity-bucket heuristics (US national rule-of-thumb). Get contractor quotes + a written scope before underwriting a rehab budget.
Schools (NCES district)
- District
- Wilkes County Schools
- NCES district ID
- 3704950
- Math proficiency
- 55% ▲ 13.00%
- Reading proficiency
- 50% ▲ 5.00%
- Median HH income
- $34,538
- Composite
- 43.41/100
- National rank
- #3017
- State rank
- #59 of 178 in NC
Livability — Millers Creek
- Score
- 69/100
- State rank
- #146
- US rank
- #8205
Category grades
Schools grade is shown separately in the Schools card above.
Census & demographics
- Census place
- Millers Creek, NC
- Population (ZIP)
- 4,629
Population outlook (Wilkes County) Hauer SSP2
- Today (2025)
- 66,349 people
- By 2030
- 64,411 · -2.9%
- By 2040
- 59,800 · -9.9%
- By 2050
- 54,770 · -17.5%
- By 2075
- 45,211 · -31.9%
- By 2100
- 36,956 · -44.3%
Race, ethnicity, and origin ACS 2023
- Neighborhood character
- Predominantly White (92%)
- Race & ethnicity
- White 92% Hispanic / Latino 5% Two or more races 2%
- Common ancestry
- Serbian 2% Slovak 2% Lithuanian 1%
- Foreign-born
- 3% · Vietnam, Canada, Jamaica
- Languages at home
- 96% English-only · Spanish 3% Vietnamese 2%
Political lean MEDSL · Wilkes
- 2024 margin
- Solid R (+59.6) · D 19.9% · R 79.5%
- 2008→2024 swing
- -21.5pp toward R · 2008: -38.2pp · 2024: -59.6pp
- All cycles
- 2024: R+59.6 2020: R+56.6 2016: R+55.2 2012: R+42.7 2008: R+38.2
Not yet ingested
- Civics
- —
Market trends
- HPI YoY
- ▲ 42.38%
- Current HPI
- 294.3413
- Rent YoY
- —
- Metro
- —
- State GDP YoY
- ▲ 3.28%
- F500 in state
- 26
Industry mix (Fortune 500 HQ in NC)
| Industry | F500 HQs | Revenue |
|---|---|---|
| Financial Services | 2 | $213B |
|
||
| Retail | 2 | $95B |
|
||
| Industrial Conglomerate | 1 | $38B |
|
||
| Metals / Steel | 1 | $35B |
|
||
| Utilities | 1 | $30B |
|
||
| Industrial Machinery | 1 | $19B |
|
||
Price history
+5.2% since first listed2 events — show timeline
- 2026-05-13 Price Changed $86,250 FSBO.com
- 2026-05-12 Listed $82,000 FSBO.com
Cash-flow waterfall
monthlySold comps — $/sqft
last 12 mo · ≤1 miLoading sold comps…