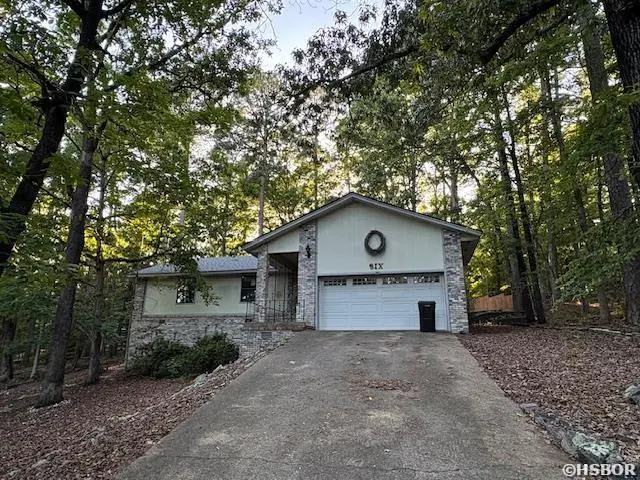
6 N Badalona Dr · Hot Springs Village, AR
Flood risk 1/10 · Minimal
- FEMA flood zone
- X (unshaded)
- Chance of flooding over 30 yrs
- 0.0%
- Est. flood insurance / yr
- $473 – $860
Fire risk 4/10 · Minor
- Est. fire insurance / yr
- $1,499 – $2,785
Heat risk 5/10 · Moderate
- Hot days now (above 111°F)
- 7 days/yr
- Hot days in 30 yrs
- 19 days/yr
Wind risk 3/10 · Minor
- Chance of severe wind over 30 yrs
- 7.0%
Air-quality risk 1/10 · Minimal
- Unhealthy air days now
- 0 days/yr
- Unhealthy air days in 30 yrs
- 0 days/yr
Risk factors via First Street. Map © Google.
Why this score? — see what drove the B- grade
The composite is a weighted blend of 9 inputs, each scored 0–100. Each bar is that input's sub-score; the figure is the points it added to the 100-point composite (weight × sub-score).
- Cash flow +30.0/30.0
- 1% rule +10.0/10.0
- DSCR +10.0/10.0
- ARV discount +7.5/15.0
- Schools +3.5/10.0
- Livability +3.5/5.0
- Rent growth +2.5/5.0
- Condition / age +2.5/5.0
- Appreciation +0.0/10.0
$77,000
🖨 Deal sheet (PDF) 📄 Offer letter ✓ Due diligence
Listing remarks
Hot Springs Village opportunity in the Cartagena subdivision! This 3-bedroom, 2-bath home offers approximately 1,661 square feet, a two-car attached garage, vaulted living area with stone fireplace, kitchen with wood cabinetry, laundry area, and a glass-enclosed porch overlooking a wooded setting. Convenient to area lakes, golf, trails, shopping, dining, and community amenities. Great opportunity to personalize a home in an established gated community.
Key facts
- Community amenities
- Vaulted living area
- Wooded setting
Tags
Property features AI
Finance
- Other: Annual taxes reported: $473
- HOA & community: Homeowners association with monthly fee of $115.79
Exterior
- Parking: 2-car garage
- Home design: Single-family residence; One-story
- Exterior features: Gated community; Community clubhouse; Community pool; Community tennis courts; Community golf
Interior
- Bathrooms: 2 full bathrooms
- Heating & cooling: Electric central heating/air
- Interior features: Breakfast bar
Neighborhood map
What this means for you Summary
Snapshot
- This is a 3-bed/2.0-bath single-family listed at $77k.
Deal economics
- At list price, monthly cash flow is $617 ($7k/yr) — positive.
- The deal already cash-flows at list — no discount required.
- Meets the 1% rule at list price ($2k rent vs $77k).
- Cap rate 15.9% vs local median 3.6% in Hot Springs Village — top-decile yield for the area; either an underpriced asset or a hidden risk that comps aren't pricing in. Stress-test before assuming the spread holds.
Location & tenants
- Location reads 69/100 on livability (#76 in AR) — a middle-class / working-renter tenant base. Strengths: crime A+, housing A+, cost of living A; Watch: schools D+, amenities F, commute F.
- Jessieville School District (rural): math 40% / reading 43% proficiency, ranked #60 of 238 in AR (top 25%) — families likely to look elsewhere, expect single-tenant / working-renter base with shorter leases; 70% free/reduced lunch — lower-income household profile, screen leases tightly.
- Market conditions: 766 active listings in the ZIP; 7 comparable units currently listed for rent nearby; rentals at typical pace (median 15d on market — plan ~3-4 weeks tenant-placement turnaround); solid renter incomes; 117 units permitted in Garland County in 2024 (24 in 5+ unit buildings).
Forward outlook
- Local home prices are declining (-3.0%/yr); year-one equity from $532 of loan paydown is wiped out by about $2k of value loss. Plan a longer hold.
- Garland County population projected at +7% by 2050 — modest demand growth; plan on rents tracking national, not racing it.
- At projected returns (-3.0% appreciation + 3.0% rent growth), your $22k cash investment doubles in ~4 years — after that, you're playing with house money.
Negotiation context
- Only 1 days on market — expect competitive offers; lowballing is unlikely to land.
Risks & watch-outs
- Climate carrying-cost: extreme-heat days projected 7→19/yr by 2055 (HVAC capex compounding) — expect insurance premiums to compound above CPI over the hold.
Questions for the listing agent
- What does the HOA fee cover, when was the last increase, and are there any pending special assessments or reserve-fund shortfalls?
- Is there a deadline driving the sale (1031 exchange, divorce, estate, relocation)? That informs how much negotiation room exists.
- Schools are D-rated, which usually means shorter tenancies and higher turnover. Who's the typical renter profile here, and what's been the actual vacancy rate?
- What's the average days-on-market for RENTAL listings here right now (not sales)? A rising rental-DOM trend means longer vacancies and softer asking-rent achievability than the comps imply.
- What's the recent tenant-quality profile in this submarket — average credit score on applications, eviction rate, late-payment / NSF rate, and stable-employment percentage? A property-management company in the area should have these aggregated.
- How much new for-sale + rental construction is in the pipeline within 1–3 miles? Heavy new supply typically softens prices + rents 12–24 months out; constrained supply supports both.
Investment metrics
- 1% rule
- 2.07% ✓
- Cap rate
- 15.91%
- Cash-on-cash
- 34.34%
- DSCR
- 2.53
- GRM
- 4.0
CMA / ARV
- ARV (on-the-fly)
- $235,862
- Comps found
- 12
Show comp detail 12 sales within ~0.75 mi
| Address | Dist | Beds/Ba | Sqft | Sold | Price | $/sf | Match |
|---|---|---|---|---|---|---|---|
| 1 Badalona Cir | 0.07mi | 3/2.5 | 1,584 (-5%) | 10mo | $160,000 | $101 | 78 |
| 31 Barcelona Ln | 0.20mi | 3/2.0 | 1,600 (-4%) | 9mo | $250,000 | $156 | 77 |
| 11 Ona Ln | 0.51mi | 3/2.0 | 1,652 (-0%) | 2mo | $225,000 | $136 | 74 |
| 17 La Canada Ln | 0.29mi | 3/2.0 | 1,524 (-8%) | 1mo | $275,000 | $180 | 72 |
| 22 Vilafranca Ln | 0.05mi | 2/2.0 (-1) | 1,497 (-10%) | 7mo | $255,000 | $170 | 70 |
| 41 Barcelona Ln | 0.32mi | 4/2.0 (+1) | 1,791 (+8%) | 2mo | $255,000 | $142 | 66 |
| 1 Bahia Ln | 0.50mi | 3/2.0 | 1,726 (+4%) | 6mo | $220,000 | $127 | 65 |
| 76 Laguna Way | 0.51mi | 3/2.0 | 1,750 (+5%) | 10mo | $225,000 | $129 | 59 |
| 75 Malaga Way | 0.62mi | 2/2.0 (-1) | 1,620 (-2%) | 5mo | $223,000 | $138 | 57 |
| 8 Larraga Way | 0.22mi | 2/2.0 (-1) | 1,460 (-12%) | 10mo | $224,500 | $154 | 56 |
| 85 Malaga Way | 0.59mi | 3/2.0 | 1,530 (-8%) | 10mo | $222,000 | $145 | 50 |
| 13 Silla Ln | 0.71mi | 2/2.0 (-1) | 1,502 (-10%) | 10mo | $172,500 | $115 | 38 |
Match score weights: distance 35% · size 25% · config 20% · recency 20%. Top-matched comps best support the ARV.
Projected returns pro-forma
-3.0% appreciation · 3.0% rent growth · sell at horizon
- IRR
- 29.8%
- Equity multiple
- 2.25×
- Total profit
- $26,904
- Equity at exit
- $11,481
- IRR
- 37.1%
- Equity multiple
- 4.45×
- Total profit
- $74,389
- Equity at exit
- $6,658
Cash invested: $21,560 (down + closing). Projections, not guarantees.
Landlord ↔ Tenant lean methodology
- Overall (STATE)
- 92 Strongly Landlord-Friendly
- State Arkansas
- 92 Strongly Landlord-Friendly · R+14
- County
- — inherits STATE
- City
- — inherits STATE
ZIP-level market 71909
- Home prices YoY
- -10.9%
- Active inventory
- 766
- Price-to-rent
- 4.0×
Monthly cashflow live
- Estimated rent
- $1,591 high interval (Pro) →
- Mortgage (P&I)
- −$404
- Tax from tax record
- −$89 /mo · $1,073/yr
- Insurance
- −$32
- HOA
- −$115
- Vacancy / Maint / Mgmt
- −$334
- Net cashflow
- $617
Break-even live
Sensitivity live
| Price | -10% $660 | -5% $639 | +0% $617 | +5% $595 | +10% $573 |
|---|---|---|---|---|---|
| Rent | -10% $491 | -5% $554 | +0% $617 | +5% $680 | +10% $743 |
| Rate | -1.0pp $656 | -0.5pp $636 | base $617 | +0.5pp $597 | +1.0pp $577 |
UW: 25.0% down · 7.5% · 30yr · 1.5% tax · 5.0% vac · 8.0% maint · 8.0% mgmt
Financing live
Cash to close
- Down payment
- $19,250
- Closing costs
- $2,310
- Reserves months
- —
- Total cash needed
- —
Loan-product check · same deal, 3 products live
Conventional
25% down · 7.5% · 30yr
- Down + closing
- —
- Monthly P&I
- —
- Monthly cashflow
- —
- DSCR
- —
- Eligible?
- —
Personal DTI + credit; lowest rate.
DSCR
20% down · 8.5% · 30yr
- Down + closing
- —
- Monthly P&I
- —
- Monthly cashflow
- —
- DSCR
- —
- Eligible?
- —
No personal income docs; deal must DSCR.
Hard money
10% down · 12.0% · 12mo
- Down + closing
- —
- Monthly P&I
- —
- Monthly cashflow
- —
- DSCR
- —
- Eligible?
- —
Short-term bridge; refi at stabilization.
Rent comps 7 comps
| Address | Beds | Baths | Sqft | Rent | $/sqft | DOM | Units | Dist |
|---|---|---|---|---|---|---|---|---|
| 16 Malaga Cir Hot Springs Village, AR | 2.0 | 2.0 | 1694 | $1,850 | $1.09 | 15d | 1 | 0.49mi |
| 2 Dulzura Ln Hot Springs Village, AR | 2.0 | 1.5 | 1120 | $1,200 | $1.07 | 45d | 1 | 0.53mi |
| 6 Tomino Way Hot Springs Village, AR | 3.0 | 1.5 | 1549 | $1,350 | $0.87 | 15d | 1 | 0.54mi |
| 16 Dulzura Ln Unit 1 Hot Springs, AR | 2.0 | 1.5 | 1120 | $1,100 | $0.98 | 15d | 1 | 0.58mi |
| 120 Emperado Way Hot Springs Village, AR | 3.0 | 1.5 | 1296 | $1,300 | $1.00 | 24d | 1 | 0.72mi |
| 10 Frontera Cir Hot Springs Village, AR | 3.0 | 2.0 | 1738 | $1,385 | $0.80 | 15d | 1 | 1.22mi |
| 29 Frontera Cir Hot Springs Village, AR | 2.0 | 2.0 | 1179 | $1,600 | $1.36 | 24d | 1 | 1.26mi |
HOA detail
- Monthly dues
- $115 · $1,380/yr
- Likely covers
- security
Listing history 3 events
-
2026-05-24$77,000 Active
-
2005-04-14soldstatus $114,000
-
1991-10-28soldstatus $65,999
ⓘ Source: listings_history table (triggers on properties + properties_extension) + one-shot
backfill from property_details.listing_events for pre-trigger history.
Tax reassessment forecast AR · Resets to sale price
- Current annual tax
- $1,073 · $89/mo
- Projected year-2 tax
- $1,073 · $89/mo
- Expected delta
- $0/yr ($0/mo · 0.0%)
ⓘ Screening estimate from a state-policy table — verify with the county assessor before closing.
Climate risk First Street
- Flood 1/10 Low FEMA zone X (unshaded) · 0% chance over 30 yrs
- Wildfire 4/10 Moderate
- Heat 5/10 Major 7 d/yr ≥111°F today · 19 d/yr by 30 yrs out
- Wind 3/10 Moderate 7% chance of damaging wind over 30 yrs
- Air quality 1/10 Low 0 unhealthy d/yr today · 0 by 30 yrs out
Nearby sold comps map
Loading sold comps map…
Walkable amenities ~0.75 mi
Loading nearby amenities…
Taxation est. · year 1
- Rental income
- $19,097
- − Mortgage interest
- −$4,313
- − Property taxes
- −$1,073
- − Insurance
- −$385
- − Repairs & maintenance
- −$1,528
- − Management
- −$1,528
- − HOA
- −$1,380
- − Depreciation
- −$2,240
- Taxable income
- $6,650
- Est. tax owed @ 24.0%
- −$1,596
- After-tax cash flow
- $5,807/yr
For passive investors: Depreciation is non-cash, so a rental often shows a tax loss while cash-flowing — sheltering income. Rental losses are passive: they offset passive income freely, and up to $25,000/yr can offset ordinary (W-2) income if you actively participate and your MAGI is under $100k (phasing out to $0 by $150k); unused losses carry forward. On sale, claimed depreciation is recaptured at up to 25%, and gains may owe capital-gains tax (a 1031 exchange can defer both). Figures are a year-1 estimate at your 24.0% rate — not tax advice; consult a CPA.
Schools (NCES district)
- District
- Jessieville School District
- NCES district ID
- 0507920
- Math proficiency
- 40% ▼ -6.00%
- Reading proficiency
- 43% ▼ -4.00%
- Median HH income
- $44,066
- Composite
- 35.16/100
- National rank
- #5003
- State rank
- #60 of 238 in AR
Livability — Hot Springs Village
- Score
- 69/100
- State rank
- #76
- US rank
- #8970
Category grades
Schools grade is shown separately in the Schools card above.
Census & demographics
- Census place
- Hot Springs Village, AR
- County
- Saline County · 77,216 people
- City population
- 18,449
- Metro
- Little Rock-North Little Rock-Conway, AR
- Population (ZIP)
- 18,449
- Household income
- $75,433
- Rent vs Own
- Severe rent burden
- 207.0
Population outlook (Garland County) Hauer SSP2
- Today (2025)
- 100,343 people
- By 2030
- 101,880 · +1.5%
- By 2040
- 104,804 · +4.4%
- By 2050
- 107,292 · +6.9%
- By 2075
- 113,182 · +12.8%
- By 2100
- 112,247 · +11.9%
Race, ethnicity, and origin ACS 2023
- Neighborhood character
- Predominantly White (93%)
- Race & ethnicity
- White 93% Two or more races 3% Hispanic / Latino 2%
- Common ancestry
- Slovak 3% Romanian 3% Serbian 2%
- Foreign-born
- 2% · Canada, Vietnam
- Languages at home
- 97% English-only · Spanish 1%
Political lean MEDSL · Garland
- 2024 margin
- Solid R (+36.2) · D 30.8% · R 67.0% · Other 2.2%
- 2008→2024 swing
- -11.3pp toward R · 2008: -25.0pp · 2024: -36.2pp
- All cycles
- 2024: R+36.2 2020: R+34.0 2016: R+34.1 2012: R+29.9 2008: R+25.0
Not yet ingested
- Civics
- —
Market trends
- HPI YoY
- ▼ -24.00%
- Current HPI
- 195.9499
- Rent YoY
- —
- Metro
- Little Rock-North Little Rock-Conway, AR
- State GDP YoY
- ▲ 3.80%
- F500 in state
- 10
Industry mix (Fortune 500 HQ in AR)
| Industry | F500 HQs | Revenue |
|---|---|---|
| Retail | 1 | $681B |
|
||
| Food / Agriculture | 1 | $53B |
|
||
| Retail / Energy | 1 | $22B |
|
||
| Transportation / Logistics | 1 | $12B |
|
||
| Energy | 1 | $4B |
|
||
Price history
+16.7% since first listed3 events — show timeline
- 2026-05-24 Listed $77,000 HSBOR
- 2005-04-14 Sold (Public Records) $114,000 Public Records
- 1991-10-28 Sold (Public Records) $65,999 Public Records
Property tax history
+1.1%/yrLatest (2025): $1,073 · +2.9% YoY. Source: county tax records.
Cash-flow waterfall
monthlySold comps — $/sqft
last 12 mo · ≤1 miLoading sold comps…