1321 Highway 44 · Monticello, MS
Flood risk 1/10 · Minimal
- FEMA flood zone
- X (unshaded)
- Chance of flooding over 30 yrs
- 0.0%
- Est. flood insurance / yr
- $507 – $1,088
Fire risk 7/10 · Major
- Est. fire insurance / yr
- $1,241 – $2,305
Heat risk 8/10 · Major
- Hot days now (above 108°F)
- 7 days/yr
- Hot days in 30 yrs
- 20 days/yr
Wind risk 8/10 · Major
- Chance of severe wind over 30 yrs
- 99.0%
Air-quality risk 1/10 · Minimal
- Unhealthy air days now
- 0 days/yr
- Unhealthy air days in 30 yrs
- 0 days/yr
Risk factors via First Street. Map © Google.
Why this score? — see what drove the C grade
The composite is a weighted blend of 9 inputs, each scored 0–100. Each bar is that input's sub-score; the figure is the points it added to the 100-point composite (weight × sub-score).
- Cash flow +22.5/30.0
- ARV discount +7.5/15.0
- DSCR +7.2/10.0
- Appreciation +7.0/10.0
- 1% rule +4.8/10.0
- Livability +3.6/5.0
- Rent growth +2.5/5.0
- Condition / age +2.2/5.0
- Schools +1.9/10.0
$120,000
🖨 Deal sheet 📄 Offer letter ✓ Due diligence
Listing remarks MLS
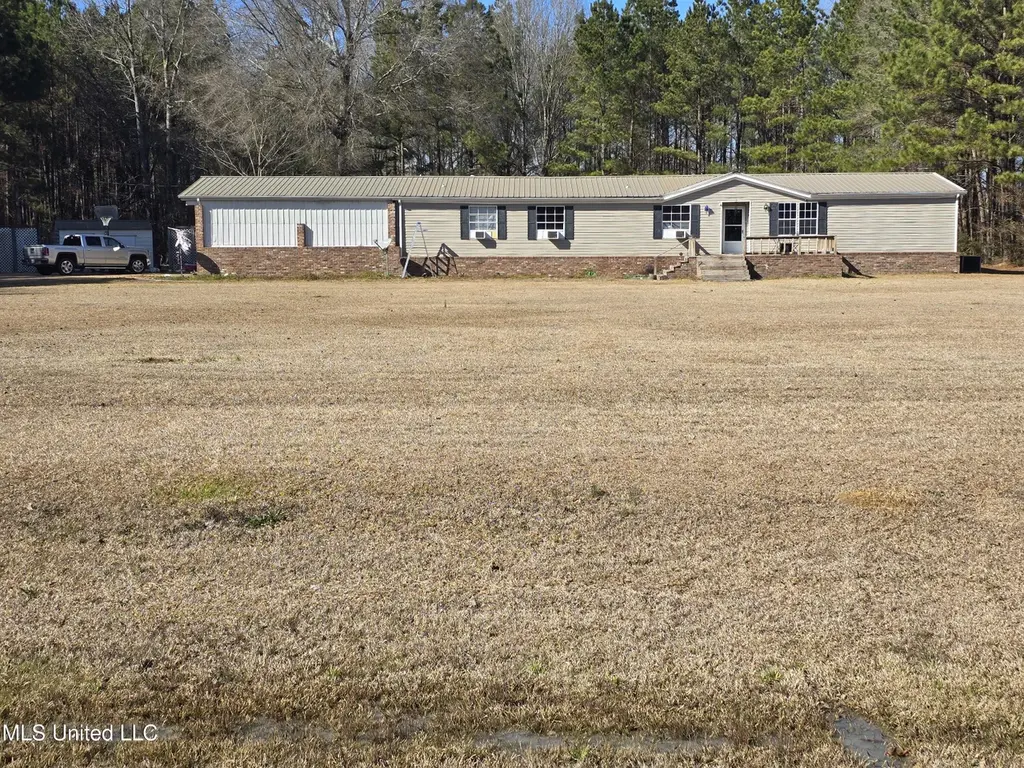
Property features three bedrooms and three full bathrooms with two living spaces, a dedicated office, laundry room, kitchen, and dining area. Situated on approximately 2.4 acres with an in-ground pool.
Key facts
- In-ground pool
- Two living spaces
- Laundry room
Tags
Neighborhood map
What this means for you Summary
Snapshot
- This is a 3-bed/3.0-bath manufactured listed at $120k. Condition is rated fair.
Deal economics
- At list price, monthly cash flow is $202 ($2k/yr) — positive.
- The deal already cash-flows at list — no discount required.
- To meet the 1% rule (rent ≥ 1% of price), the offer needs to be $118k (2.1% below list).
- Recommended offer: $106k (12.0% below list) — sets the bar for market timing.
Location & tenants
- Location reads 72/100 on livability (#24 in MS) — a middle-class / working-renter tenant base. Strengths: crime A+, cost of living A+, health & safety A+; Watch: schools D, amenities F, commute F.
- Lawrence County School District (rural): math 20% / reading 26% proficiency, ranked #85 of 130 in MS (top 65%) — low school quality limits family demand, transient renter base, plan for 1-2y turnover; 67% free/reduced lunch — lower-income household profile, screen leases tightly.
- Market conditions: 25 active listings in the ZIP.
Forward outlook
- In year one you build about $6k of equity ($830 loan paydown + $5k appreciation (4.0% local appreciation)).
- Lawrence County population projected at -16% by 2050 — secular population decline; favor cash flow + early exit over multi-decade hold.
- At projected returns (4.0% appreciation + 3.0% rent growth), your $34k cash investment doubles in ~4 years — after that, you're playing with house money.
- By year 7, paydown + projected appreciation supports a ~$36k cash-out refi (75% LTV) — recoverable capital for the next deal without selling this one.
Negotiation context
- It's been on market 123 days — a 12% lower offer ($106k) is reasonable based on typical stale-listing flexibility.
- 2 sale attempts since 2y ago; this cycle's ask has dropped $30k (20%) from the opening price — seller is motivated, your offer sets the floor, not the list.
Risks & watch-outs
- Climate carrying-cost: severe wind risk, 99% chance of damaging wind over 30y; major wildfire risk; extreme-heat days projected 7→20/yr by 2055 (HVAC capex compounding) — expect insurance premiums to compound above CPI over the hold.
Questions for the listing agent
- It's been on market 123 days. Have you received any prior offers? Is the seller open to a 12% concession, seller financing, or rate buy-down credit?
- Have any recent inspections been done? Can we get a copy of the seller's disclosures and any deferred-maintenance estimates?
- Why hasn't it sold? Are there any deal-killer items the seller is aware of (foundation, flood, title, zoning, code violations)?
- Is there a deadline driving the sale (1031 exchange, divorce, estate, relocation)? That informs how much negotiation room exists.
- Schools are D-rated, which usually means shorter tenancies and higher turnover. Who's the typical renter profile here, and what's been the actual vacancy rate?
- What's the average days-on-market for RENTAL listings here right now (not sales)? A rising rental-DOM trend means longer vacancies and softer asking-rent achievability than the comps imply.
- What's the recent tenant-quality profile in this submarket — average credit score on applications, eviction rate, late-payment / NSF rate, and stable-employment percentage? A property-management company in the area should have these aggregated.
- How much new for-sale + rental construction is in the pipeline within 1–3 miles? Heavy new supply typically softens prices + rents 12–24 months out; constrained supply supports both.
Investment metrics
- 1% rule
- 0.98% ✗
- Cap rate
- 8.31%
- Cash-on-cash
- 7.20%
- DSCR
- 1.32
- GRM
- 8.5
CMA / ARV
No comps found within radius.
Projected returns pro-forma
4.01% appreciation · 3.0% rent growth · sell at horizon
- IRR
- 16.7%
- Equity multiple
- 2.01×
- Total profit
- $33,802
- Equity at exit
- $60,918
- IRR
- 17.5%
- Equity multiple
- 3.81×
- Total profit
- $94,538
- Equity at exit
- $99,698
Cash invested: $33,600 (down + closing). Projections, not guarantees.
Landlord ↔ Tenant lean methodology
- Overall (STATE)
- 90 Strongly Landlord-Friendly
- State Mississippi
- 90 Strongly Landlord-Friendly · R+11
- County
- — inherits STATE
- City
- — inherits STATE
ZIP-level market 39641
- Home prices YoY
- 2.9%
- Active inventory
- 25
- Price-to-rent
- 8.5×
Monthly cashflow live
- Estimated rent
- $1,175 medium interval (Pro) →
- Mortgage (P&I)
- −$629
- Tax from tax record
- −$47 /mo · $569/yr
- Insurance
- −$50
- HOA
- −$0
- Vacancy / Maint / Mgmt
- −$247
- Net cashflow
- $202
Break-even live
UW: 25.0% down · 7.5% · 30yr · 1.5% tax · 5.0% vac · 8.0% maint · 8.0% mgmt
Financing live
Cash to close
- Down payment
- $30,000
- Closing costs
- $3,600
- Reserves months
- —
- Total cash needed
- —
Loan-product check · same deal, 3 products live
Conventional
25% down · 7.5% · 30yr
- Down + closing
- —
- Monthly P&I
- —
- Monthly cashflow
- —
- DSCR
- —
- Eligible?
- —
Personal DTI + credit; lowest rate.
DSCR
20% down · 8.5% · 30yr
- Down + closing
- —
- Monthly P&I
- —
- Monthly cashflow
- —
- DSCR
- —
- Eligible?
- —
No personal income docs; deal must DSCR.
Hard money
10% down · 12.0% · 12mo
- Down + closing
- —
- Monthly P&I
- —
- Monthly cashflow
- —
- DSCR
- —
- Eligible?
- —
Short-term bridge; refi at stabilization.
Listing history 12 events
-
2026-06-08days on market $120,000 Active 123 DOM
-
2026-06-07days on market $120,000 Active 122 DOM
-
2026-06-07days on market $120,000 Active 121 DOM
-
2026-06-04days on market $120,000 Active 118 DOM
-
2026-06-02days on market $120,000 Active 117 DOM
-
2026-06-01days on market $120,000 Active 116 DOM
-
2026-05-31days on market $120,000 Active 115 DOM
-
2026-05-07price $120,000 201-char remark
Show marketing remark (201 chars)
Property features three bedrooms and three full bathrooms with two living spaces, a dedicated office, laundry room, kitchen, and dining area. Situated on approximately 2.4 acres with an in-ground pool.
-
2026-03-25price $129,999 201-char remark
Show marketing remark (201 chars)
Property features three bedrooms and three full bathrooms with two living spaces, a dedicated office, laundry room, kitchen, and dining area. Situated on approximately 2.4 acres with an in-ground pool.
-
2026-03-04price $139,900 201-char remark
Show marketing remark (201 chars)
Property features three bedrooms and three full bathrooms with two living spaces, a dedicated office, laundry room, kitchen, and dining area. Situated on approximately 2.4 acres with an in-ground pool.
-
2026-02-05$149,500 Active 201-char remark
Show marketing remark (201 chars)
Property features three bedrooms and three full bathrooms with two living spaces, a dedicated office, laundry room, kitchen, and dining area. Situated on approximately 2.4 acres with an in-ground pool.
-
2024-04-22$160,000 Active
ⓘ Source: listings_history table (triggers on properties + properties_extension) + one-shot
backfill from property_details.listing_events for pre-trigger history.
Tax reassessment forecast MS · Resets to sale price
- Current annual tax
- $569 · $47/mo
- Projected year-2 tax
- $948 · $79/mo
- Expected delta
- +$379/yr (+$32/mo · 66.7%)
ⓘ Screening estimate from a state-policy table — verify with the county assessor before closing.
Climate risk First Street
- Flood 1/10 Low FEMA zone X (unshaded) · 0% chance over 30 yrs
- Wildfire 7/10 Severe
- Heat 8/10 Severe 7 d/yr ≥108°F today · 20 d/yr by 30 yrs out
- Wind 8/10 Severe 99% chance of damaging wind over 30 yrs
- Air quality 1/10 Low 0 unhealthy d/yr today · 0 by 30 yrs out
Nearby sold comps map
Loading sold comps map…
Walkable amenities ~0.75 mi
Loading nearby amenities…
Taxation est. · year 1
- Rental income
- $14,103
- − Mortgage interest
- −$6,722
- − Property taxes
- −$569
- − Insurance
- −$600
- − Repairs & maintenance
- −$1,128
- − Management
- −$1,128
- − Depreciation
- −$3,491
- Taxable income
- $464
- Est. tax owed @ 24.0%
- −$111
- After-tax cash flow
- $2,309/yr
For passive investors: Depreciation is non-cash, so a rental often shows a tax loss while cash-flowing — sheltering income. Rental losses are passive: they offset passive income freely, and up to $25,000/yr can offset ordinary (W-2) income if you actively participate and your MAGI is under $100k (phasing out to $0 by $150k); unused losses carry forward. On sale, claimed depreciation is recaptured at up to 25%, and gains may owe capital-gains tax (a 1031 exchange can defer both). Figures are a year-1 estimate at your 24.0% rate — not tax advice; consult a CPA.
Condition & rehab AI · 10 photos
The property requires moderate renovations to improve its curb appeal and interior aesthetics, which would increase its resale and rental value.
Repairs flagged
- Moderate Kitchen cabinets — Worn and dated
- Moderate Bathroom fixtures — Worn and dated
- Minor Landscaping — Fenced yard, shed
Value-add opportunities
- Both Paint interior walls — Enhances curb appeal and interior aesthetics
- Both Replace carpet in living areas — Improves comfort and appearance
- Both Replace dated kitchen cabinets and bathroom fixtures — Enhances functionality and aesthetics
Renovation cost estimate screening
| Repair item | Severity | Est. cost |
|---|---|---|
| Kitchen cabinets · Worn and dated | Moderate | $3,000–15,000 |
| Bathroom fixtures · Worn and dated | Moderate | $3,000–15,000 |
| Landscaping · Fenced yard, shed | Minor | $500–3,000 |
| Total estimated repair cost · 3 items | $6,500–33,000 |
Value-add ROI direction
- Both Paint interior walls — Enhances curb appeal and interior aesthetics ↑
- Both Replace carpet in living areas — Improves comfort and appearance ↑
- Both Replace dated kitchen cabinets and bathroom fixtures — Enhances functionality and aesthetics ↑
ⓘ Cost ranges are severity-bucket heuristics (US national rule-of-thumb). Get contractor quotes + a written scope before underwriting a rehab budget.
Schools (NCES district)
- District
- Lawrence County School District
- NCES district ID
- 2802490
- Math proficiency
- 20% ▼ -16.00%
- Reading proficiency
- 26% ▼ -7.00%
- Median HH income
- $37,725
- Composite
- 19.21/100
- National rank
- #8812
- State rank
- #85 of 130 in MS
Livability — Monticello
- Score
- 72/100
- State rank
- #24
- US rank
- #6306
Category grades
Schools grade is shown separately in the Schools card above.
Census & demographics
- Population (ZIP)
- 6,821
Population outlook (Lawrence County) Hauer SSP2
- Today (2025)
- 12,069 people
- By 2030
- 11,724 · -2.9%
- By 2040
- 10,955 · -9.2%
- By 2050
- 10,085 · -16.4%
- By 2075
- 7,870 · -34.8%
- By 2100
- 5,614 · -53.5%
Race, ethnicity, and origin ACS 2023
- Neighborhood character
- Predominantly White (68%)
- Race & ethnicity
- White 68% Black 28% Two or more races 3% Hispanic / Latino 1%
- Common ancestry
- Iranian 3% Lithuanian 2% Slovak 1%
- Foreign-born
- 1% · Canada
- Languages at home
- 99% English-only · Spanish 1%
Political lean MEDSL · Lawrence
- 2024 margin
- Solid R (+36.6) · D 31.4% · R 68.0%
- 2008→2024 swing
- -11.2pp toward R · 2008: -25.4pp · 2024: -36.6pp
- All cycles
- 2024: R+36.6 2020: R+30.6 2016: R+29.9 2012: R+26.7 2008: R+25.4
Not yet ingested
- Civics
- —
Market trends
- HPI YoY
- ▲ 4.01%
- Current HPI
- 142.2867
- Rent YoY
- —
- Metro
- —
- State GDP YoY
- —
- F500 in state
- 0
Price history
-25.0% since first listed5 events — show timeline
- 2026-05-07 Price Changed $120,000 MLSU
- 2026-03-25 Price Changed $129,999 MLSU
- 2026-03-04 Price Changed $139,900 MLSU
- 2026-02-05 Listed $149,500 MLSU
- 2024-04-22 Listed $160,000 HAAR
Property tax history
-19.1%/yrLatest (2025): $569 · +7.7% YoY. Source: county tax records.
Cash-flow waterfall
monthlySold comps — $/sqft
last 12 mo · ≤1 miLoading sold comps…