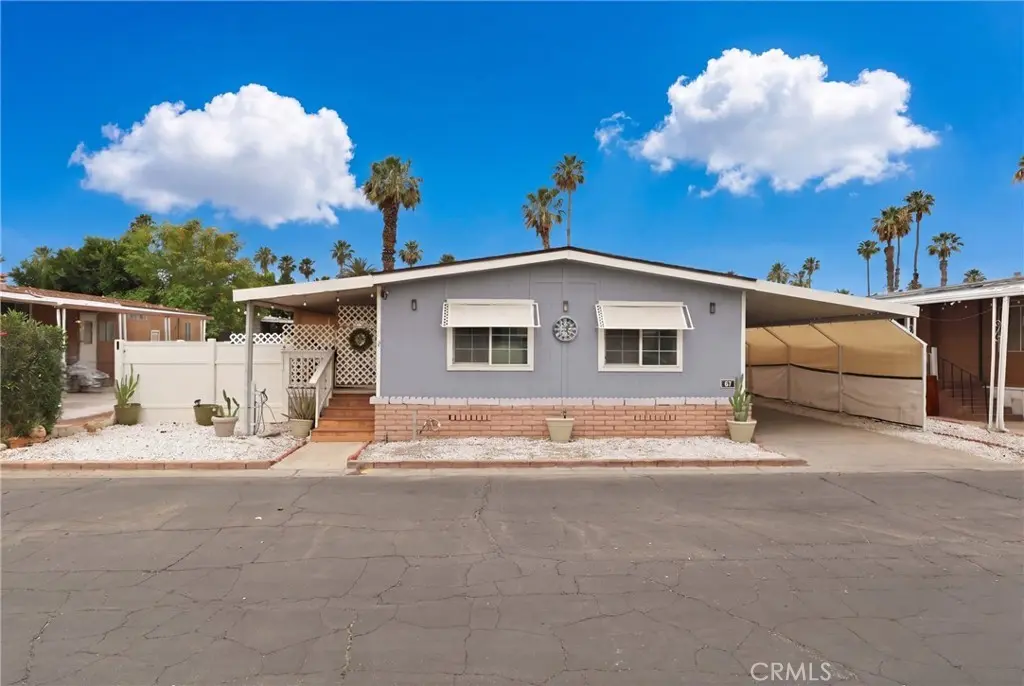
80000 Avenue 48 #67 · Indio, CA
Flood risk 1/10 · Minimal
- FEMA flood zone
- X (shaded)
- Chance of flooding over 30 yrs
- 0.0%
- Est. flood insurance / yr
- $507 – $1,088
Fire risk 3/10 · Minor
- Est. fire insurance / yr
- $659 – $1,223
Heat risk 10/10 · Severe
- Hot days now (above 114°F)
- 7 days/yr
- Hot days in 30 yrs
- 18 days/yr
Wind risk 1/10 · Minimal
- Chance of severe wind over 30 yrs
- —
Air-quality risk 4/10 · Minor
- Unhealthy air days now
- 4 days/yr
- Unhealthy air days in 30 yrs
- 5 days/yr
Risk factors via First Street. Map © Google.
Why this score? — see what drove the B- grade
The composite is a weighted blend of 9 inputs, each scored 0–100. Each bar is that input's sub-score; the figure is the points it added to the 100-point composite (weight × sub-score).
- Cash flow +30.0/30.0
- DSCR +10.0/10.0
- 1% rule +9.8/10.0
- ARV discount +7.5/15.0
- Schools +3.8/10.0
- Rent growth +3.3/5.0
- Livability +2.7/5.0
- Condition / age +2.5/5.0
- Appreciation +0.0/10.0
$180,000
🖨 Deal sheet (PDF) 📄 Offer letter ✓ Due diligence
Listing remarks
Welcome home to this inviting residence located in the Las Palmas de la Quinta Mobile Home Park. With 1,152 sq ft of well-designed living space, this home features 3 bedrooms and 2 bathrooms with a comfortable and well-designed layout ideal for everyday living. Step onto the front porch and enter into a brightly lit living room that flows seamlessly into the dining area and kitchen, creating an open and welcoming space. Just off the kitchen, you’ll find a separate laundry room for added convenience. Down the hallway, there are two secondary bedrooms that share a full bathroom, while the primary bedroom is situated for privacy and includes its own full bathroom. Conveniently located ne
Key facts
- Front porch
- Garage
- Community pool
Tags
Property features AI
Finance
- Other: Lot categorized as 0-1 Unit/Acre; Elevation reported in feet
- Financial info: Land lease of $1,300 monthly (seller reported)
- HOA & community: Community features include curbs, street lighting, sidewalks, park, and suburban setting; Located in park: Las Palmas de la Quinta
Exterior
- Parking: Carport; One parking space (one garage space equivalent)
- Utilities: Public sewer; Natural gas connected; Electricity connected; Water connected
- Home design: Single-story mobile/manufactured home; Model: SEACLIFF; Mobile home remains; Facing/has a view
- Construction: Shingle roof (common roof); Total of 1 story; Mobile width 12 ft, length 48 ft; Year built per public records
- Exterior features: Covered front porch; Community pool; Wood fencing
Interior
- Kitchen: Gas range; Gas oven
- Bedrooms: Primary bedroom on main level
- Bathrooms: Two full bathrooms; Walk-in shower
- Heating & cooling: Central furnace heating; Central cooling
- Interior features: One-level home with ground-level entry; Entry located at ground level; Primary bedroom; All bedrooms on main level; Living room
- Laundry & utility: Inside laundry in a dedicated room
Neighborhood map
What this means for you Summary
Snapshot
- This is a 3-bed/2.0-bath manufactured listed at $180k.
Deal economics
- At list price, monthly cash flow is $1k ($12k/yr) — positive.
- The deal already cash-flows at list — no discount required.
- Meets the 1% rule at list price ($3k rent vs $180k).
- Recommended offer: $175k (3.0% below list) — sets the bar for market timing.
- Cap rate 13.1% vs local median 4.3% in Indio — top-decile yield for the area; either an underpriced asset or a hidden risk that comps aren't pricing in. Stress-test before assuming the spread holds.
Location & tenants
- Location reads 53/100 on livability (#927 in CA) — a working-class tenant base; expect higher turnover. Strengths: housing B+; Watch: employment D, crime F, amenities F.
- Desert Sands Unified (suburban): math 31% / reading 56% proficiency, ranked #199 of 517 in CA (top 38%) — families likely to look elsewhere, expect single-tenant / working-renter base with shorter leases.
- Zoned schools: Harry S. Truman Elementary (666 students, 80% FRL); La Quinta Middle (math 24% / reading 24%, grade F, #277 of 498 statewide, top 73%, 754 students, 83% FRL); Indio High (math 15% / reading 42%, grade F, #774 of 1,170 statewide, top 66%, 2,143 students, 92% FRL) — zoned schools average 85% FRL vs 56% district-wide (29 pts higher); higher-poverty schools than district average — tighter screening recommended.
- Zoned-school proficiency averages 26% at this address vs 44% district-wide (-17 pts) — the specific schools serving this property underperform the Desert Sands Unified average; the district grade overstates school quality for this exact location.
- Market conditions: Rents rising (+3.3%/yr); 515 active listings in the ZIP; 11 comparable units currently listed for rent nearby; rentals at typical pace (median 26d on market — plan ~3-4 weeks tenant-placement turnaround); 45% of comp listings sitting > 30 days — soft ceiling on asking rent; 9,195 units permitted in Riverside County in 2024 (1,512 in 5+ unit buildings).
- At $2,664/mo this rent would consume 48% of the median local household income ($67k/yr) (locally 2036% of renters already pay >50% of income on rent) — very limited rent-growth headroom before tenants either downsize or default.
Forward outlook
- Local home prices are declining (-3.0%/yr); year-one equity from $1k of loan paydown is wiped out by about $5k of value loss. Plan a longer hold.
- Riverside County population projected at +22% by 2050 — long-run rental-demand tailwind backs the buy-and-hold thesis.
- At projected returns (-3.0% appreciation + 3.3% rent growth), your $50k cash investment doubles in ~5 years — after that, you're playing with house money.
Negotiation context
- It's been on market 47 days — a 3% lower offer ($175k) is reasonable based on typical stale-listing flexibility.
- 3 sale attempts since 2y ago with the ask held roughly flat each time — persistent listings suggest the price (not the market) is what's stuck; bring a comps-based counter.
Risks & watch-outs
- Climate carrying-cost: extreme-heat days projected 7→18/yr by 2055 (HVAC capex compounding) — expect insurance premiums to compound above CPI over the hold.
Questions for the listing agent
- It's been on market 47 days. Have you received any prior offers? Is the seller open to a 3% concession, seller financing, or rate buy-down credit?
- Is there a deadline driving the sale (1031 exchange, divorce, estate, relocation)? That informs how much negotiation room exists.
- Schools are F-rated, which usually means shorter tenancies and higher turnover. Who's the typical renter profile here, and what's been the actual vacancy rate?
- Crime grade is F in this area — have there been break-ins, vandalism, or insurance claims at this property in the last 3 years? What carrier currently insures it and at what premium?
- What's the average days-on-market for RENTAL listings here right now (not sales)? A rising rental-DOM trend means longer vacancies and softer asking-rent achievability than the comps imply.
- What's the recent tenant-quality profile in this submarket — average credit score on applications, eviction rate, late-payment / NSF rate, and stable-employment percentage? A property-management company in the area should have these aggregated.
- How much new for-sale + rental construction is in the pipeline within 1–3 miles? Heavy new supply typically softens prices + rents 12–24 months out; constrained supply supports both.
Investment metrics
- 1% rule
- 1.48% ✓
- Cap rate
- 13.13%
- Cash-on-cash
- 24.41%
- DSCR
- 2.09
- GRM
- 5.6
CMA / ARV
- ARV (median comp)
- $78,365
- List price
- $180,000
- Delta
- 129.69%
- Verdict
- OVERPRICED
- Comps
- 6 within 1.0 mi
Show comp detail 2 sales within ~0.75 mi
| Address | Dist | Beds/Ba | Sqft | Sold | Price | $/sf | Match |
|---|---|---|---|---|---|---|---|
| 80000 Avenue 48 #58 | 0.00mi | 3/2.0 | 1,232 (+7%) | 4mo | $160,000 | $130 | 85 |
| 80000 Avenue 48 Space 285 | 0.00mi | 3/2.0 | 1,300 (+13%) | 16mo | $177,000 | $136 | 65 |
Match score weights: distance 35% · size 25% · config 20% · recency 20%. Top-matched comps best support the ARV.
Projected returns pro-forma
-3.0% appreciation · 3.34% rent growth · sell at horizon
- IRR
- 18.1%
- Equity multiple
- 1.73×
- Total profit
- $36,992
- Equity at exit
- $26,839
- IRR
- 26.7%
- Equity multiple
- 3.38×
- Total profit
- $119,835
- Equity at exit
- $15,563
Cash invested: $50,400 (down + closing). Projections, not guarantees.
Landlord ↔ Tenant lean methodology
- Overall (STATE)
- 18 Strongly Tenant-Friendly
- State California
- 18 Strongly Tenant-Friendly · D+13
- County
- — inherits STATE
- City
- — inherits STATE
ZIP-level market 92201
- Home prices YoY
- -28.4%
- Rents YoY
- 3.3%
- Active inventory
- 515
- Price-to-rent
- 5.6×
Monthly cashflow live
- Estimated rent
- $2,664 high interval (Pro) →
- Mortgage (P&I)
- −$944
- Tax from tax record
- −$61 /mo · $727/yr
- Insurance
- −$75
- HOA
- −$0
- Vacancy / Maint / Mgmt
- −$560
- Net cashflow
- $1,025
Break-even live
Sensitivity live
| Price | -10% $1,127 | -5% $1,076 | +0% $1,025 | +5% $974 | +10% $923 |
|---|---|---|---|---|---|
| Rent | -10% $815 | -5% $920 | +0% $1,025 | +5% $1,131 | +10% $1,236 |
| Rate | -1.0pp $1,116 | -0.5pp $1,071 | base $1,025 | +0.5pp $979 | +1.0pp $931 |
UW: 25.0% down · 7.5% · 30yr · 1.5% tax · 5.0% vac · 8.0% maint · 8.0% mgmt
Financing live
Cash to close
- Down payment
- $45,000
- Closing costs
- $5,400
- Reserves months
- —
- Total cash needed
- —
Loan-product check · same deal, 3 products live
Conventional
25% down · 7.5% · 30yr
- Down + closing
- —
- Monthly P&I
- —
- Monthly cashflow
- —
- DSCR
- —
- Eligible?
- —
Personal DTI + credit; lowest rate.
DSCR
20% down · 8.5% · 30yr
- Down + closing
- —
- Monthly P&I
- —
- Monthly cashflow
- —
- DSCR
- —
- Eligible?
- —
No personal income docs; deal must DSCR.
Hard money
10% down · 12.0% · 12mo
- Down + closing
- —
- Monthly P&I
- —
- Monthly cashflow
- —
- DSCR
- —
- Eligible?
- —
Short-term bridge; refi at stabilization.
Rent comps 11 comps
| Address | Beds | Baths | Sqft | Rent | $/sqft | DOM | Units | Dist |
|---|---|---|---|---|---|---|---|---|
| 46896 Jefferson St Indio, CA | 2.0 | 2.0 | 1100 | $2,075 | $1.89 | 1d | 3 | 0.48mi |
| 47800 Madison St Indio, CA | 3.0 | 2.0 | 1456 | $2,850 | $1.96 | 45d | 1 | 0.86mi |
| 80870 California 111 Unit 223 Indio, CA | 2.0 | 2.0 | 1400 | $1,550 | $1.11 | 45d | 1 | 0.87mi |
| 47750 Adams St La Quinta, CA | 1.0–2.0 | 1.0–2.0 | 956 | $2,220 | $2.32 | 45d | 1 | 1.05mi |
| 80675 Harvard Ct Indio, CA | 3.0 | 2.0 | 1248 | $2,495 | $2.00 | 12d | 1 | 1.16mi |
| 80886 Avenue 50 Unit 2 Indio, CA | 2.0 | 1.0 | 729 | $4,000 | $5.49 | 16d | 1 | 1.19mi |
| 80886 Avenue 50 Unit 1 Indio, CA | 2.0 | 2.0 | 1392 | $5,000 | $3.59 | 16d | 1 | 1.19mi |
| 45930 Las Colinas La Quinta, CA | 3.0 | 2.0 | 1500 | $2,850 | $1.90 | 26d | 1 | 1.24mi |
| 81641 Avenue 48 Indio, CA | 2.0 | 2.0 | 1440 | $2,500 | $1.74 | 45d | 1 | 1.40mi |
| 80208 Royal Birkdale Dr Indio, CA | 2.0 | 2.0 | 1382 | $3,875 | $2.80 | 26d | 1 | 1.45mi |
| 46675 Desert Villa St Indio, CA | 2.0 | 1.0–1.5 | 881 | $1,590 | $1.80 | 45d | 1 | 1.48mi |
Listing history 19 events
-
2026-06-21days on market $180,000 Active 47 DOM
-
2026-06-18days on market $180,000 Active 44 DOM
-
2026-06-17days on market $180,000 Active 43 DOM
-
2026-06-16days on market $180,000 Active 42 DOM
-
2026-06-15days on market $180,000 Active 41 DOM
-
2026-06-13days on market $180,000 Active 39 DOM
-
2026-06-09days on market $180,000 Active 35 DOM
-
2026-06-08days on market $180,000 Active 34 DOM
-
2026-06-07days on market $180,000 Active 33 DOM
-
2026-06-04days on market $180,000 Active 30 DOM
-
2026-06-03days on market $180,000 Active 29 DOM
-
2026-06-02days on market $180,000 Active 28 DOM
-
2026-06-01days on market $180,000 Active 27 DOM
-
2026-05-31days on market $180,000 Active 26 DOM
-
2026-05-05$180,000 Active 912-char remark
-
2026-04-16historical
-
2026-04-07$199,900 Active
-
2024-10-22$184,900 Active
-
2024-10-08historical
ⓘ Source: listings_history table (triggers on properties + properties_extension) + one-shot
backfill from property_details.listing_events for pre-trigger history.
Tax reassessment forecast CA · Resets to sale price
- Current annual tax
- $727 · $61/mo
- Projected year-2 tax
- $1,368 · $114/mo
- Expected delta
- +$641/yr (+$53/mo · 88.3%)
ⓘ Screening estimate from a state-policy table — verify with the county assessor before closing.
Climate risk First Street
- Flood 1/10 Low FEMA zone X (shaded) · 0% chance over 30 yrs
- Wildfire 3/10 Moderate
- Heat 10/10 Extreme 7 d/yr ≥114°F today · 18 d/yr by 30 yrs out
- Wind 1/10 Low
- Air quality 4/10 Moderate 4 unhealthy d/yr today · 5 by 30 yrs out
Nearby sold comps map
Loading sold comps map…
Walkable amenities ~0.75 mi
Loading nearby amenities…
Taxation est. · year 1
- Rental income
- $31,972
- − Mortgage interest
- −$10,083
- − Property taxes
- −$727
- − Insurance
- −$900
- − Repairs & maintenance
- −$2,558
- − Management
- −$2,558
- − Depreciation
- −$5,236
- Taxable income
- $9,911
- Est. tax owed @ 24.0%
- −$2,379
- After-tax cash flow
- $9,926/yr
For passive investors: Depreciation is non-cash, so a rental often shows a tax loss while cash-flowing — sheltering income. Rental losses are passive: they offset passive income freely, and up to $25,000/yr can offset ordinary (W-2) income if you actively participate and your MAGI is under $100k (phasing out to $0 by $150k); unused losses carry forward. On sale, claimed depreciation is recaptured at up to 25%, and gains may owe capital-gains tax (a 1031 exchange can defer both). Figures are a year-1 estimate at your 24.0% rate — not tax advice; consult a CPA.
Schools (NCES district)
- District
- Desert Sands Unified
- NCES district ID
- 0611110
- Math proficiency
- 31% ▼ -4.00%
- Reading proficiency
- 56% ▲ 7.00%
- Median HH income
- $54,957
- Composite
- 37.77/100
- National rank
- #4346
- State rank
- #199 of 517 in CA
Livability — Indio
- Score
- 53/100
- State rank
- #927
- US rank
- #24244
Category grades
Schools grade is shown separately in the Schools card above.
Census & demographics
- Census place
- Indio, CA
- County
- Riverside County · 2,287,001 people
- City population
- 100,560
- Metro
- Riverside-San Bernardino-Ontario, CA
- Population (ZIP)
- 65,825
- Household income
- $66,758
- Rent vs Own
- Severe rent burden
- 2036.0
Population outlook (Riverside County) Hauer SSP2
- Today (2025)
- 2,664,475 people
- By 2030
- 2,802,692 · +5.2%
- By 2040
- 3,050,904 · +14.5%
- By 2050
- 3,256,783 · +22.2%
- By 2075
- 3,655,058 · +37.2%
- By 2100
- 3,766,594 · +41.4%
Race, ethnicity, and origin ACS 2023
- Neighborhood character
- Predominantly Hispanic (74%)
- Race & ethnicity
- Hispanic / Latino 74% Two or more races 39% White 19% Black 3% Asian 3% Native American 1%
- Hispanic origin (detail)
- Mexican 69%
- Common ancestry
- Romanian 1% Iranian 1%
- Foreign-born
- 29% · Canada, Vietnam, Jamaica
- Languages at home
- 41% English-only · Spanish 55% Arabic 1% Tagalog/Filipino 1%
Political lean MEDSL · Riverside
- 2024 margin
- Toss-up / Even · D 48.0% · R 49.3% · Other 2.6%
- 2008→2024 swing
- -3.6pp toward R · 2008: 2.3pp · 2024: -1.3pp
- All cycles
- 2024: R+1.3 2020: D+8.0 2016: D+4.3 2012: R+0.4 2008: D+2.3
Not yet ingested
- Civics
- —
Market trends
- HPI YoY
- ▼ -138.46%
- Current HPI
- 348.6605
- Rent YoY
- ▲ 3.34%
- Metro
- Riverside-San Bernardino-Ontario, CA
- State GDP YoY
- ▲ 3.21%
- F500 in state
- 116
Industry mix (Fortune 500 HQ in CA)
| Industry | F500 HQs | Revenue |
|---|---|---|
| Technology | 27 | $1,492B |
|
||
| Financial Services | 3 | $174B |
|
||
| Retail | 3 | $44B |
|
||
| Insurance | 3 | $26B |
|
||
| Media / Entertainment | 2 | $115B |
|
||
| Pharmaceuticals / Biotech | 2 | $62B |
|
||
Price history
-2.7% since first listed5 events — show timeline
- 2026-05-05 Listed $180,000 CRMLS
- 2026-04-16 Listing Removed — CRMLS
- 2026-04-07 Listed $199,900 CRMLS
- 2024-10-22 Listed $184,900 GPSMLS
- 2024-10-08 Coming Soon — GPSMLS
Property tax history
+1.6%/yrLatest (2025): $727 · +5.4% YoY. Source: county tax records.
Cash-flow waterfall
monthlySold comps — $/sqft
last 12 mo · ≤1 miLoading sold comps…