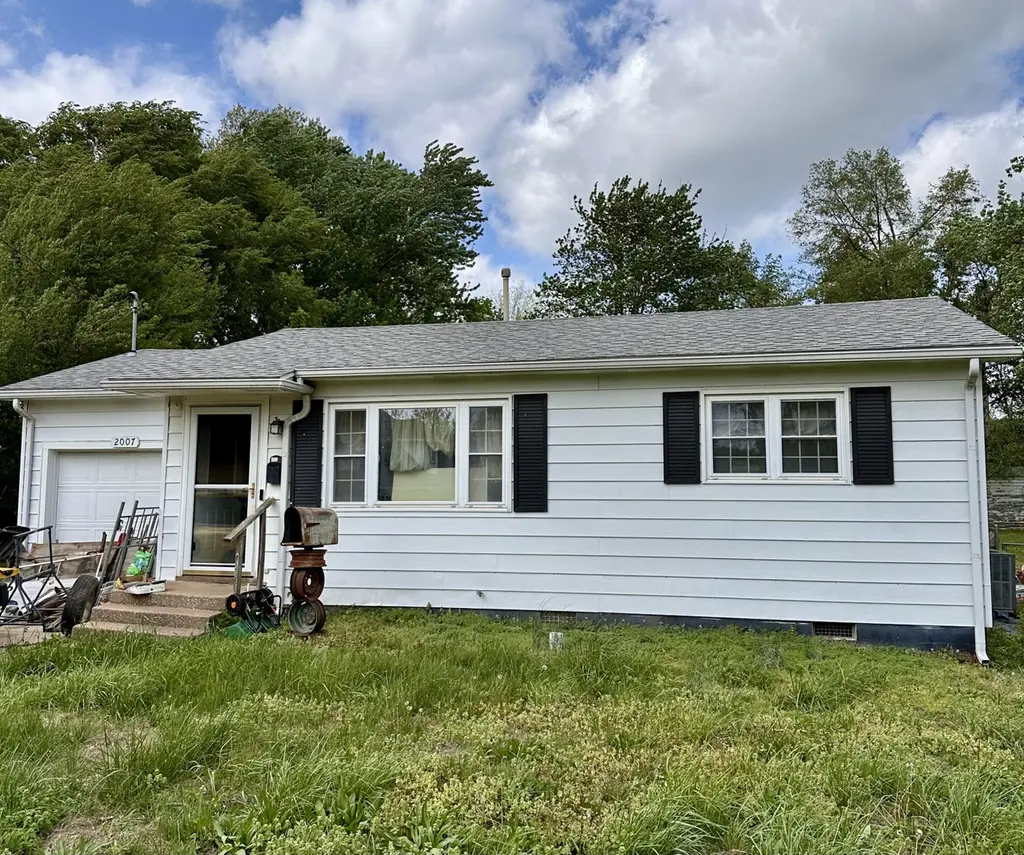
2007 W Water St · Springfield, MO
Flood risk 1/10 · Minimal
- FEMA flood zone
- X (unshaded)
- Chance of flooding over 30 yrs
- 0.0%
- Est. flood insurance / yr
- $507 – $1,088
Fire risk 1/10 · Minimal
- Est. fire insurance / yr
- $1,054 – $1,958
Heat risk 5/10 · Moderate
- Hot days now (above 104°F)
- 7 days/yr
- Hot days in 30 yrs
- 20 days/yr
Wind risk 2/10 · Minimal
- Chance of severe wind over 30 yrs
- —
Air-quality risk 2/10 · Minimal
- Unhealthy air days now
- 1 days/yr
- Unhealthy air days in 30 yrs
- 2 days/yr
Risk factors via First Street. Map © Google.
Why this score? — see what drove the B- grade
The composite is a weighted blend of 9 inputs, each scored 0–100. Each bar is that input's sub-score; the figure is the points it added to the 100-point composite (weight × sub-score).
- Cash flow +24.6/30.0
- ARV discount +15.0/15.0
- DSCR +8.0/10.0
- 1% rule +5.4/10.0
- Livability +3.8/5.0
- Rent growth +3.7/5.0
- Schools +3.2/10.0
- Condition / age +2.5/5.0
- Appreciation +0.0/10.0
$95,700
🖨 Deal sheet 📄 Offer letter ✓ Due diligence
Listing remarks MLS
Charming and cozy, this cute 2 bedroom, 1 bath home sits in the heart of Springfield, offering both convenience and comfort. With a spacious front yard and oversized fenced in back yard, there's plenty of room to relax, entertain or just enjoy the outdoors. Inside, you find a generously sized kitchen with space for cooking and gathering. This home has central heat & air and features a one car garage for parking or additional storage. Located just minutes from shopping, dining, and everyday essentials, this home combines a peaceful feel with easy access to amenities. Whether you're a first time homebuyer, downsizing, or looking for an investment opportunity, this one has tons of charm and potential!!
Key facts
- One car garage
- Central heat and air
- Fenced in back yard
Tags
Neighborhood map
What this means for you Summary
Snapshot
- This is a 2-bed/1.0-bath single-family listed at $96k.
Deal economics
- At list price, monthly cash flow is $199 ($2k/yr) — positive.
- The deal already cash-flows at list — no discount required.
- Meets the 1% rule at list price ($998 rent vs $96k).
- Recommended offer: $90k (6.0% below list) — sets the bar for market timing.
- Cap rate 8.8% vs local median 4.6% in Springfield — top-decile yield for the area; either an underpriced asset or a hidden risk that comps aren't pricing in. Stress-test before assuming the spread holds.
Location & tenants
- Location reads 75/100 on livability (#57 in MO, #4,121 nationally) — a middle-class / working-renter tenant base. Strengths: commute A+, cost of living A+, housing A+; Watch: crime F, employment F.
- Springfield R-XII (urban): math 32% / reading 46% proficiency, ranked #174 of 324 in MO (top 54%) — families likely to look elsewhere, expect single-tenant / working-renter base with shorter leases.
- Market conditions: Rents rising fast (+4.8%/yr); 512 active listings in the ZIP; 17 comparable units currently listed for rent nearby; rentals at typical pace (median 23d on market — plan ~3-4 weeks tenant-placement turnaround); 1,302 units permitted in Greene County in 2024 (250 in 5+ unit buildings).
Forward outlook
- Local home prices are declining (-3.0%/yr); year-one equity from $662 of loan paydown is wiped out by about $3k of value loss. Plan a longer hold.
- Greene County population projected at +25% by 2050 — long-run rental-demand tailwind backs the buy-and-hold thesis.
- At projected returns (-3.0% appreciation + 4.8% rent growth), your $27k cash investment doubles in ~10 years — after that, you're playing with house money.
Negotiation context
- It's been on market 64 days — a 6% lower offer ($90k) is reasonable based on typical stale-listing flexibility.
- 2 sale attempts since 7y ago with the ask held roughly flat each time — persistent listings suggest the price (not the market) is what's stuck; bring a comps-based counter.
Risks & watch-outs
- Watch-outs: built in 1954 — expect roof / HVAC / electrical / plumbing capex.
- Climate carrying-cost: extreme-heat days projected 7→20/yr by 2055 (HVAC capex compounding) — expect insurance premiums to compound above CPI over the hold.
Questions for the listing agent
- It's been on market 64 days. Have you received any prior offers? Is the seller open to a 6% concession, seller financing, or rate buy-down credit?
- Built in 1954 — when were the roof, HVAC, electrical panel, plumbing, and water heater last replaced?
- Why hasn't it sold? Are there any deal-killer items the seller is aware of (foundation, flood, title, zoning, code violations)?
- Is there a deadline driving the sale (1031 exchange, divorce, estate, relocation)? That informs how much negotiation room exists.
- Crime grade is F in this area — have there been break-ins, vandalism, or insurance claims at this property in the last 3 years? What carrier currently insures it and at what premium?
- What's the average days-on-market for RENTAL listings here right now (not sales)? A rising rental-DOM trend means longer vacancies and softer asking-rent achievability than the comps imply.
- What's the recent tenant-quality profile in this submarket — average credit score on applications, eviction rate, late-payment / NSF rate, and stable-employment percentage? A property-management company in the area should have these aggregated.
- How much new for-sale + rental construction is in the pipeline within 1–3 miles? Heavy new supply typically softens prices + rents 12–24 months out; constrained supply supports both.
Investment metrics
- 1% rule
- 1.04% ✓
- Cap rate
- 8.78%
- Cash-on-cash
- 8.90%
- DSCR
- 1.40
- GRM
- 8.0
CMA / ARV
- ARV (median comp)
- $128,474
- List price
- $95,700
- Delta
- -25.51%
- Verdict
- UNDERPRICED
- Comps
- 20 within 1.0 mi
Show comp detail 12 sales within ~0.75 mi
| Address | Dist | Beds/Ba | Sqft | Sold | Price | $/sf | Match |
|---|---|---|---|---|---|---|---|
| 612 N Park Ave | 0.28mi | 2/1.0 | 624 (-13%) | 4mo | $89,900 | $144 | 61 |
| 1030 N Warren Ave | 0.65mi | 2/1.0 | 700 (-3%) | 7mo | $95,000 | $136 | 59 |
| 810 N West Ave | 0.60mi | 2/1.0 | 768 (+7%) | 3mo | $119,000 | $155 | 58 |
| 207 N Forest Ave | 0.40mi | 2/1.0 | 624 (-13%) | 6mo | $125,000 | $200 | 54 |
| 2530 W Lincoln St | 0.64mi | 2/1.0 | 750 (+4%) | 12mo | $125,000 | $167 | 54 |
| 619 N Nettleton Ave | 0.47mi | 2/1.0 | 800 (+11%) | 10mo | $133,400 | $167 | 52 |
| 906 N Brown Ave | 0.68mi | 2/1.0 | 796 (+11%) | 3mo | $140,000 | $176 | 48 |
| 611 S Nettleton Ave | 0.64mi | 2/1.0 | 620 (-14%) | 3mo | $102,900 | $166 | 45 |
| 1016 N Wabash Ave | 0.58mi | 2/1.0 | 630 (-12%) | 9mo | $89,900 | $143 | 44 |
| 229 N Scenic Ave | 0.71mi | 2/1.0 | 664 (-8%) | 12mo | $87,500 | $132 | 44 |
| 2546 W Walnut St | 0.59mi | 2/1.0 | 824 (+14%) | 9mo | $108,000 | $131 | 41 |
| 1411 W Central St | 0.67mi | 2/1.0 | 812 (+13%) | 12mo | $150,000 | $185 | 37 |
Match score weights: distance 35% · size 25% · config 20% · recency 20%. Top-matched comps best support the ARV.
Projected returns pro-forma
-3.0% appreciation · 4.82% rent growth · sell at horizon
- IRR
- -1.0%
- Equity multiple
- 0.96×
- Total profit
- $-1,025
- Equity at exit
- $14,269
- IRR
- 10.4%
- Equity multiple
- 1.87×
- Total profit
- $23,204
- Equity at exit
- $8,274
Cash invested: $26,796 (down + closing). Projections, not guarantees.
Landlord ↔ Tenant lean methodology
- Overall (STATE)
- 81 Strongly Landlord-Friendly
- State Missouri
- 81 Strongly Landlord-Friendly · R+10
- County
- — inherits STATE
- City
- — inherits STATE
ZIP-level market 65802
- Home prices YoY
- -31.9%
- Rents YoY
- 4.8%
- Active inventory
- 512
- Price-to-rent
- 8.0×
Monthly cashflow live
- Estimated rent
- $998 high interval (Pro) →
- Mortgage (P&I)
- −$502
- Tax from tax record
- −$48 /mo · $575/yr
- Insurance
- −$40
- HOA
- −$0
- Vacancy / Maint / Mgmt
- −$210
- Net cashflow
- $199
Break-even live
UW: 25.0% down · 7.5% · 30yr · 1.5% tax · 5.0% vac · 8.0% maint · 8.0% mgmt
Financing live
Cash to close
- Down payment
- $23,925
- Closing costs
- $2,871
- Reserves months
- —
- Total cash needed
- —
Loan-product check · same deal, 3 products live
Conventional
25% down · 7.5% · 30yr
- Down + closing
- —
- Monthly P&I
- —
- Monthly cashflow
- —
- DSCR
- —
- Eligible?
- —
Personal DTI + credit; lowest rate.
DSCR
20% down · 8.5% · 30yr
- Down + closing
- —
- Monthly P&I
- —
- Monthly cashflow
- —
- DSCR
- —
- Eligible?
- —
No personal income docs; deal must DSCR.
Hard money
10% down · 12.0% · 12mo
- Down + closing
- —
- Monthly P&I
- —
- Monthly cashflow
- —
- DSCR
- —
- Eligible?
- —
Short-term bridge; refi at stabilization.
Rent comps 17 comps
| Address | Beds | Baths | Sqft | Rent | $/sqft | DOM | Units | Dist |
|---|---|---|---|---|---|---|---|---|
| 1740 W Olive St Springfield, MO | 3.0 | 1.0 | 736 | $1,195 | $1.62 | 13d | 1 | 0.17mi |
| 522 N Park Ave Springfield, MO | 1.0 | 1.0 | 608 | $950 | $1.56 | 43d | 1 | 0.26mi |
| 1911 W Elm St Springfield, MO | 2.0 | 1.0 | 580 | $875 | $1.51 | 43d | 1 | 0.30mi |
| 916 N Kansas Expy Springfield, MO | 1.0 | 1.0 | 573 | $595 | $1.04 | 43d | 1 | 0.62mi |
| 2711 W Olive St Springfield, MO | 1.0 | 1.0 | 621 | $750 | $1.21 | 23d | 1 | 0.73mi |
| 520 S Scenic Ave Unit 101-A Springfield, MO | 1.0 | 1.0 | 550 | $650 | $1.18 | 43d | 1 | 0.76mi |
| 2712 W Nichols St Springfield, MO | 2.0 | 1.0 | 619 | $795 | $1.28 | 43d | 1 | 0.89mi |
| 733 W College St Springfield, MO | 1.0 | 1.0 | 700 | $750 | $1.07 | 13d | 1 | 1.01mi |
| 813 W Poplar St Unit 813 Springfield, MO | 2.0 | 1.0 | 560 | $795 | $1.42 | 13d | 1 | 1.03mi |
| 1126 W Hamilton St Springfield, MO | 2.0 | 1.0 | 648 | $895 | $1.38 | 23d | 1 | 1.05mi |
| 235 N Market Ave Springfield, MO | 1.0–4.0 | 1.0–2.0 | 1350 | $1,267 | $0.94 | 13d | 4 | 1.24mi |
| 235 N Market Ave Springfield, MO | 1.0–4.0 | 1.0–2.0 | 1350 | $1,267 | $0.94 | 23d | 5 | 1.24mi |
| 305 S Campbell Ave Unit 208 Springfield, MO | 1.0 | 1.0 | 649 | $975 | $1.50 | 13d | 1 | 1.31mi |
| 138 Park Central Sq Springfield, MO | 1.0–2.0 | 1.0–2.0 | 1083 | $2,489 | $2.30 | 13d | 8 | 1.38mi |
| 209 W McDaniel St Unit 209-207 Springfield, MO | 1.0 | 1.0 | 700 | $950 | $1.36 | 43d | 1 | 1.41mi |
| 301 W State St Unit D Springfield, MO | 1.0 | 1.0 | 570 | $875 | $1.54 | 23d | 1 | 1.48mi |
| 810 W Catalpa St Apt 316 Springfield, MO | 1.0 | 1.0 | 581 | $551 | $0.95 | 23d | 1 | 1.48mi |
Listing history 18 events
-
2026-06-18days on market $95,700 Active 64 DOM
-
2026-06-17days on market $95,700 Active 63 DOM
-
2026-06-16days on market $95,700 Active 62 DOM
-
2026-06-15days on market $95,700 Active 61 DOM
-
2026-06-14days on market $95,700 Active 59 DOM
-
2026-06-10days on market $95,700 Active 56 DOM
-
2026-06-09days on market $95,700 Active 55 DOM
-
2026-06-08days on market $95,700 Active 54 DOM
-
2026-06-07days on market $95,700 Active 53 DOM
-
2026-06-03days on market $95,700 Active 49 DOM
-
2026-06-02days on market $95,700 Active 48 DOM
-
2026-06-01days on market $95,700 Active 47 DOM
-
2026-05-31days on market $95,700 Active 46 DOM
-
2026-05-30days on market $95,700 Active 45 DOM
-
2026-04-14$95,700 Active 714-char remark
Show marketing remark (714 chars)
Charming and cozy, this cute 2 bedroom, 1 bath home sits in the heart of Springfield, offering both convenience and comfort. With a spacious front yard and oversized fenced in back yard, there's plenty of room to relax, entertain or just enjoy the outdoors. Inside, you find a generously sized kitchen with space for cooking and gathering. This home has central heat & air and features a one car garage for parking or additional storage. Located just minutes from shopping, dining, and everyday essentials, this home combines a peaceful feel with easy access to amenities. Whether you're a first time homebuyer, downsizing, or looking for an investment opportunity, this one has tons of charm and potential!!
-
2019-10-17soldstatus
-
2019-10-16soldstatus 761-char remark
Show marketing remark (761 chars)
Near Route 66 & Downtown! Adorable tiny house with endless backyard to grow your veggies and care for your chickens! Lovely urban farming, peaceful green pasture, and room to grow. All this and close to downtown, short drive to all colleges and everything the City has to offer too!! Just PERFECT! This home is not a flip, it has been very loved and well cared for and comes with updated electrical, brand new roof, newer HVAC, newer windows, new carpet, updated plumbing, and fresh paint. Cute as a button! Huge WEEDLESS Yard, front and back. Seems like rich soil too! Quiet neighborhood, with easy commuter access. Only one block from historic Route 66! At this great price and great condition, this cutie won't be around long. Call Today for your tour!
-
2019-09-01$62,000 761-char remark
Show marketing remark (761 chars)
Near Route 66 & Downtown! Adorable tiny house with endless backyard to grow your veggies and care for your chickens! Lovely urban farming, peaceful green pasture, and room to grow. All this and close to downtown, short drive to all colleges and everything the City has to offer too!! Just PERFECT! This home is not a flip, it has been very loved and well cared for and comes with updated electrical, brand new roof, newer HVAC, newer windows, new carpet, updated plumbing, and fresh paint. Cute as a button! Huge WEEDLESS Yard, front and back. Seems like rich soil too! Quiet neighborhood, with easy commuter access. Only one block from historic Route 66! At this great price and great condition, this cutie won't be around long. Call Today for your tour!
ⓘ Source: listings_history table (triggers on properties + properties_extension) + one-shot
backfill from property_details.listing_events for pre-trigger history.
Tax reassessment forecast MO · Resets to sale price
- Current annual tax
- $575 · $48/mo
- Projected year-2 tax
- $928 · $77/mo
- Expected delta
- +$353/yr (+$29/mo · 61.3%)
ⓘ Screening estimate from a state-policy table — verify with the county assessor before closing.
Climate risk First Street
- Flood 1/10 Low FEMA zone X (unshaded) · 0% chance over 30 yrs
- Wildfire 1/10 Low
- Heat 5/10 Major 7 d/yr ≥104°F today · 20 d/yr by 30 yrs out
- Wind 2/10 Low
- Air quality 2/10 Low 1 unhealthy d/yr today · 2 by 30 yrs out
Nearby sold comps map
Loading sold comps map…
Walkable amenities ~0.75 mi
Loading nearby amenities…
Taxation est. · year 1
- Rental income
- $11,975
- − Mortgage interest
- −$5,361
- − Property taxes
- −$575
- − Insurance
- −$478
- − Repairs & maintenance
- −$958
- − Management
- −$958
- − Depreciation
- −$2,784
- Taxable income
- $860
- Est. tax owed @ 24.0%
- −$206
- After-tax cash flow
- $2,177/yr
For passive investors: Depreciation is non-cash, so a rental often shows a tax loss while cash-flowing — sheltering income. Rental losses are passive: they offset passive income freely, and up to $25,000/yr can offset ordinary (W-2) income if you actively participate and your MAGI is under $100k (phasing out to $0 by $150k); unused losses carry forward. On sale, claimed depreciation is recaptured at up to 25%, and gains may owe capital-gains tax (a 1031 exchange can defer both). Figures are a year-1 estimate at your 24.0% rate — not tax advice; consult a CPA.
Schools (NCES district)
- District
- Springfield R-XII
- NCES district ID
- 2928860
- Math proficiency
- 32% ▼ -2.00%
- Reading proficiency
- 46% ▼ -3.00%
- Median HH income
- $37,886
- Composite
- 32.45/100
- National rank
- #5717
- State rank
- #174 of 324 in MO
Livability — Springfield
- Score
- 75/100
- State rank
- #57
- US rank
- #4121
Category grades
Schools grade is shown separately in the Schools card above.
Census & demographics
- Census place
- Springfield, MO
- County
- Greene County · 244,327 people
- City population
- 223,044
- Metro
- Springfield, MO
- Population (ZIP)
- 46,739
- Household income
- $55,019
- Rent vs Own
- Severe rent burden
- 1818.0
Population outlook (Greene County) Hauer SSP2
- Today (2025)
- 319,054 people
- By 2030
- 335,135 · +5.0%
- By 2040
- 366,186 · +14.8%
- By 2050
- 397,431 · +24.6%
- By 2075
- 477,035 · +49.5%
- By 2100
- 520,828 · +63.2%
Race, ethnicity, and origin ACS 2023
- Neighborhood character
- Predominantly White (81%)
- Race & ethnicity
- White 81% Two or more races 8% Hispanic / Latino 5% Black 4% Asian 2%
- Common ancestry
- Slovak 2% Lithuanian 2% Italian 2%
- Foreign-born
- 3% · Canada, Vietnam
- Languages at home
- 95% English-only · Spanish 2% Vietnamese 1% Other Indo-European 1%
Political lean MEDSL · Greene
- 2024 margin
- Strong R (+20.8) · D 38.9% · R 59.7% · Other 1.4%
- 2008→2024 swing
- -5.0pp toward R · 2008: -15.8pp · 2024: -20.8pp
- All cycles
- 2024: R+20.8 2020: R+20.1 2016: R+27.4 2012: R+24.4 2008: R+15.8
Not yet ingested
- Civics
- —
Market trends
- HPI YoY
- ▼ -99.72%
- Current HPI
- 212.9826
- Rent YoY
- ▲ 4.82%
- Metro
- Springfield, MO
- State GDP YoY
- ▲ 1.84%
- F500 in state
- 20
Industry mix (Fortune 500 HQ in MO)
| Industry | F500 HQs | Revenue |
|---|---|---|
| Healthcare | 1 | $163B |
|
||
| Insurance | 1 | $21B |
|
||
| Industrial Technology | 1 | $17B |
|
||
| Retail | 1 | $16B |
|
||
| Industrial Distribution | 1 | $10B |
|
||
| Utilities | 1 | $9B |
|
||
Price history
+54.4% since first listed4 events — show timeline
- 2026-04-14 Listed $95,700 SOMO
- 2019-10-17 Sold (Public Records) — Public Records
- 2019-10-16 Sold (MLS) — SOMO
- 2019-09-01 Listed $62,000 SOMO
Property tax history
+3.2%/yrLatest (2025): $575 · +21.3% YoY. Source: county tax records.
Cash-flow waterfall
monthlySold comps — $/sqft
last 12 mo · ≤1 miLoading sold comps…