8573 Elkrun Dr · Independence, MI
Flood risk 3/10 · Minor
- FEMA flood zone
- X (unshaded)
- Chance of flooding over 30 yrs
- 0.2%
- Est. flood insurance / yr
- $473 – $860
Fire risk 1/10 · Minimal
- Est. fire insurance / yr
- $784 – $1,456
Heat risk 2/10 · Minimal
- Hot days now (above 95°F)
- 7 days/yr
- Hot days in 30 yrs
- 15 days/yr
Wind risk 2/10 · Minimal
- Chance of severe wind over 30 yrs
- —
Air-quality risk 3/10 · Minor
- Unhealthy air days now
- 2 days/yr
- Unhealthy air days in 30 yrs
- 4 days/yr
Risk factors via First Street. Map © Google.
Why this score? — see what drove the B- grade
The composite is a weighted blend of 9 inputs, each scored 0–100. Each bar is that input's sub-score; the figure is the points it added to the 100-point composite (weight × sub-score).
- Cash flow +30.0/30.0
- DSCR +10.0/10.0
- 1% rule +8.7/10.0
- ARV discount +7.5/15.0
- Schools +4.8/10.0
- Rent growth +2.5/5.0
- Livability +2.5/5.0
- Condition / age +2.5/5.0
- Appreciation +0.0/10.0
$164,900
🖨 Deal sheet (PDF) 📄 Offer letter ✓ Due diligence
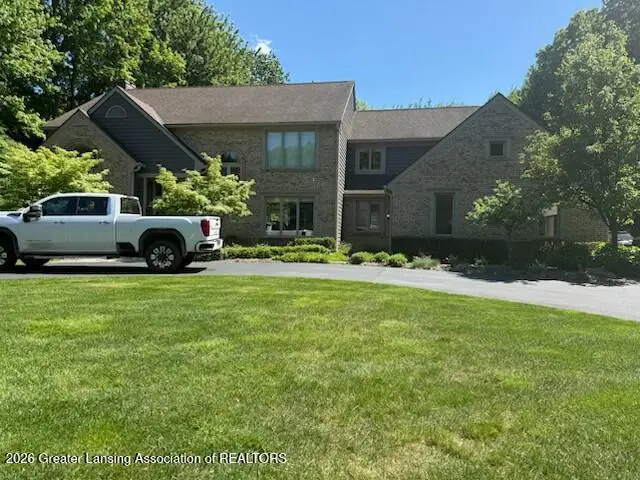
Listing remarks MLS
Very big yard in the City, a quiet neighborhood with very close views of the river. This eclectic colonial home has all the cuteness (1,180 SF), there's one room on the main floor that would make a great office facing Chester St, a fireplace in the living room (seller says an inspector informed them it needs a new liner in order to use), a nice big laundry room that could possibly be a 3rd bedroom with some minor adjustments. Newer gas forced air furnace, newer electric water heater, plumbed for a water softener (included in sale, just not hooked up), 1/2 bath on the main floor, full bath on the 2nd floor.
Key facts
- Big yard
- Views of the river
- Big laundry room
Tags
Property features AI
Exterior
- Parking: Driveway parking (no attached garage)
- Utilities: Sewer: Other
- Home design: Bi-level home; Built in 1989
- Construction: Stone construction
- Exterior features: Lot in the Deer Creek subdivision; Lot dimensions approximately 135 x 230
Interior
- Kitchen: Kitchen (appliances listed as other)
- Bedrooms: 5 bedrooms (including a primary bedroom)
- Bathrooms: 5 full bathrooms; 1 half bathroom
- Heating & cooling: Central heating; Central air conditioning
- Interior features: Side entry door; Finished basement; Other appliances (unspecified); Laundry features: other / see remarks
- Laundry & utility: Laundry area (details: other / see remarks)
Neighborhood map
What this means for you Summary
Snapshot
- This is a 4-bed/3.5-bath single-family listed at $165k.
Deal economics
- At list price, monthly cash flow is $644 ($8k/yr) — positive.
- The deal already cash-flows at list — no discount required.
- Meets the 1% rule at list price ($2k rent vs $165k).
Location & tenants
- Location reads: area grade B — affects rentability + tenant quality, not the cash-flow math above.
- Clarkston Community School District (suburban): math 48% / reading 58% proficiency, ranked #69 of 540 in MI (top 13%) — acceptable for families but not a draw, mixed tenant base, ~2y average lease; only 16% free/reduced lunch — higher-income household profile.
- Market conditions: 155 active listings in the ZIP; high-income renter base; 2,614 units permitted in Oakland County in 2024 (721 in 5+ unit buildings).
Forward outlook
- Local home prices are declining (-3.0%/yr); year-one equity from $1k of loan paydown is wiped out by about $5k of value loss. Plan a longer hold.
- Oakland County population projected at +10% by 2050 — modest demand growth; plan on rents tracking national, not racing it.
- At projected returns (-3.0% appreciation + 3.0% rent growth), your $46k cash investment doubles in ~8 years — after that, you're playing with house money.
Negotiation context
- Only 1 days on market — expect competitive offers; lowballing is unlikely to land.
- 19 sale attempts since 29y ago; this cycle's ask has dropped $635k (79%) from the opening price — seller is motivated, your offer sets the floor, not the list.
Questions for the listing agent
- Is there a deadline driving the sale (1031 exchange, divorce, estate, relocation)? That informs how much negotiation room exists.
- What's the average days-on-market for RENTAL listings here right now (not sales)? A rising rental-DOM trend means longer vacancies and softer asking-rent achievability than the comps imply.
- What's the recent tenant-quality profile in this submarket — average credit score on applications, eviction rate, late-payment / NSF rate, and stable-employment percentage? A property-management company in the area should have these aggregated.
- How much new for-sale + rental construction is in the pipeline within 1–3 miles? Heavy new supply typically softens prices + rents 12–24 months out; constrained supply supports both.
Investment metrics
- 1% rule
- 1.37% ✓
- Cap rate
- 10.98%
- Cash-on-cash
- 16.73%
- DSCR
- 1.74
- GRM
- 6.1
CMA / ARV
- ARV (on-the-fly)
- $576,121
- Comps found
- 12
Show comp detail 12 sales within ~0.75 mi
| Address | Dist | Beds/Ba | Sqft | Sold | Price | $/sf | Match |
|---|---|---|---|---|---|---|---|
| 6571 Deer Ridge Dr | 0.27mi | 3/3.0 (-1) | 3,464 (+2%) | 4mo | $525,000 | $152 | 74 |
| 6600 Park Valley Dr | 0.29mi | 4/3.5 | 3,578 (+5%) | 12mo | $660,250 | $185 | 68 |
| 8291 Fawn Valley Cir | 0.39mi | 4/3.5 | 3,623 (+6%) | 8mo | $555,000 | $153 | 65 |
| 6871 Berry Pointe Dr | 0.47mi | 3/3.5 (-1) | 3,400 (-0%) | 10mo | $575,000 | $169 | 64 |
| 8177 Fawn Valley Dr | 0.51mi | 4/2.5 | 3,278 (-4%) | 12mo | $469,900 | $143 | 56 |
| 6847 Hubbard Cir | 0.54mi | 4/2.5 | 3,530 (+4%) | 14mo | $635,000 | $180 | 54 |
| 8140 Staghorn Trl | 0.55mi | 4/2.5 | 3,645 (+7%) | 11mo | $565,000 | $155 | 50 |
| 6751 Berry Pointe Dr | 0.61mi | 4/2.5 | 3,047 (-11%) | 4mo | $668,000 | $219 | 46 |
| 8085 Deerwood Rd | 0.65mi | 4/2.5 | 3,596 (+6%) | 14mo | $595,000 | $165 | 44 |
| 8094 Deerwood Rd | 0.68mi | 4/2.5 | 3,160 (-7%) | 11mo | $475,000 | $150 | 43 |
| 6866 Williamsbury Cir | 0.69mi | 5/3.5 (+1) | 3,822 (+12%) | 2mo | $680,000 | $178 | 41 |
| 8000 Barrington Ln | 0.71mi | 4/2.5 | 3,024 (-11%) | 5mo | $550,000 | $182 | 40 |
Match score weights: distance 35% · size 25% · config 20% · recency 20%. Top-matched comps best support the ARV.
Projected returns pro-forma
-3.0% appreciation · 3.0% rent growth · sell at horizon
- IRR
- 7.9%
- Equity multiple
- 1.31×
- Total profit
- $14,309
- Equity at exit
- $24,587
- IRR
- 17.2%
- Equity multiple
- 2.42×
- Total profit
- $65,386
- Equity at exit
- $14,258
Cash invested: $46,172 (down + closing). Projections, not guarantees.
Landlord ↔ Tenant lean methodology
- Overall (STATE)
- 62 Landlord-Friendly
- State Michigan
- 62 Landlord-Friendly · EVEN
- County
- — inherits STATE
- City
- — inherits STATE
ZIP-level market 48348
- Active inventory
- 155
- Price-to-rent
- 6.1×
Monthly cashflow live
- Estimated rent
- $2,257 medium interval (Pro) →
- Mortgage (P&I)
- −$865
- Tax est. 1.5%
- −$206 /mo · $2,474/yr
- Insurance
- −$69
- HOA
- −$0
- Vacancy / Maint / Mgmt
- −$474
- Net cashflow
- $644
Break-even live
Sensitivity live
| Price | -10% $758 | -5% $701 | +0% $644 | +5% $587 | +10% $530 |
|---|---|---|---|---|---|
| Rent | -10% $465 | -5% $555 | +0% $644 | +5% $733 | +10% $822 |
| Rate | -1.0pp $727 | -0.5pp $686 | base $644 | +0.5pp $601 | +1.0pp $557 |
UW: 25.0% down · 7.5% · 30yr · 1.5% tax · 5.0% vac · 8.0% maint · 8.0% mgmt
Financing live
Cash to close
- Down payment
- $41,225
- Closing costs
- $4,947
- Reserves months
- —
- Total cash needed
- —
Loan-product check · same deal, 3 products live
Conventional
25% down · 7.5% · 30yr
- Down + closing
- —
- Monthly P&I
- —
- Monthly cashflow
- —
- DSCR
- —
- Eligible?
- —
Personal DTI + credit; lowest rate.
DSCR
20% down · 8.5% · 30yr
- Down + closing
- —
- Monthly P&I
- —
- Monthly cashflow
- —
- DSCR
- —
- Eligible?
- —
No personal income docs; deal must DSCR.
Hard money
10% down · 12.0% · 12mo
- Down + closing
- —
- Monthly P&I
- —
- Monthly cashflow
- —
- DSCR
- —
- Eligible?
- —
Short-term bridge; refi at stabilization.
Listing history 2 events
-
2026-06-03remarks 613-char remark
-
2026-06-03$164,900 Active 1 DOM
ⓘ Source: listings_history table (triggers on properties + properties_extension) + one-shot
backfill from property_details.listing_events for pre-trigger history.
Climate risk First Street
- Flood 3/10 Moderate FEMA zone X (unshaded) · 20% chance over 30 yrs
- Wildfire 1/10 Low
- Heat 2/10 Low 7 d/yr ≥95°F today · 15 d/yr by 30 yrs out
- Wind 2/10 Low
- Air quality 3/10 Moderate 2 unhealthy d/yr today · 4 by 30 yrs out
Nearby sold comps map
Loading sold comps map…
Walkable amenities ~0.75 mi
Loading nearby amenities…
Taxation est. · year 1
- Rental income
- $27,087
- − Mortgage interest
- −$9,237
- − Property taxes
- −$2,474
- − Insurance
- −$824
- − Repairs & maintenance
- −$2,167
- − Management
- −$2,167
- − Depreciation
- −$4,797
- Taxable income
- $5,421
- Est. tax owed @ 24.0%
- −$1,301
- After-tax cash flow
- $6,423/yr
For passive investors: Depreciation is non-cash, so a rental often shows a tax loss while cash-flowing — sheltering income. Rental losses are passive: they offset passive income freely, and up to $25,000/yr can offset ordinary (W-2) income if you actively participate and your MAGI is under $100k (phasing out to $0 by $150k); unused losses carry forward. On sale, claimed depreciation is recaptured at up to 25%, and gains may owe capital-gains tax (a 1031 exchange can defer both). Figures are a year-1 estimate at your 24.0% rate — not tax advice; consult a CPA.
Schools (NCES district)
- District
- Clarkston Community School District
- NCES district ID
- 2609900
- Math proficiency
- 48% ▼ -8.00%
- Reading proficiency
- 58% ▼ -5.00%
- Median HH income
- $79,317
- Composite
- 48.04/100
- National rank
- #2193
- State rank
- #69 of 540 in MI
Livability — Independence
No livability data for this city. (Only ~50 U.S. cities are tracked.)
Census & demographics
- County
- Oakland County · 1,009,092 people
- Metro
- Detroit-Warren-Dearborn, MI
- Population (ZIP)
- 24,574
- Household income
- $129,410
- Rent vs Own
- Severe rent burden
- 212.0
Population outlook (Oakland County) Hauer SSP2
- Today (2025)
- 1,335,747 people
- By 2030
- 1,375,100 · +2.9%
- By 2040
- 1,435,385 · +7.5%
- By 2050
- 1,469,250 · +10.0%
- By 2075
- 1,531,946 · +14.7%
- By 2100
- 1,450,485 · +8.6%
Race, ethnicity, and origin ACS 2023
- Neighborhood character
- Predominantly White (87%)
- Race & ethnicity
- White 87% Two or more races 6% Hispanic / Latino 5% Black 2% Asian 2%
- Hispanic origin (detail)
- Mexican 2%
- Common ancestry
- Romanian 10% Slovak 4% Lithuanian 3%
- Foreign-born
- 5% · Canada, Vietnam
- Languages at home
- 95% English-only · Spanish 2% French/Haitian/Cajun 1% Other Indo-European 1%
Political lean MEDSL · Oakland
- 2024 margin
- D (+10.6) · D 54.4% · R 43.8% · Other 1.9%
- 2008→2024 swing
- -3.9pp toward R · 2008: 14.5pp · 2024: 10.6pp
- All cycles
- 2024: D+10.6 2020: D+14.1 2016: D+8.1 2012: D+8.1 2008: D+14.5
Not yet ingested
- Civics
- —
Market trends
- HPI YoY
- ▼ -275.65%
- Current HPI
- 196.4302
- Rent YoY
- —
- Metro
- Detroit-Warren-Dearborn, MI
- State GDP YoY
- ▲ 1.37%
- F500 in state
- 28
Industry mix (Fortune 500 HQ in MI)
| Industry | F500 HQs | Revenue |
|---|---|---|
| Automotive Parts | 3 | $48B |
|
||
| Automotive | 2 | $372B |
|
||
| Chemicals | 1 | $45B |
|
||
| Automotive Retail | 1 | $29B |
|
||
| Healthcare / Medical Devices | 1 | $23B |
|
||
| Automotive Technology | 1 | $20B |
|
||
Price history
+873.8% since first listed51 events — show timeline
- 2026-04-30 Sold (MLS) $779,000 Greater Lansing AoR
- 2026-04-30 Sold (MLS) $779,000 REALCOMP
- 2026-02-20 Price Changed $779,000 Greater Lansing AoR
- 2025-12-15 Listing Removed — MiRealSource-MiMLS
- 2025-12-15 Listing Removed — REALCOMP
- 2025-11-28 Price Changed $779,000 MiRealSource-MiMLS
- 2025-11-28 Price Changed $779,000 REALCOMP
- 2025-11-07 Listed $799,900 MiRealSource-MiMLS
- 2025-11-07 Listed $799,900 REALCOMP
- 2025-11-06 Coming Soon — MiRealSource-MiMLS
- 2025-05-19 Listed $164,900 Greater Lansing AoR
- 2025-05-19 Listed $164,900 REALCOMP
- 2012-10-26 Sold (MLS) $341,000 REALCOMP
- 2012-10-26 Sold (MLS) $341,000 MiRealSource-MiMLS
- 2012-08-06 Listing Removed — REALCOMP
- 2012-08-06 Listing Removed — MiRealSource-MiMLS
- 2012-07-19 Listed $367,500 REALCOMP
- 2012-07-19 Listed $367,500 MiRealSource-MiMLS
- 2007-04-12 Sold (Public Records) $425,000 Public Records
- 2007-04-02 Sold (MLS) $425,000 REALCOMP
- 2006-11-14 Listing Removed — REALCOMP
- 2006-11-14 Listing Removed — MiRealSource-MiMLS
- 2006-11-14 Listed $489,900 REALCOMP
- 2006-09-01 Listed $575,000 REALCOMP
- 2006-09-01 Listed $575,000 MiRealSource-MiMLS
- 2006-08-31 Listing Removed — MiRealSource-MiMLS
- 2006-08-31 Listing Removed — REALCOMP
- 2006-02-18 Listed $610,000 MiRealSource-MiMLS
- 2006-02-18 Listed $610,000 REALCOMP
- 2006-02-10 Listing Removed — MiRealSource-MiMLS
- 2006-02-10 Listing Removed — REALCOMP
- 2005-11-10 Listed $625,000 MiRealSource-MiMLS
- 2005-11-10 Listed $625,000 REALCOMP
- 2005-11-02 Listing Removed — REALCOMP
- 2005-11-02 Listing Removed — MiRealSource-MiMLS
- 2005-05-02 Listed $625,000 REALCOMP
- 2005-05-02 Listed $625,000 MiRealSource-MiMLS
- 2000-07-17 Sold (Public Records) $550,000 Public Records
- 2000-06-16 Sold (MLS) $550,000 REALCOMP
- 2000-04-11 Listed $585,000 REALCOMP
- 1999-03-02 Sold (Public Records) $437,500 Public Records
- 1999-01-15 Sold (MLS) $437,500 REALCOMP
- 1998-07-23 Listing Removed — REALCOMP
- 1998-07-23 Listed $475,000 REALCOMP
- 1998-04-03 Listed $498,000 REALCOMP
- 1997-12-13 Listing Removed — REALCOMP
- 1997-09-12 Listed $549,900 REALCOMP
- 1994-02-07 Sold (Public Records) $370,000 Public Records
- 1991-10-18 Sold (Public Records) $363,925 Public Records
- 1991-10-18 Sold (Public Records) $80,000 Public Records
- 1991-01-18 Sold (Public Records) $80,000 Public Records
Property tax history
+3.1%/yrLatest (2025): $8,332 · +4.0% YoY. Source: county tax records.
Cash-flow waterfall
monthlySold comps — $/sqft
last 12 mo · ≤1 miLoading sold comps…