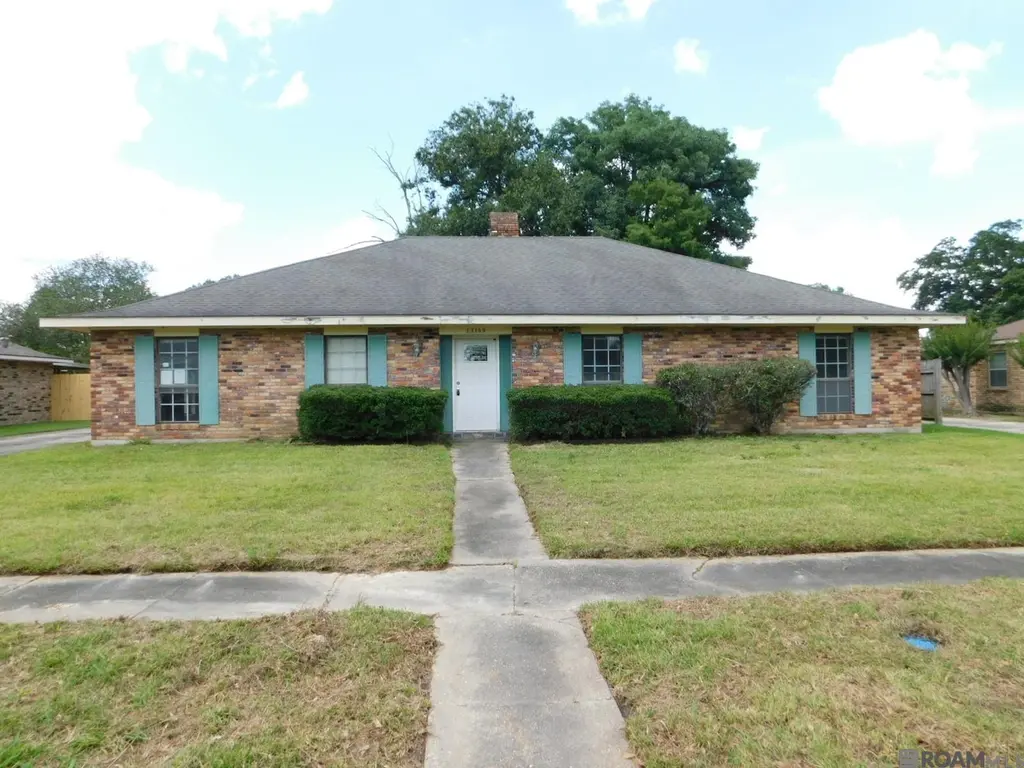
13159 Todd Ave · Baton Rouge, LA
Flood risk 1/10 · Minimal
- FEMA flood zone
- X
- Chance of flooding over 30 yrs
- 0.0%
- Est. flood insurance / yr
- $507 – $1,088
Fire risk 1/10 · Minimal
- Est. fire insurance / yr
- $1,269 – $2,357
Heat risk 8/10 · Major
- Hot days now (above 108°F)
- 7 days/yr
- Hot days in 30 yrs
- 20 days/yr
Wind risk 9/10 · Severe
- Chance of severe wind over 30 yrs
- 99.0%
Air-quality risk 3/10 · Minor
- Unhealthy air days now
- 3 days/yr
- Unhealthy air days in 30 yrs
- 3 days/yr
Risk factors via First Street. Map © Google.
Why this score? — see what drove the C- grade
The composite is a weighted blend of 9 inputs, each scored 0–100. Each bar is that input's sub-score; the figure is the points it added to the 100-point composite (weight × sub-score).
- Cash flow +15.9/30.0
- ARV discount +15.0/15.0
- DSCR +4.9/10.0
- Livability +3.7/5.0
- 1% rule +3.5/10.0
- Rent growth +2.5/5.0
- Condition / age +2.5/5.0
- Schools +2.4/10.0
- Appreciation +0.0/10.0
$220,000
🖨 Deal sheet (PDF) 📄 Offer letter ✓ Due diligence
Listing remarks MLS
Three bedroom 2.5 bath home nestled in peaceful Sherwood Forest subdivision. Property offers huge 17 x 31 sunroom perfect for relaxing mornings or evening unwinding, convenient rear parking carport. Step inside to massive open floorplan, laminate wood flooring, built-ins, cozy brick gas logs fireplace. Kitchen offers white cabinetry with ample storage, range oven, and an electric cooktop. Just off kitchen, breakfast and dining area provides a perfect setting for entertaining family and friends. Oversized primary bathroom includes dual vanities and large walk-in closet. Outside, enjoy spacious backyard shaded by mature trees, 7 x 21 outside storage room for all your storage needs. Huge mudroom. With a little TLC, this home presents endless potential for a first-time buyer or an excellent investment opportunity.
Key facts
- Open floorplan
- Sunroom
- Rear parking carport
Tags
Property features AI
Exterior
- Parking: Has carport
- Utilities: Public sewer
- Home design: Detached single-family residence; Residential property
- Construction: Brick construction; Slab foundation; Built on a slab
- Exterior features: Frontage approximately 86 feet; Lot dimensions approximately 86 x 142 (about 0.28 acres)
Interior
- Bathrooms: 2 full bathrooms; 1 partial bathroom
- Heating & cooling: Central heating; Central air conditioning
- Interior features: Fireplace with gas log
Neighborhood map
What this means for you Summary
Snapshot
- This is a 3-bed/2.5-bath single-family listed at $220k.
Deal economics
- At list price, monthly cash flow is $104 ($1k/yr) — positive.
- The deal already cash-flows at list — no discount required.
- To meet the 1% rule (rent ≥ 1% of price), the offer needs to be $187k (15.2% below list).
- Recommended offer: $187k (15.2% below list) — sets the bar for 1% rule.
- Cap rate 6.9% vs local median 4.2% in Baton Rouge — top-decile yield for the area; either an underpriced asset or a hidden risk that comps aren't pricing in. Stress-test before assuming the spread holds.
Location & tenants
- Location reads 74/100 on livability (#24 in LA, #4,535 nationally) — a middle-class / working-renter tenant base. Strengths: commute A+, cost of living A+, health & safety A+; Watch: amenities D, crime F, employment D-.
- East Baton Rouge Parish (urban): math 22% / reading 34% proficiency, ranked #47 of 98 in LA (top 48%) — low school quality limits family demand, transient renter base, plan for 1-2y turnover; 77% free/reduced lunch — lower-income household profile, screen leases tightly.
- Zoned schools: Twin Oaks Elementary School (math 24% / reading 25%, grade F, #384 of 646 statewide, top 62%, 485 students, 76% FRL); Southeast Middle School (math 7% / reading 18%, grade F, #191 of 218 statewide, top 88%, 994 students, 77% FRL); Liberty High School (math 50% / reading 74%, grade B-, #15 of 265 statewide, top 6%, 1,208 students, 60% FRL).
- Market conditions: 167 active listings in the ZIP; 8 comparable units currently listed for rent nearby; rentals at typical pace (median 25d on market — plan ~3-4 weeks tenant-placement turnaround); 2,252 units permitted in East Baton Rouge Parish in 2024 (440 in 5+ unit buildings).
- This rent runs 38% of the median local income ($59k/yr) — at the standard rent-burdened threshold; future hikes will face affordability resistance.
Forward outlook
- Local home prices are declining (-3.0%/yr); year-one equity from $2k of loan paydown is wiped out by about $7k of value loss. Plan a longer hold.
- East Baton Rouge County population projected at +4% by 2050 — modest demand growth; plan on rents tracking national, not racing it.
Negotiation context
- It's been on market 25 days — a 2% lower offer ($217k) is reasonable based on typical stale-listing flexibility.
- 2 sale attempts; this cycle's ask has dropped $69k (24%) from the opening price — seller is motivated, your offer sets the floor, not the list.
Risks & watch-outs
- Climate carrying-cost: severe wind risk, 99% chance of damaging wind over 30y; extreme-heat days projected 7→20/yr by 2055 (HVAC capex compounding) — expect insurance premiums to compound above CPI over the hold.
Questions for the listing agent
- Built in 1971 — when were the roof, HVAC, electrical panel, plumbing, and water heater last replaced?
- Is there a deadline driving the sale (1031 exchange, divorce, estate, relocation)? That informs how much negotiation room exists.
- Crime grade is F in this area — have there been break-ins, vandalism, or insurance claims at this property in the last 3 years? What carrier currently insures it and at what premium?
- What's the average days-on-market for RENTAL listings here right now (not sales)? A rising rental-DOM trend means longer vacancies and softer asking-rent achievability than the comps imply.
- What's the recent tenant-quality profile in this submarket — average credit score on applications, eviction rate, late-payment / NSF rate, and stable-employment percentage? A property-management company in the area should have these aggregated.
- How much new for-sale + rental construction is in the pipeline within 1–3 miles? Heavy new supply typically softens prices + rents 12–24 months out; constrained supply supports both.
Investment metrics
- 1% rule
- 0.85% ✗
- Cap rate
- 6.86%
- Cash-on-cash
- 2.03%
- DSCR
- 1.09
- GRM
- 9.8
CMA / ARV
- ARV (on-the-fly)
- $287,601
- Comps found
- 12
Show comp detail 12 sales within ~0.75 mi
| Address | Dist | Beds/Ba | Sqft | Sold | Price | $/sf | Match |
|---|---|---|---|---|---|---|---|
| 12511 E Robinhood Dr | 0.40mi | 4/2.0 (+1) | 2,525 (-2%) | 4mo | $249,900 | $99 | 67 |
| 12648 Mollylea Dr | 0.41mi | 4/2.5 (+1) | 2,505 (-3%) | 10mo | $279,700 | $112 | 62 |
| 822 Woodcliff Dr | 0.52mi | 4/2.5 (+1) | 2,610 (+1%) | 9mo | $289,900 | $111 | 62 |
| 613 Kimmeridge Dr | 0.28mi | 4/2.5 (+1) | 2,289 (-12%) | 2mo | $269,900 | $118 | 60 |
| 12532 Archery Dr | 0.38mi | 3/2.0 | 2,313 (-11%) | 2mo | $240,000 | $104 | 60 |
| 326 Wilton Dr | 0.63mi | 4/2.5 (+1) | 2,576 (-1%) | 13mo | $260,000 | $101 | 54 |
| 1213 Stokley Pl | 0.60mi | 3/2.0 | 2,338 (-10%) | 1mo | $189,000 | $81 | 53 |
| 12425 Mollylea Dr | 0.50mi | 4/2.5 (+1) | 2,457 (-5%) | 15mo | $266,900 | $109 | 50 |
| 379 Wilton Dr | 0.61mi | 4/3.0 (+1) | 2,419 (-7%) | 7mo | $289,000 | $119 | 48 |
| 12440 Goodwood Blvd | 0.72mi | 4/2.5 (+1) | 2,567 (-1%) | 15mo | $305,000 | $119 | 47 |
| 371 Kay Dr | 0.66mi | 3/2.0 | 2,356 (-9%) | 8mo | $229,900 | $98 | 46 |
| 12267 Fairhaven Dr | 0.72mi | 4/2.5 (+1) | 2,848 (+10%) | 16mo | $325,000 | $114 | 32 |
Match score weights: distance 35% · size 25% · config 20% · recency 20%. Top-matched comps best support the ARV.
Projected returns pro-forma
-3.0% appreciation · 3.0% rent growth · sell at horizon
- IRR
- -13.1%
- Equity multiple
- 0.53×
- Total profit
- $-29,079
- Equity at exit
- $32,803
- IRR
- -4.2%
- Equity multiple
- 0.72×
- Total profit
- $-17,038
- Equity at exit
- $19,022
Cash invested: $61,600 (down + closing). Projections, not guarantees.
Landlord ↔ Tenant lean methodology
- Overall (STATE)
- 90 Strongly Landlord-Friendly
- State Louisiana
- 90 Strongly Landlord-Friendly · R+12
- County
- — inherits STATE
- City
- — inherits STATE
ZIP-level market 70815
- Active inventory
- 167
- Price-to-rent
- 9.8×
Monthly cashflow live
- Estimated rent
- $1,866 high interval (Pro) →
- Mortgage (P&I)
- −$1,154
- Tax from tax record
- −$125 /mo · $1,497/yr
- Insurance
- −$92
- HOA
- −$0
- Vacancy / Maint / Mgmt
- −$392
- Net cashflow
- $104
Break-even live
Sensitivity live
| Price | -10% $229 | -5% $166 | +0% $104 | +5% $42 | +10% $-20 |
|---|---|---|---|---|---|
| Rent | -10% $-43 | -5% $30 | +0% $104 | +5% $178 | +10% $252 |
| Rate | -1.0pp $215 | -0.5pp $160 | base $104 | +0.5pp $47 | +1.0pp $-11 |
UW: 25.0% down · 7.5% · 30yr · 1.5% tax · 5.0% vac · 8.0% maint · 8.0% mgmt
Financing live
Cash to close
- Down payment
- $55,000
- Closing costs
- $6,600
- Reserves months
- —
- Total cash needed
- —
Loan-product check · same deal, 3 products live
Conventional
25% down · 7.5% · 30yr
- Down + closing
- —
- Monthly P&I
- —
- Monthly cashflow
- —
- DSCR
- —
- Eligible?
- —
Personal DTI + credit; lowest rate.
DSCR
20% down · 8.5% · 30yr
- Down + closing
- —
- Monthly P&I
- —
- Monthly cashflow
- —
- DSCR
- —
- Eligible?
- —
No personal income docs; deal must DSCR.
Hard money
10% down · 12.0% · 12mo
- Down + closing
- —
- Monthly P&I
- —
- Monthly cashflow
- —
- DSCR
- —
- Eligible?
- —
Short-term bridge; refi at stabilization.
Rent comps 8 comps
| Address | Beds | Baths | Sqft | Rent | $/sqft | DOM | Units | Dist |
|---|---|---|---|---|---|---|---|---|
| 282 Allan Dr Baton Rouge, LA | 3.0 | 2.0 | 1810 | $2,000 | $1.10 | 25d | 1 | 0.16mi |
| 583 Fall River Dr Baton Rouge, LA | 4.0 | 2.0 | 2050 | $2,100 | $1.02 | 16d | 1 | 0.37mi |
| 583 Fall River Dr Baton Rouge, LA | 4.0 | 2.0 | 2050 | $2,100 | $1.02 | 25d | 1 | 0.37mi |
| 532 Glenway Dr Baton Rouge, LA | 3.0 | 2.0 | 1780 | $1,950 | $1.10 | 25d | 1 | 0.56mi |
| 14443 Bywood Ave Baton Rouge, LA | 3.0 | 2.0 | 1785 | $1,900 | $1.06 | 16d | 1 | 1.18mi |
| 14823 Stoneberg Ave Baton Rouge, LA | 3.0 | 2.0 | 1769 | $1,850 | $1.05 | 45d | 1 | 1.21mi |
| 431 Gloria Dr Baton Rouge, LA | 4.0 | 2.0 | 1866 | $2,250 | $1.21 | 23d | 1 | 1.43mi |
| 431 Gloria Dr Baton Rouge, LA | 4.0 | 2.0 | 1866 | $2,250 | $1.21 | 16d | 1 | 1.43mi |
Listing history 18 events
-
2026-06-22days on market $220,000 Active 25 DOM
-
2026-06-18days on market $220,000 Active 22 DOM
-
2026-06-17days on market $220,000 Active 21 DOM
-
2026-06-16pricedays on market $220,000 Active 20 DOM
-
2026-06-15days on market $235,000 Active 19 DOM
-
2026-06-14pricedays on market $235,000 Active 17 DOM
-
2026-06-10days on market $245,000 Active 14 DOM
-
2026-06-09days on market $245,000 Active 13 DOM
-
2026-06-08days on market $245,000 Active 12 DOM
-
2026-06-07pricedays on market $245,000 Active 11 DOM
-
2026-06-05days on market $289,000 Active 8 DOM
-
2026-06-03days on market $289,000 Active 7 DOM
-
2026-06-02days on market $289,000 Active 6 DOM
-
2026-06-01days on market $289,000 Active 5 DOM
-
2026-05-31days on market $289,000 Active 4 DOM
-
2026-05-31days on market $289,000 Active 3 DOM
-
2026-05-27$289,000 Active
Show marketing remark (821 chars)
Three bedroom 2.5 bath home nestled in peaceful Sherwood Forest subdivision. Property offers huge 17 x 31 sunroom perfect for relaxing mornings or evening unwinding, convenient rear parking carport. Step inside to massive open floorplan, laminate wood flooring, built-ins, cozy brick gas logs fireplace. Kitchen offers white cabinetry with ample storage, range oven, and an electric cooktop. Just off kitchen, breakfast and dining area provides a perfect setting for entertaining family and friends. Oversized primary bathroom includes dual vanities and large walk-in closet. Outside, enjoy spacious backyard shaded by mature trees, 7 x 21 outside storage room for all your storage needs. Huge mudroom. With a little TLC, this home presents endless potential for a first-time buyer or an excellent investment opportunity.
-
2026-05-27$289,000 Active 821-char remark
Show marketing remark (821 chars)
Three bedroom 2.5 bath home nestled in peaceful Sherwood Forest subdivision. Property offers huge 17 x 31 sunroom perfect for relaxing mornings or evening unwinding, convenient rear parking carport. Step inside to massive open floorplan, laminate wood flooring, built-ins, cozy brick gas logs fireplace. Kitchen offers white cabinetry with ample storage, range oven, and an electric cooktop. Just off kitchen, breakfast and dining area provides a perfect setting for entertaining family and friends. Oversized primary bathroom includes dual vanities and large walk-in closet. Outside, enjoy spacious backyard shaded by mature trees, 7 x 21 outside storage room for all your storage needs. Huge mudroom. With a little TLC, this home presents endless potential for a first-time buyer or an excellent investment opportunity.
ⓘ Source: listings_history table (triggers on properties + properties_extension) + one-shot
backfill from property_details.listing_events for pre-trigger history.
Tax reassessment forecast LA · Resets to sale price
- Current annual tax
- $1,497 · $125/mo
- Projected year-2 tax
- $1,497 · $125/mo
- Expected delta
- $0/yr ($0/mo · 0.0%)
ⓘ Screening estimate from a state-policy table — verify with the county assessor before closing.
Climate risk First Street
- Flood 1/10 Low FEMA zone X · 0% chance over 30 yrs
- Wildfire 1/10 Low
- Heat 8/10 Severe 7 d/yr ≥108°F today · 20 d/yr by 30 yrs out
- Wind 9/10 Extreme 99% chance of damaging wind over 30 yrs
- Air quality 3/10 Moderate 3 unhealthy d/yr today · 3 by 30 yrs out
Nearby sold comps map
Loading sold comps map…
Walkable amenities ~0.75 mi
Loading nearby amenities…
Taxation est. · year 1
- Rental income
- $22,395
- − Mortgage interest
- −$12,323
- − Property taxes
- −$1,497
- − Insurance
- −$1,100
- − Repairs & maintenance
- −$1,792
- − Management
- −$1,792
- − Depreciation
- −$6,400
- Taxable loss
- −$2,509
- Est. tax savings @ 24.0%
- +$602
- After-tax cash flow
- $1,852/yr
For passive investors: Depreciation is non-cash, so a rental often shows a tax loss while cash-flowing — sheltering income. Rental losses are passive: they offset passive income freely, and up to $25,000/yr can offset ordinary (W-2) income if you actively participate and your MAGI is under $100k (phasing out to $0 by $150k); unused losses carry forward. On sale, claimed depreciation is recaptured at up to 25%, and gains may owe capital-gains tax (a 1031 exchange can defer both). Figures are a year-1 estimate at your 24.0% rate — not tax advice; consult a CPA.
Schools (NCES district)
- District
- East Baton Rouge Parish
- NCES district ID
- 2200540
- Math proficiency
- 22% ▼ -36.00%
- Reading proficiency
- 34% ▼ -31.00%
- Median HH income
- $46,263
- Composite
- 24.14/100
- National rank
- #7745
- State rank
- #47 of 98 in LA
Livability — Baton Rouge
- Score
- 74/100
- State rank
- #24
- US rank
- #4535
Category grades
Schools grade is shown separately in the Schools card above.
Census & demographics
- Census place
- Baton Rouge, LA
- County
- East Baton Rouge Parish · 399,686 people
- City population
- 351,868
- Metro
- Baton Rouge, LA
- Population (ZIP)
- 31,024
- Household income
- $59,254
- Rent vs Own
- Severe rent burden
- 1461.0
Population outlook (East Baton Rouge County) Hauer SSP2
- Today (2025)
- 464,810 people
- By 2030
- 472,137 · +1.6%
- By 2040
- 480,243 · +3.3%
- By 2050
- 484,422 · +4.2%
- By 2075
- 492,069 · +5.9%
- By 2100
- 476,347 · +2.5%
Race, ethnicity, and origin ACS 2023
- Neighborhood character
- Diverse neighborhood (Simpson 0.68)
- Race & ethnicity
- Black 48% White 25% Hispanic / Latino 16% Asian 6% Two or more races 6%
- Hispanic origin (detail)
- Mexican 2%
- Common ancestry
- Lithuanian 5% Estonian 1% Iranian 1%
- Foreign-born
- 18% · Canada, Vietnam, China
- Languages at home
- 76% English-only · Spanish 14% Vietnamese 5% Arabic 2%
Political lean MEDSL · East Baton Rouge
- 2024 margin
- D (+11.1) · D 54.5% · R 43.4% · Other 2.1%
- 2008→2024 swing
- +8.9pp toward D · 2008: 2.2pp · 2024: 11.1pp
- All cycles
- 2024: D+11.1 2020: D+13.1 2016: D+9.2 2012: D+5.2 2008: D+2.2
Not yet ingested
- Civics
- —
Market trends
- HPI YoY
- ▼ -145.28%
- Current HPI
- 181.3654
- Rent YoY
- —
- Metro
- Baton Rouge, LA
- State GDP YoY
- ▲ 3.29%
- F500 in state
- 10
Industry mix (Fortune 500 HQ in LA)
| Industry | F500 HQs | Revenue |
|---|---|---|
| Telecommunications | 2 | $23B |
|
||
| Utilities | 1 | $12B |
|
||
| Wholesale / Distribution | 1 | $5B |
|
||
| Advertising | 1 | $2B |
|
||
Price history
+0.0% since first listed2 events — show timeline
- 2026-05-27 Listed $289,000 GBRMLS
- 2026-05-27 Listed $289,000 AcadianaMLS
Property tax history
+8.1%/yrLatest (2025): $1,497 · +4.4% YoY. Source: county tax records.
Cash-flow waterfall
monthlySold comps — $/sqft
last 12 mo · ≤1 miLoading sold comps…