 Duplex
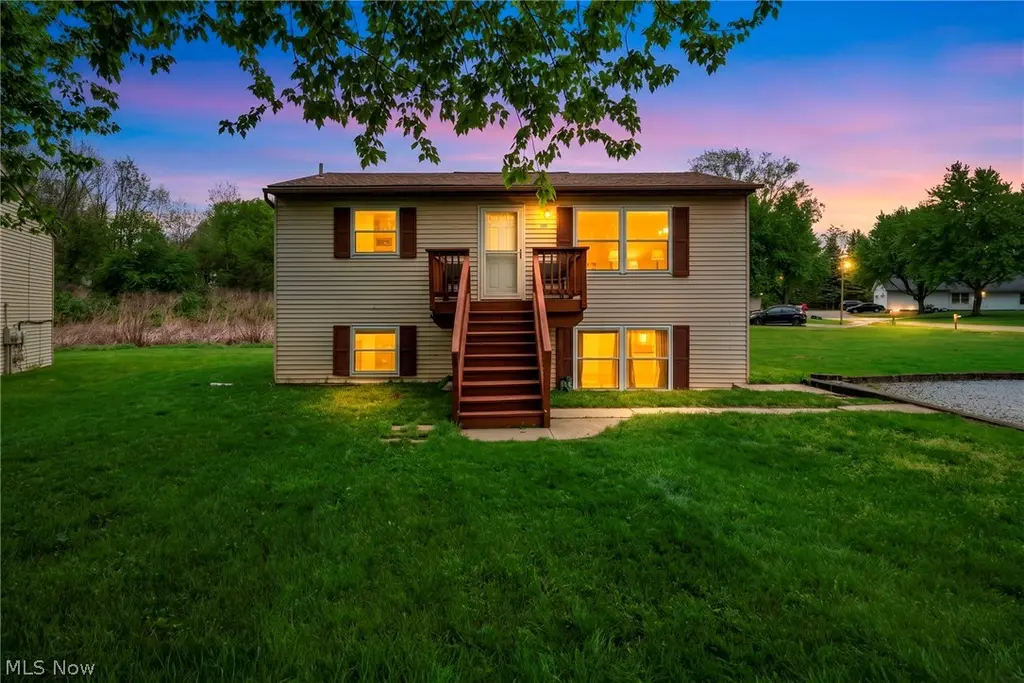
1529 Benjamin Ct · Kent, OH
Flood risk 5/10 · Moderate
- FEMA flood zone
- X (unshaded)
- Chance of flooding over 30 yrs
- 0.67%
- Est. flood insurance / yr
- $507 – $1,088
Fire risk 1/10 · Minimal
- Est. fire insurance / yr
- $713 – $1,323
Heat risk 3/10 · Minor
- Hot days now (above 97°F)
- 7 days/yr
- Hot days in 30 yrs
- 17 days/yr
Wind risk 1/10 · Minimal
- Chance of severe wind over 30 yrs
- —
Air-quality risk 2/10 · Minimal
- Unhealthy air days now
- 1 days/yr
- Unhealthy air days in 30 yrs
- 3 days/yr
Risk factors via First Street. Map © Google.
Why this score? — see what drove the B grade
The composite is a weighted blend of 9 inputs, each scored 0–100. Each bar is that input's sub-score; the figure is the points it added to the 100-point composite (weight × sub-score).
- Cash flow +30.0/30.0
- DSCR +10.0/10.0
- 1% rule +9.1/10.0
- ARV discount +7.5/15.0
- Livability +4.5/5.0
- Schools +4.3/10.0
- Rent growth +4.2/5.0
- Condition / age +2.2/5.0
- Appreciation +0.0/10.0
$215,000
🖨 Deal sheet 📄 Offer letter ✓ Due diligence
Multi-family units
County records classify this as Multi-Family (2-4 Unit). Listing-text estimate: 2 units. confirmed
Listing remarks MLS
Great investment opportunity minutes away from Kent State University, downtown, restaurants, shopping, entertainment, and more! Add this to your investment portfolio or purchase to live in one unit and rent out the other. With this location, the choice is yours. Solid rental history. Newer roof, windows, and carpet. Each unit has 2 bedrooms and 1 bathroom. Nice open floor plan. Located on a cul-de-sac. Call for a showing today.
Key facts
- Ample outdoor space
- Up down duplex
- Recent updates
Tags
Property features AI
Finance
- Financial info: Owner pays exterior maintenance, grounds care, snow removal, and water; Tenant pays electricity and internet
Exterior
- Parking: Driveway parking
- Utilities: Public water; Public sewer
- Home design: 2-story property; Above-grade finished area about 1,632 (per assessor); Asphalt roof
- Construction: Year built per public records; Asphalt roof
- Exterior features: Driveway; Lot approximately 0.24 acres
Interior
- Bathrooms: 2 full bathrooms
- Heating & cooling: Baseboard heating; Wall/window cooling units
- Interior features: Two stories
Neighborhood map
What this means for you Summary
Snapshot
- This is a 2 × 2-bed/1.0-bath units multifamily listed at $215k. Condition is rated fair.
Deal economics
- At list price, monthly cash flow is $902 ($11k/yr) — positive. Per door: $451/mo.
- The deal already cash-flows at list — no discount required.
- Meets the 1% rule at list price ($3k rent vs $215k).
- Cap rate 11.3% vs local median 4.1% in Kent — top-decile yield for the area; either an underpriced asset or a hidden risk that comps aren't pricing in. Stress-test before assuming the spread holds.
Location & tenants
- Location reads 89/100 on livability (#13 in OH, #129 nationally) — a professional / high-income tenant draw. Strengths: amenities A+, commute A+, cost of living A+; Watch: employment F.
- Kent City (suburban): math 46% / reading 58% proficiency, ranked #433 of 656 in OH (top 66%) — acceptable for families but not a draw, mixed tenant base, ~2y average lease.
- Market conditions: Rents rising fast (+6.8%/yr); 139 active listings in the ZIP; 4 comparable units currently listed for rent nearby; rentals lingering (median 44d on market — plan ~5-8 weeks vacancy on turnover, expect pricing pressure); 75% of comp listings sitting > 30 days — soft ceiling on asking rent; 196 units permitted in Portage County in 2024 (10 in 5+ unit buildings).
- At $3,022/mo this rent would consume 63% of the median local household income ($58k/yr) (locally 2634% of renters already pay >50% of income on rent) — very limited rent-growth headroom before tenants either downsize or default.
Forward outlook
- Local home prices are declining (-3.0%/yr); year-one equity from $1k of loan paydown is wiped out by about $6k of value loss. Plan a longer hold.
- At projected returns (-3.0% appreciation + 6.8% rent growth), your $60k cash investment doubles in ~6 years — after that, you're playing with house money.
Negotiation context
- Only 7 days on market — expect competitive offers; lowballing is unlikely to land.
- 12 sale attempts since 24y ago with the ask held roughly flat each time — persistent listings suggest the price (not the market) is what's stuck; bring a comps-based counter.
- Current owner paid $106k; list at $215k implies a 102% gain — meaningful room to come down on a strong offer.
Risks & watch-outs
- Climate carrying-cost: moderate flood risk — expect insurance premiums to compound above CPI over the hold.
Questions for the listing agent
- Can we see the unit-by-unit rent roll, current vacancy, and any below-market leases? What's the average tenancy length?
- What capital expenditures (roof, boiler, parking lot, exteriors) have been made in the last 5 years, and what's planned in the next 2?
- Have any recent inspections been done? Can we get a copy of the seller's disclosures and any deferred-maintenance estimates?
- Built in 1978 — when were the roof, HVAC, electrical panel, plumbing, and water heater last replaced?
- Is there a deadline driving the sale (1031 exchange, divorce, estate, relocation)? That informs how much negotiation room exists.
- Schools are A-rated — typically a magnet for longer-tenancy family renters. What's the average tenant stay here, and is there a school-zone premium baked into asking?
- What's the average days-on-market for RENTAL listings here right now (not sales)? A rising rental-DOM trend means longer vacancies and softer asking-rent achievability than the comps imply.
- What's the recent tenant-quality profile in this submarket — average credit score on applications, eviction rate, late-payment / NSF rate, and stable-employment percentage? A property-management company in the area should have these aggregated.
- How much new apartment / multifamily construction is in the pipeline within 1–3 miles? Heavy new supply (>2% of stock underway) typically softens rents 12–24 months out; light construction supports rent growth.
Investment metrics
- 1% rule
- 1.41% ✓
- Cap rate
- 11.32%
- Cash-on-cash
- 17.97%
- DSCR
- 1.80
- GRM
- 5.9
CMA / ARV
- ARV (on-the-fly)
- $135,456
- Comps found
- 2
Show comp detail 2 sales within ~0.75 mi
| Address | Dist | Beds/Ba | Sqft | Sold | Price | $/sf | Match |
|---|---|---|---|---|---|---|---|
| 346 Harris St | 0.44mi | 5/2.0 (+1) | 1,792 (+10%) | 6mo | $148,000 | $83 | 54 |
| 430 W Elm St | 0.60mi | 4/2.0 | 1,804 (+10%) | 8mo | $95,000 | $53 | 48 |
Match score weights: distance 35% · size 25% · config 20% · recency 20%. Top-matched comps best support the ARV.
Projected returns pro-forma
-3.0% appreciation · 6.8% rent growth · sell at horizon
- IRR
- 13.8%
- Equity multiple
- 1.58×
- Total profit
- $34,622
- Equity at exit
- $32,057
- IRR
- 25.3%
- Equity multiple
- 3.62×
- Total profit
- $157,506
- Equity at exit
- $18,589
Cash invested: $60,200 (down + closing). Projections, not guarantees.
Landlord ↔ Tenant lean methodology
- Overall (STATE)
- 73 Landlord-Friendly
- State Ohio
- 73 Landlord-Friendly · R+6
- County
- — inherits STATE
- City
- — inherits STATE
ZIP-level market 44240
- Rents YoY
- 6.8%
- Active inventory
- 139
- Price-to-rent
- 11.9×
Monthly cashflow live
- Estimated rent
- $3,022 medium interval (Pro) →
- Mortgage (P&I)
- −$1,127
- Tax est. 1.5%
- −$269 /mo · $3,225/yr
- Insurance
- −$90
- HOA
- −$0
- Vacancy / Maint / Mgmt
- −$635
- Net cashflow
- $902
Break-even live
2-unit breakdown (identical units grouped — click to expand)
| Units | Beds | Baths | Est. rent |
|---|---|---|---|
| 2× units | 2 | 1 | $3,022 |
| #1 | 2 | 1 | $1,511 |
| #2 | 2 | 1 | $1,511 |
| Total (2 units) | $3,022 | ||
UW: 25.0% down · 7.5% · 30yr · 1.5% tax · 5.0% vac · 8.0% maint · 8.0% mgmt
Financing live
Cash to close
- Down payment
- $53,750
- Closing costs
- $6,450
- Reserves months
- —
- Total cash needed
- —
Loan-product check · same deal, 3 products live
Conventional
25% down · 7.5% · 30yr
- Down + closing
- —
- Monthly P&I
- —
- Monthly cashflow
- —
- DSCR
- —
- Eligible?
- —
Personal DTI + credit; lowest rate.
DSCR
20% down · 8.5% · 30yr
- Down + closing
- —
- Monthly P&I
- —
- Monthly cashflow
- —
- DSCR
- —
- Eligible?
- —
No personal income docs; deal must DSCR.
Hard money
10% down · 12.0% · 12mo
- Down + closing
- —
- Monthly P&I
- —
- Monthly cashflow
- —
- DSCR
- —
- Eligible?
- —
Short-term bridge; refi at stabilization.
Rent comps 4 comps
| Address | Beds | Baths | Sqft | Rent | $/sqft | DOM | Units | Dist |
|---|---|---|---|---|---|---|---|---|
| 356 Cherry St Unit NA Kent, OH | 3.0 | 1.5 | 1175 | $1,900 | $1.62 | 43d | 1 | 0.37mi |
| 213 Dodge St Unit 1 Kent, OH | 3.0 | 1.0 | 1100 | $1,400 | $1.27 | 43d | 1 | 0.47mi |
| 1204 Middlebury Rd Kent, OH | 3.0 | 2.0 | 1120 | $1,900 | $1.70 | 14d | 1 | 1.31mi |
| 129 Sherman St Kent, OH | 4.0 | 2.0 | 1246 | $2,500 | $2.01 | 43d | 1 | 1.36mi |
Listing history 32 events
-
2026-05-15status Pending
-
2026-05-08$215,000 Active
-
2019-09-26soldstatus $106,500 Closed 431-char remark
Show marketing remark (431 chars)
Great investment opportunity minutes away from Kent State University, downtown, restaurants, shopping, entertainment, and more! Add this to your investment portfolio or purchase to live in one unit and rent out the other. With this location, the choice is yours. Solid rental history. Newer roof, windows, and carpet. Each unit has 2 bedrooms and 1 bathroom. Nice open floor plan. Located on a cul-de-sac. Call for a showing today.
-
2019-09-23status Pending 431-char remark
Show marketing remark (431 chars)
Great investment opportunity minutes away from Kent State University, downtown, restaurants, shopping, entertainment, and more! Add this to your investment portfolio or purchase to live in one unit and rent out the other. With this location, the choice is yours. Solid rental history. Newer roof, windows, and carpet. Each unit has 2 bedrooms and 1 bathroom. Nice open floor plan. Located on a cul-de-sac. Call for a showing today.
-
2019-09-22historical 431-char remark
Show marketing remark (431 chars)
Great investment opportunity minutes away from Kent State University, downtown, restaurants, shopping, entertainment, and more! Add this to your investment portfolio or purchase to live in one unit and rent out the other. With this location, the choice is yours. Solid rental history. Newer roof, windows, and carpet. Each unit has 2 bedrooms and 1 bathroom. Nice open floor plan. Located on a cul-de-sac. Call for a showing today.
-
2019-08-22historical Contingent 431-char remark
Show marketing remark (431 chars)
Great investment opportunity minutes away from Kent State University, downtown, restaurants, shopping, entertainment, and more! Add this to your investment portfolio or purchase to live in one unit and rent out the other. With this location, the choice is yours. Solid rental history. Newer roof, windows, and carpet. Each unit has 2 bedrooms and 1 bathroom. Nice open floor plan. Located on a cul-de-sac. Call for a showing today.
-
2019-08-13price $105,000 431-char remark
Show marketing remark (431 chars)
Great investment opportunity minutes away from Kent State University, downtown, restaurants, shopping, entertainment, and more! Add this to your investment portfolio or purchase to live in one unit and rent out the other. With this location, the choice is yours. Solid rental history. Newer roof, windows, and carpet. Each unit has 2 bedrooms and 1 bathroom. Nice open floor plan. Located on a cul-de-sac. Call for a showing today.
-
2019-06-20price $115,000 431-char remark
Show marketing remark (431 chars)
Great investment opportunity minutes away from Kent State University, downtown, restaurants, shopping, entertainment, and more! Add this to your investment portfolio or purchase to live in one unit and rent out the other. With this location, the choice is yours. Solid rental history. Newer roof, windows, and carpet. Each unit has 2 bedrooms and 1 bathroom. Nice open floor plan. Located on a cul-de-sac. Call for a showing today.
-
2019-05-22$130,000 Active 431-char remark
Show marketing remark (431 chars)
Great investment opportunity minutes away from Kent State University, downtown, restaurants, shopping, entertainment, and more! Add this to your investment portfolio or purchase to live in one unit and rent out the other. With this location, the choice is yours. Solid rental history. Newer roof, windows, and carpet. Each unit has 2 bedrooms and 1 bathroom. Nice open floor plan. Located on a cul-de-sac. Call for a showing today.
-
2018-12-30historical
-
2018-12-11$119,900 Active
-
2018-12-06price $124,900
-
2018-12-06status Active
-
2018-12-03historical
-
2018-12-03historical
-
2018-10-30price $129,900
-
2018-10-09$135,000 Active
-
2015-01-09soldstatus $86,000
-
2014-10-28historical
-
2014-07-28$89,900
-
2013-08-12historical
-
2013-06-24$99,900
-
2011-03-02historical
-
2010-09-02$111,900
-
2008-02-13soldstatus $118,000
-
2007-09-21$124,000
-
2003-02-28soldstatus $108,000
-
2003-01-20$113,900
-
2003-01-19historical
-
2002-10-18historical
-
2002-10-18$113,900
-
2002-07-18$115,500
ⓘ Source: listings_history table (triggers on properties + properties_extension) + one-shot
backfill from property_details.listing_events for pre-trigger history.
Climate risk First Street
- Flood 5/10 Major FEMA zone X (unshaded) · 67% chance over 30 yrs
- Wildfire 1/10 Low
- Heat 3/10 Moderate 7 d/yr ≥97°F today · 17 d/yr by 30 yrs out
- Wind 1/10 Low
- Air quality 2/10 Low 1 unhealthy d/yr today · 3 by 30 yrs out
Nearby sold comps map
Loading sold comps map…
Walkable amenities ~0.75 mi
Loading nearby amenities…
Taxation est. · year 1
- Rental income
- $36,264
- − Mortgage interest
- −$12,043
- − Property taxes
- −$3,225
- − Insurance
- −$1,075
- − Repairs & maintenance
- −$2,901
- − Management
- −$2,901
- − Depreciation
- −$6,255
- Taxable income
- $7,864
- Est. tax owed @ 24.0%
- −$1,887
- After-tax cash flow
- $8,931/yr
For passive investors: Depreciation is non-cash, so a rental often shows a tax loss while cash-flowing — sheltering income. Rental losses are passive: they offset passive income freely, and up to $25,000/yr can offset ordinary (W-2) income if you actively participate and your MAGI is under $100k (phasing out to $0 by $150k); unused losses carry forward. On sale, claimed depreciation is recaptured at up to 25%, and gains may owe capital-gains tax (a 1031 exchange can defer both). Figures are a year-1 estimate at your 24.0% rate — not tax advice; consult a CPA.
Condition & rehab AI · 12 photos
This multi-family home requires moderate repairs and maintenance to improve its condition and value. Key areas for improvement include the kitchen, bathrooms, exterior siding, and flooring. Fresh paint and new appliances would significantly enhance its curb appeal and interior aesthetics.
Repairs flagged
- Major Kitchen appliances — Old and worn
- Major Bathroom fixtures — Signs of wear
- Moderate Exterior siding — Weathered
- Moderate Carpeted flooring — Worn
Value-add opportunities
- Both Paint interior walls — Fresh paint enhances curb appeal and interior aesthetics
- Both Replace kitchen appliances — Modern appliances improve functionality and attract potential buyers
- Both Replace bathroom fixtures — New fixtures improve functionality and attract potential buyers
- Both Replace exterior siding — Fresh siding enhances curb appeal and improves home's value
- Both Replace carpeted flooring — New flooring improves comfort and aesthetics
Renovation cost estimate screening
| Repair item | Severity | Est. cost |
|---|---|---|
| Kitchen appliances · Old and worn | Major | $15,000–50,000 |
| Bathroom fixtures · Signs of wear | Major | $15,000–50,000 |
| Exterior siding · Weathered | Moderate | $3,000–15,000 |
| Carpeted flooring · Worn | Moderate | $3,000–15,000 |
| Total estimated repair cost · 4 items | $36,000–130,000 |
Value-add ROI direction
- Both Paint interior walls — Fresh paint enhances curb appeal and interior aesthetics ↑
- Both Replace kitchen appliances — Modern appliances improve functionality and attract potential buyers ↑
- Both Replace bathroom fixtures — New fixtures improve functionality and attract potential buyers ↑
- Both Replace exterior siding — Fresh siding enhances curb appeal and improves home's value ↑
- Both Replace carpeted flooring — New flooring improves comfort and aesthetics ↑
ⓘ Cost ranges are severity-bucket heuristics (US national rule-of-thumb). Get contractor quotes + a written scope before underwriting a rehab budget.
Schools (NCES district)
- District
- Kent City
- NCES district ID
- 3904416
- Math proficiency
- 46% ▼ -23.00%
- Reading proficiency
- 58% ▼ -15.00%
- Median HH income
- $36,095
- Composite
- 43.07/100
- National rank
- #3092
- State rank
- #433 of 656 in OH
Livability — Kent
- Score
- 89/100
- State rank
- #13
- US rank
- #129
Category grades
Schools grade is shown separately in the Schools card above.
Census & demographics
- Census place
- Kent, OH
- County
- Portage County · 70,400 people
- City population
- 37,788
- Metro
- Akron, OH
- Population (ZIP)
- 37,788
- Household income
- $57,627
- Rent vs Own
- Severe rent burden
- 2634.0
Population outlook (Portage County) Hauer SSP2
- Today (2025)
- 166,109 people
- By 2030
- 167,752 · +1.0%
- By 2040
- 168,640 · +1.5%
- By 2050
- 167,469 · +0.8%
- By 2075
- 170,131 · +2.4%
- By 2100
- 167,958 · +1.1%
Race, ethnicity, and origin ACS 2023
- Neighborhood character
- Predominantly White (83%)
- Race & ethnicity
- White 83% Two or more races 6% Black 6% Asian 4% Hispanic / Latino 3%
- Common ancestry
- Romanian 7% Slovak 2% Italian 2%
- Foreign-born
- 7% · Canada, China
- Languages at home
- 92% English-only · Other Indo-European 2% Arabic 2% Other Asian/Pacific 1%
Political lean MEDSL · Portage
- 2024 margin
- R (+15.5) · D 41.8% · R 57.3%
- 2008→2024 swing
- -24.5pp toward R · 2008: 9.0pp · 2024: -15.5pp
- All cycles
- 2024: R+15.5 2020: R+12.5 2016: R+10.2 2012: D+4.9 2008: D+9.0
Not yet ingested
- Civics
- —
Market trends
- HPI YoY
- ▼ -162.04%
- Current HPI
- 189.3174
- Rent YoY
- ▲ 6.80%
- Metro
- Akron, OH
- State GDP YoY
- ▲ 1.98%
- F500 in state
- 48
Industry mix (Fortune 500 HQ in OH)
| Industry | F500 HQs | Revenue |
|---|---|---|
| Insurance | 3 | $145B |
|
||
| Industrial Machinery | 3 | $49B |
|
||
| Financial Services | 3 | $24B |
|
||
| Consumer Goods | 2 | $93B |
|
||
| Aerospace / Defense | 2 | $47B |
|
||
| Utilities | 2 | $33B |
|
||
Price history
+86.1% since first listed32 events — show timeline
- 2026-05-15 Pending — MLSNOW
- 2026-05-08 Listed $215,000 MLSNOW
- 2019-09-26 Sold (MLS) $106,500 MLSNOW
- 2019-09-23 Pending — MLSNOW
- 2019-09-22 Listing Removed — MLSNOW
- 2019-08-22 Contingent — MLSNOW
- 2019-08-13 Price Changed $105,000 MLSNOW
- 2019-06-20 Price Changed $115,000 MLSNOW
- 2019-05-22 Listed $130,000 MLSNOW
- 2018-12-30 Listing Removed — MLSNOW
- 2018-12-11 Listed $119,900 MLSNOW
- 2018-12-06 Price Changed $124,900 MLSNOW
- 2018-12-06 Relisted — MLSNOW
- 2018-12-03 Listing Removed — MLSNOW
- 2018-12-03 Listing Removed — MLSNOW
- 2018-10-30 Price Changed $129,900 MLSNOW
- 2018-10-09 Listed $135,000 MLSNOW
- 2015-01-09 Sold (MLS) $86,000 MLSNOW
- 2014-10-28 Listing Removed — MLSNOW
- 2014-07-28 Listed $89,900 MLSNOW
- 2013-08-12 Listing Removed — MLSNOW
- 2013-06-24 Listed $99,900 MLSNOW
- 2011-03-02 Listing Removed — MLSNOW
- 2010-09-02 Listed $111,900 MLSNOW
- 2008-02-13 Sold (MLS) $118,000 MLSNOW
- 2007-09-21 Listed $124,000 MLSNOW
- 2003-02-28 Sold (MLS) $108,000 MLSNOW
- 2003-01-20 Listed $113,900 MLSNOW
- 2003-01-19 Listing Removed — MLSNOW
- 2002-10-18 Listed $113,900 MLSNOW
- 2002-10-18 Listing Removed — MLSNOW
- 2002-07-18 Listed $115,500 MLSNOW
Cash-flow waterfall
monthlySold comps — $/sqft
last 12 mo · ≤1 miLoading sold comps…