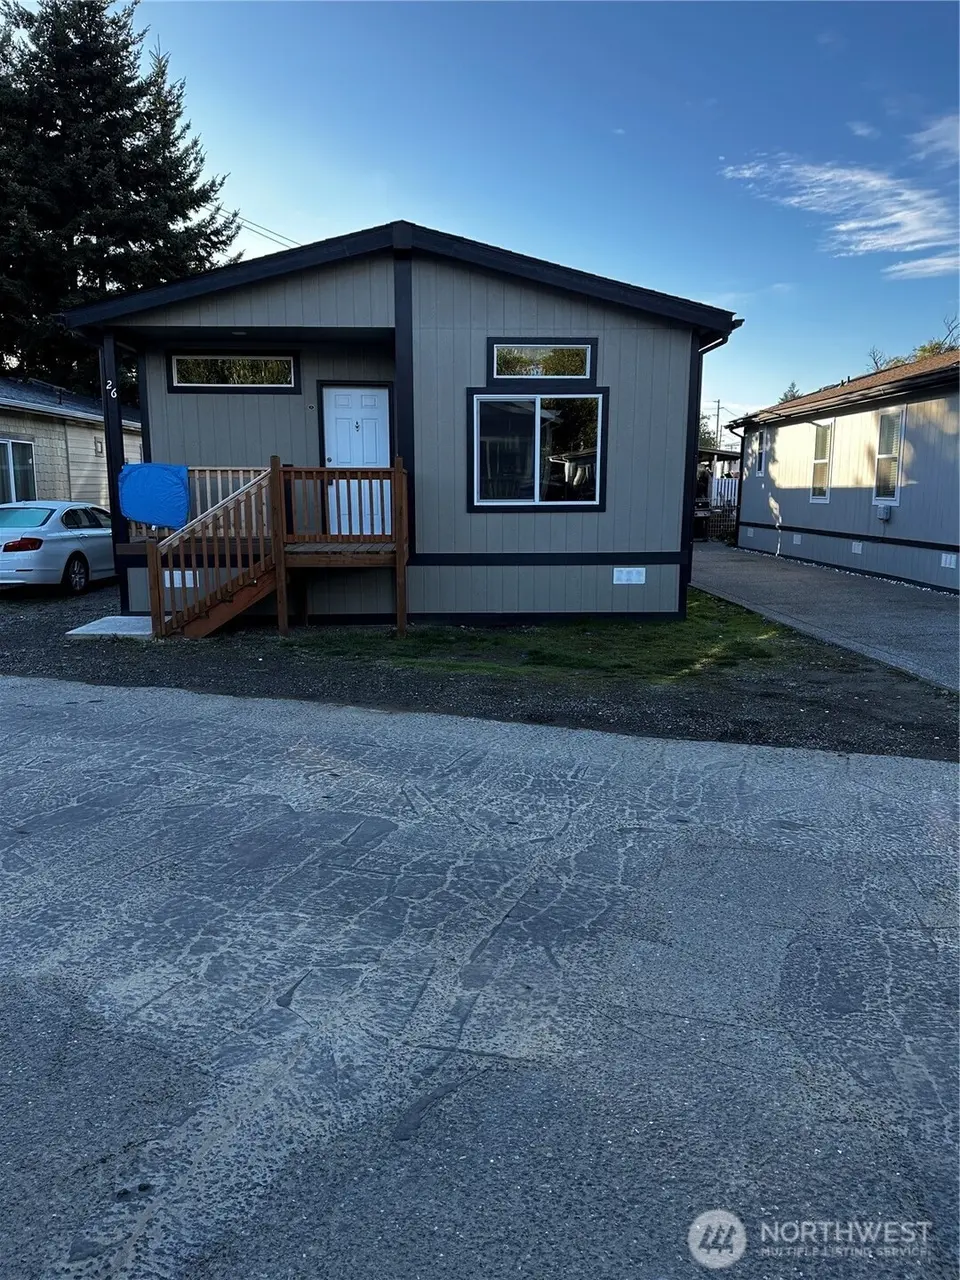
10302 LAKEVIEW Ave SW #26 · Lakewood, WA
Flood risk 5/10 · Moderate
- FEMA flood zone
- X (unshaded)
- Chance of flooding over 30 yrs
- 0.64%
- Est. flood insurance / yr
- $507 – $1,088
Fire risk 1/10 · Minimal
- Est. fire insurance / yr
- $604 – $1,122
Heat risk 3/10 · Minor
- Hot days now (above 86°F)
- 7 days/yr
- Hot days in 30 yrs
- 14 days/yr
Wind risk 1/10 · Minimal
- Chance of severe wind over 30 yrs
- —
Air-quality risk 7/10 · Major
- Unhealthy air days now
- 11 days/yr
- Unhealthy air days in 30 yrs
- 12 days/yr
Risk factors via First Street. Map © Google.
Why this score? — see what drove the B- grade
The composite is a weighted blend of 9 inputs, each scored 0–100. Each bar is that input's sub-score; the figure is the points it added to the 100-point composite (weight × sub-score).
- Cash flow +29.5/30.0
- DSCR +10.0/10.0
- 1% rule +8.3/10.0
- ARV discount +7.5/15.0
- Schools +4.0/10.0
- Livability +3.7/5.0
- Rent growth +3.2/5.0
- Condition / age +2.5/5.0
- Appreciation +0.0/10.0
$147,950
🖨 Deal sheet (PDF) 📄 Offer letter ✓ Due diligence
Listing remarks
This beautiful NEW 3 bedroom & 1.75 bath Manufactured Home that sports many upgrades and features just to name of few of them: A beautiful front porch & decking, engineered laminate flooring t/o, new electric furnace, refer, & range, Washer & Dryer, new hot water heater, dual paned vinyl windows t/o, exterior siding, upgraded insulations for additional cost savings, all new appliances, DW, farm sink, tape-n-texture t/o, kitchen island, wood cabinets, new fixtures & lighting, new interior & exterior paint, new tub/shower comb, 60" shower, new steel front & back door, utility/laundry Room with w & d included. 2 x 6 walls - Great neighborhood
Key facts
- Upgraded insulations
- Front porch
- Electric furnace
Tags
Neighborhood map
What this means for you Summary
Snapshot
- This is a 3-bed/1.0-bath manufactured listed at $148k.
Deal economics
- At list price, monthly cash flow is $529 ($6k/yr) — positive.
- The deal already cash-flows at list — no discount required.
- Meets the 1% rule at list price ($2k rent vs $148k).
- Recommended offer: $130k (12.0% below list) — sets the bar for market timing.
- Cap rate 10.6% vs local median 2.6% in Lakewood — top-decile yield for the area; either an underpriced asset or a hidden risk that comps aren't pricing in. Stress-test before assuming the spread holds.
Location & tenants
- Location reads 74/100 on livability (#182 in WA, #4,754 nationally) — a middle-class / working-renter tenant base. Strengths: commute A+, health & safety A+, housing A-; Watch: cost of living D, crime F.
- Clover Park School District (urban): math 39% / reading 51% proficiency, ranked #190 of 291 in WA (top 65%) — families likely to look elsewhere, expect single-tenant / working-renter base with shorter leases.
- Zoned schools: Lakeview Hope Academy (534 students, 84% FRL); Lochburn Middle School (510 students, 85% FRL); Clover Park High School (1,315 students, 84% FRL) — zoned schools average 84% FRL vs 52% district-wide (32 pts higher); higher-poverty schools than district average — tighter screening recommended.
- Market conditions: Rents rising (+3.0%/yr); 130 active listings in the ZIP; 21 comparable units currently listed for rent nearby; rentals leasing fast (median 4d on market — plan ~1-2 weeks tenant-placement turnaround); 3,209 units permitted in Pierce County in 2024 (1,269 in 5+ unit buildings).
- This rent runs 35% of the median local income ($67k/yr) — at the standard rent-burdened threshold; future hikes will face affordability resistance.
Forward outlook
- Local home prices are declining (-3.0%/yr); year-one equity from $1k of loan paydown is wiped out by about $4k of value loss. Plan a longer hold.
- Pierce County population projected at +26% by 2050 — long-run rental-demand tailwind backs the buy-and-hold thesis.
- At projected returns (-3.0% appreciation + 3.0% rent growth), your $41k cash investment doubles in ~8 years — after that, you're playing with house money.
Negotiation context
- It's been on market 248 days — a 12% lower offer ($130k) is reasonable based on typical stale-listing flexibility.
- 2 sale attempts since 23y ago; this cycle's ask has dropped $17k (10%) from the opening price — seller is motivated, your offer sets the floor, not the list.
- Current owner paid $5k; list at $148k implies a 2859% gain — meaningful room to come down on a strong offer.
Risks & watch-outs
- Climate carrying-cost: moderate flood risk — expect insurance premiums to compound above CPI over the hold.
Questions for the listing agent
- It's been on market 248 days. Have you received any prior offers? Is the seller open to a 12% concession, seller financing, or rate buy-down credit?
- Why hasn't it sold? Are there any deal-killer items the seller is aware of (foundation, flood, title, zoning, code violations)?
- Is there a deadline driving the sale (1031 exchange, divorce, estate, relocation)? That informs how much negotiation room exists.
- Crime grade is F in this area — have there been break-ins, vandalism, or insurance claims at this property in the last 3 years? What carrier currently insures it and at what premium?
- What's the average days-on-market for RENTAL listings here right now (not sales)? A rising rental-DOM trend means longer vacancies and softer asking-rent achievability than the comps imply.
- What's the recent tenant-quality profile in this submarket — average credit score on applications, eviction rate, late-payment / NSF rate, and stable-employment percentage? A property-management company in the area should have these aggregated.
- How much new for-sale + rental construction is in the pipeline within 1–3 miles? Heavy new supply typically softens prices + rents 12–24 months out; constrained supply supports both.
Investment metrics
- 1% rule
- 1.33% ✓
- Cap rate
- 10.59%
- Cash-on-cash
- 15.33%
- DSCR
- 1.68
- GRM
- 6.3
CMA / ARV
- ARV (median comp)
- $75,000
- List price
- $147,950
- Delta
- 97.27%
- Verdict
- OVERPRICED
- Comps
- 3 within 1.0 mi
Show comp detail 1 sale within ~0.75 mi
| Address | Dist | Beds/Ba | Sqft | Sold | Price | $/sf | Match |
|---|---|---|---|---|---|---|---|
| 10302 Lakeview Ave SW #35 | 0.04mi | 2/1.0 (-1) | 672 (0%) | 9mo | $40,000 | $60 | 86 |
Match score weights: distance 35% · size 25% · config 20% · recency 20%. Top-matched comps best support the ARV.
Projected returns pro-forma
-3.0% appreciation · 3.0% rent growth · sell at horizon
- IRR
- 6.1%
- Equity multiple
- 1.24×
- Total profit
- $9,769
- Equity at exit
- $22,060
- IRR
- 15.5%
- Equity multiple
- 2.26×
- Total profit
- $52,038
- Equity at exit
- $12,792
Cash invested: $41,426 (down + closing). Projections, not guarantees.
Landlord ↔ Tenant lean methodology
- Overall (STATE)
- 28 Tenant-Leaning
- State Washington
- 28 Tenant-Leaning · D+8
- County
- — inherits STATE
- City
- — inherits STATE
ZIP-level market 98499
- Rents YoY
- 3.0%
- Active inventory
- 130
- Price-to-rent
- 6.3×
Monthly cashflow live
- Estimated rent
- $1,964 high interval (Pro) →
- Mortgage (P&I)
- −$776
- Tax est. 1.5%
- −$185 /mo · $2,219/yr
- Insurance
- −$62
- HOA
- −$0
- Vacancy / Maint / Mgmt
- −$412
- Net cashflow
- $529
Break-even live
Sensitivity live
| Price | -10% $632 | -5% $580 | +0% $529 | +5% $478 | +10% $427 |
|---|---|---|---|---|---|
| Rent | -10% $374 | -5% $452 | +0% $529 | +5% $607 | +10% $685 |
| Rate | -1.0pp $604 | -0.5pp $567 | base $529 | +0.5pp $491 | +1.0pp $452 |
UW: 25.0% down · 7.5% · 30yr · 1.5% tax · 5.0% vac · 8.0% maint · 8.0% mgmt
Financing live
Cash to close
- Down payment
- $36,988
- Closing costs
- $4,438
- Reserves months
- —
- Total cash needed
- —
Loan-product check · same deal, 3 products live
Conventional
25% down · 7.5% · 30yr
- Down + closing
- —
- Monthly P&I
- —
- Monthly cashflow
- —
- DSCR
- —
- Eligible?
- —
Personal DTI + credit; lowest rate.
DSCR
20% down · 8.5% · 30yr
- Down + closing
- —
- Monthly P&I
- —
- Monthly cashflow
- —
- DSCR
- —
- Eligible?
- —
No personal income docs; deal must DSCR.
Hard money
10% down · 12.0% · 12mo
- Down + closing
- —
- Monthly P&I
- —
- Monthly cashflow
- —
- DSCR
- —
- Eligible?
- —
Short-term bridge; refi at stabilization.
Rent comps 21 comps
| Address | Beds | Baths | Sqft | Rent | $/sqft | DOM | Units | Dist |
|---|---|---|---|---|---|---|---|---|
| 4910 108th St SW Tacoma, WA | 1.0–2.0 | 1.0 | 700 | $1,275 | $1.82 | 0d | 4 | 0.47mi |
| 11204 Kendrick St SW Lakewood, WA | 1.0–4.0 | 1.0–2.0 | 1051 | $2,072 | $1.97 | 0d | 21 | 0.54mi |
| 11419 Kendrick St SW Lakewood, WA | 3.0 | 1.0–2.0 | 688 | $2,325 | $3.38 | 0d | 4 | 0.59mi |
| 5419 110th St SW Lakewood, WA | 1.0–3.0 | 1.0–2.0 | 852 | $2,053 | $2.41 | 45d | 1 | 0.75mi |
| 3411 92nd St S Unit 15 Lakewood, WA | 2.0 | 1.0 | 700 | $1,595 | $2.28 | 25d | 1 | 1.00mi |
| 3407-3411 92nd St S Unit 17 Lakewood, WA | 2.0 | 1.0 | 700 | $1,395 | $1.99 | 25d | 1 | 1.01mi |
| 3407-3411 92nd St S Unit 17 Lakewood, WA | 2.0 | 1.0 | 700 | $1,395 | $1.99 | 0d | 1 | 1.01mi |
| 9100 Lakewood Dr SW Lakewood, WA | 1.0–3.0 | 1.0–2.0 | 865 | $2,300 | $2.66 | 45d | 1 | 1.08mi |
| 9501 59th Ave SW Lakewood, WA | 1.0–3.0 | 1.0–2.0 | 917 | $2,585 | $2.82 | 0d | 39 | 1.10mi |
| 5101 88th Street Ct SW Lakewood, WA | 3.0 | 1.0–2.0 | 832 | $2,600 | $3.12 | 3d | 16 | 1.10mi |
| 8931 Gravelly Lake Dr SW Lakewood, WA | 1.0–2.0 | 1.0–2.0 | 635 | $2,095 | $3.30 | 4d | 4 | 1.14mi |
| 8920 Gravelly Lake Dr SW Lakewood, WA | 3.0 | 1.0–2.0 | 688 | $2,349 | $3.41 | 3d | 15 | 1.17mi |
| 3102 92nd St S Unit 3104 Lakewood, WA | 2.0 | 1.0 | 708 | $1,497 | $2.11 | 23d | 1 | 1.18mi |
| 6102 Lake Grove St SW Lakewood, WA | 2.0 | 1.0 | 569 | $1,870 | $3.29 | 0d | 6 | 1.18mi |
| 10102 Sales Rd S Lakewood, WA | 2.0 | 1.0–1.5 | 596 | $1,550 | $2.60 | 45d | 26 | 1.19mi |
| 4828 123rd St SW Lakewood, WA | 1.0–2.0 | 1.0–2.0 | 848 | $1,995 | $2.35 | 4d | 4 | 1.30mi |
| 2425 S 96th St Tacoma, WA | 1.0–2.0 | 1.0 | 850 | $1,225 | $1.44 | 0d | 14 | 1.35mi |
| 2201 104th St S Tacoma, WA | 1.0–3.0 | 1.0–2.0 | 929 | $2,500 | $2.69 | 0d | 19 | 1.36mi |
| 8720 58th Ave SW Lakewood, WA | 1.0–3.0 | 1.0–2.0 | 897 | $2,275 | $2.53 | 6d | 1 | 1.40mi |
| 12535 Bridgeport Way SW Lakewood, WA | 2.0 | 1.0–2.0 | 850 | $2,437 | $2.87 | 0d | 25 | 1.41mi |
| 2100 112th St S Tacoma, WA | 1.0–2.0 | 1.0 | 660 | $1,600 | $2.42 | 6d | 4 | 1.45mi |
Listing history 20 events
-
2026-06-21days on market $147,950 Active 248 DOM
-
2026-06-18days on market $147,950 Active 245 DOM
-
2026-06-17days on market $147,950 Active 244 DOM
-
2026-06-16days on market $147,950 Active 243 DOM
-
2026-06-15days on market $147,950 Active 242 DOM
-
2026-06-13days on market $147,950 Active 240 DOM
-
2026-06-09days on market $147,950 Active 236 DOM
-
2026-06-08days on market $147,950 Active 235 DOM
-
2026-06-07days on market $147,950 Active 234 DOM
-
2026-06-04days on market $147,950 Active 231 DOM
-
2026-06-03days on market $147,950 Active 230 DOM
-
2026-06-02days on market $147,950 Active 229 DOM
-
2026-06-01days on market $147,950 Active 228 DOM
-
2026-05-31days on market $147,950 Active 227 DOM
-
2026-04-08price $147,950
-
2025-12-09price $149,950
-
2025-11-20price $159,950
-
2025-10-16$164,950 Active
-
2003-09-04soldstatus $5,000
-
2003-07-08$5,500
ⓘ Source: listings_history table (triggers on properties + properties_extension) + one-shot
backfill from property_details.listing_events for pre-trigger history.
Climate risk First Street
- Flood 5/10 Major FEMA zone X (unshaded) · 64% chance over 30 yrs
- Wildfire 1/10 Low
- Heat 3/10 Moderate 7 d/yr ≥86°F today · 14 d/yr by 30 yrs out
- Wind 1/10 Low
- Air quality 7/10 Severe 11 unhealthy d/yr today · 12 by 30 yrs out
Nearby sold comps map
Loading sold comps map…
Walkable amenities ~0.75 mi
Loading nearby amenities…
Taxation est. · year 1
- Rental income
- $23,571
- − Mortgage interest
- −$8,288
- − Property taxes
- −$2,219
- − Insurance
- −$740
- − Repairs & maintenance
- −$1,886
- − Management
- −$1,886
- − Depreciation
- −$4,304
- Taxable income
- $4,249
- Est. tax owed @ 24.0%
- −$1,020
- After-tax cash flow
- $5,332/yr
For passive investors: Depreciation is non-cash, so a rental often shows a tax loss while cash-flowing — sheltering income. Rental losses are passive: they offset passive income freely, and up to $25,000/yr can offset ordinary (W-2) income if you actively participate and your MAGI is under $100k (phasing out to $0 by $150k); unused losses carry forward. On sale, claimed depreciation is recaptured at up to 25%, and gains may owe capital-gains tax (a 1031 exchange can defer both). Figures are a year-1 estimate at your 24.0% rate — not tax advice; consult a CPA.
Schools (NCES district)
- District
- Clover Park School District
- NCES district ID
- 5301410
- Math proficiency
- 39% ▼ -2.00%
- Reading proficiency
- 51% ▲ 2.00%
- Median HH income
- $42,344
- Composite
- 40.11/100
- National rank
- #7858
- State rank
- #190 of 291 in WA
Livability — Lakewood
- Score
- 74/100
- State rank
- #182
- US rank
- #4754
Category grades
Schools grade is shown separately in the Schools card above.
Census & demographics
- Census place
- Lakewood, WA
- County
- Pierce County · 788,257 people
- City population
- 61,673
- Metro
- Seattle-Tacoma-Bellevue, WA
- Population (ZIP)
- 32,464
- Household income
- $67,292
- Rent vs Own
- Severe rent burden
- 2313.0
Population outlook (Pierce County) Hauer SSP2
- Today (2025)
- 956,648 people
- By 2030
- 1,010,862 · +5.7%
- By 2040
- 1,113,170 · +16.4%
- By 2050
- 1,206,524 · +26.1%
- By 2075
- 1,436,425 · +50.2%
- By 2100
- 1,563,654 · +63.5%
Race, ethnicity, and origin ACS 2023
- Neighborhood character
- Highly diverse neighborhood (Simpson 0.76)
- Race & ethnicity
- White 39% Hispanic / Latino 25% Two or more races 17% Black 15% Asian 8% Pacific Islander 6%
- Hispanic origin (detail)
- Mexican 17% Puerto Rican 2% Cuban 1%
- Common ancestry
- Portuguese 3% Slovak 2% Lithuanian 2%
- Foreign-born
- 18% · Canada, South Korea, Vietnam
- Languages at home
- 74% English-only · Spanish 16% Korean 3% Tagalog/Filipino 2%
Political lean MEDSL · Pierce
- 2024 margin
- D (+10.8) · D 53.9% · R 43.1% · Other 3.0%
- 2008→2024 swing
- -1.4pp toward R · 2008: 12.2pp · 2024: 10.8pp
- All cycles
- 2024: D+10.8 2020: D+11.2 2016: D+7.5 2012: D+11.0 2008: D+12.2
Not yet ingested
- Civics
- —
Market trends
- HPI YoY
- ▼ -536.54%
- Current HPI
- 288.2797
- Rent YoY
- ▲ 3.00%
- Metro
- Seattle-Tacoma-Bellevue, WA
- State GDP YoY
- ▲ 4.65%
- F500 in state
- 22
Industry mix (Fortune 500 HQ in WA)
| Industry | F500 HQs | Revenue |
|---|---|---|
| Retail | 2 | $269B |
|
||
| Technology / Retail | 1 | $638B |
|
||
| Technology | 1 | $245B |
|
||
| Telecommunications | 1 | $38B |
|
||
| Food / Beverage | 1 | $36B |
|
||
| Automotive / Trucks | 1 | $34B |
|
||
Price history
+2590.0% since first listed6 events — show timeline
- 2026-04-08 Price Changed $147,950 NWMLS as Distributed by MLS Grid
- 2025-12-09 Price Changed $149,950 NWMLS as Distributed by MLS Grid
- 2025-11-20 Price Changed $159,950 NWMLS as Distributed by MLS Grid
- 2025-10-16 Listed $164,950 NWMLS as Distributed by MLS Grid
- 2003-09-04 Sold (MLS) $5,000 NWMLS as Distributed by MLS Grid
- 2003-07-08 Listed $5,500 NWMLS as Distributed by MLS Grid
Property tax history
+5.3%/yrLatest (2024): $81 · +16.5% YoY. Source: county tax records.
Cash-flow waterfall
monthlySold comps — $/sqft
last 12 mo · ≤1 miLoading sold comps…