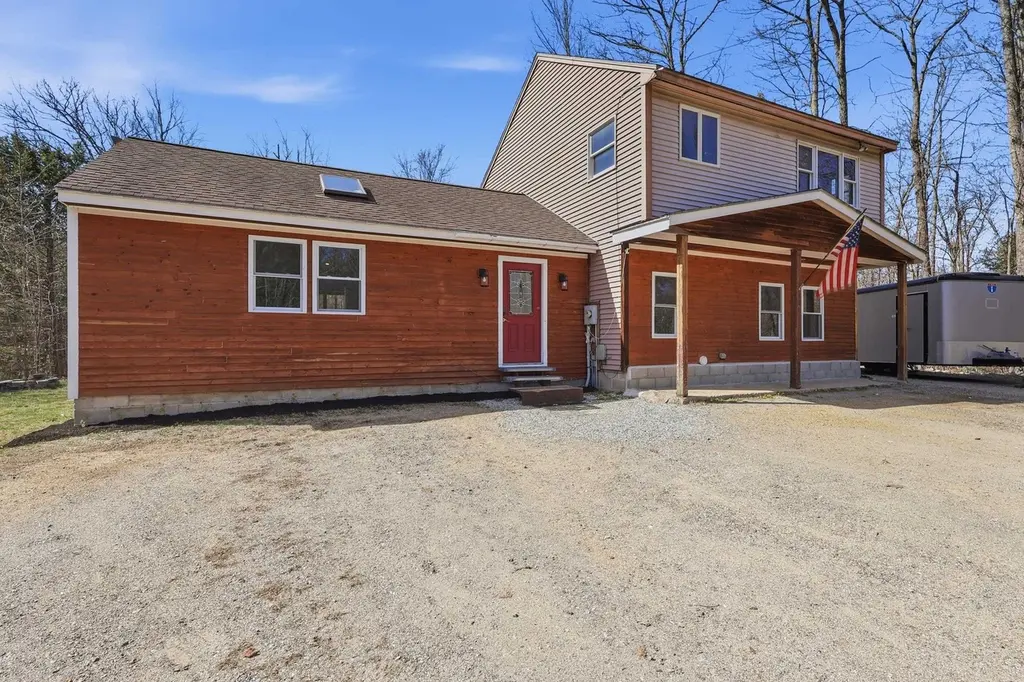
1349 Mt Major Hwy · Wolfeboro, NH
Flood risk 1/10 · Minimal
- FEMA flood zone
- X
- Chance of flooding over 30 yrs
- 0.0%
- Est. flood insurance / yr
- $473 – $860
Fire risk 3/10 · Minor
- Est. fire insurance / yr
- $507 – $941
Heat risk 3/10 · Minor
- Hot days now (above 91°F)
- 7 days/yr
- Hot days in 30 yrs
- 16 days/yr
Wind risk 4/10 · Minor
- Chance of severe wind over 30 yrs
- 9.0%
Air-quality risk 2/10 · Minimal
- Unhealthy air days now
- 1 days/yr
- Unhealthy air days in 30 yrs
- 1 days/yr
Risk factors via First Street. Map © Google.
Why this score? — see what drove the C+ grade
The composite is a weighted blend of 9 inputs, each scored 0–100. Each bar is that input's sub-score; the figure is the points it added to the 100-point composite (weight × sub-score).
- Cash flow +16.0/30.0
- ARV discount +15.0/15.0
- Appreciation +10.0/10.0
- DSCR +4.9/10.0
- Schools +3.7/10.0
- 1% rule +3.6/10.0
- Livability +3.5/5.0
- Rent growth +2.5/5.0
- Condition / age +2.5/5.0
$399,000
🖨 Deal sheet 📄 Offer letter ✓ Due diligence
Listing remarks
Welcome to 1349 Mount Major Highway, where peaceful country living meets unbeatable Lakes Region convenience. Set on 5.3 acres, this 3-bedroom, 1.5-bath home offers the kind of privacy that's hard to find. Step out onto the newly built deck and take in the view, a large, flat yard stretching out to acres of wooded land, with no neighbors in sight. Whether you're sipping your morning coffee or hosting a summer cookout, this outdoor space delivers. Inside, the main floor centers around a generous open-concept living space that make it easy to cook, gather, and relax without feeling closed off. A first-floor bedroom, half bath, and laundry add convenience, while two additional bedrooms and a f
Key facts
- 5.3 acre lot
- Built 1990
- Listed 6 days
Property features AI
Exterior
- Utilities: Drilled well (private); Private septic with concrete leach field; 200 amp electrical service with circuit breakers; High-speed internet available; Cable available
- Home design: Colonial style; Brown exterior; Shingle roof
- Construction: Wood frame construction; Built in 1990
- Exterior features: Level, wooded lot; Dirt driveway; Paved public road access; public maintained
Interior
- Kitchen: Dishwasher; Freezer; Microwave; Gas range; Refrigerator
- Flooring: Tile; Wood; Vinyl plank
- Bathrooms: One full bathroom; One half bathroom
- Heating & cooling: Oil heat; Hot water heating
- Interior features: Four total rooms; Crawl space basement
Neighborhood map
What this means for you Summary
Snapshot
- This is a 3-bed/1.5-bath single-family listed at $399k.
Deal economics
- At list price, monthly cash flow is $197 ($2k/yr) — positive.
- The deal already cash-flows at list — no discount required.
- To meet the 1% rule (rent ≥ 1% of price), the offer needs to be $342k (14.2% below list).
- Recommended offer: $342k (14.2% below list) — sets the bar for 1% rule.
- Cap rate 6.9% vs local median 0.7% in Wolfeboro — top-decile yield for the area; either an underpriced asset or a hidden risk that comps aren't pricing in. Stress-test before assuming the spread holds.
Location & tenants
- Location reads 69/100 on livability (#51 in NH) — a middle-class / working-renter tenant base. Strengths: crime A+, health & safety A+; Watch: employment C-, amenities F, commute F.
- Alton School District (rural): math 34% / reading 42% proficiency, ranked #139 of 171 in NH (top 81%) — families likely to look elsewhere, expect single-tenant / working-renter base with shorter leases.
- Market conditions: 34 active listings in the ZIP; 301 units permitted in Belknap County in 2024 (32 in 5+ unit buildings).
Forward outlook
- In year one you build about $43k of equity ($3k loan paydown + $40k appreciation (10.0% local appreciation)).
- Belknap County population projected at -10% by 2050 — secular population decline; favor cash flow + early exit over multi-decade hold.
- At projected returns (10.0% appreciation + 3.0% rent growth), your $112k cash investment doubles in ~3 years — after that, you're playing with house money.
- By year 2, paydown + projected appreciation supports a ~$69k cash-out refi (75% LTV) — recoverable capital for the next deal without selling this one.
Negotiation context
- Only 6 days on market — expect competitive offers; lowballing is unlikely to land.
- Current owner paid $125k; list at $399k implies a 219% gain — meaningful room to come down on a strong offer.
Questions for the listing agent
- Is there a deadline driving the sale (1031 exchange, divorce, estate, relocation)? That informs how much negotiation room exists.
- What's the average days-on-market for RENTAL listings here right now (not sales)? A rising rental-DOM trend means longer vacancies and softer asking-rent achievability than the comps imply.
- What's the recent tenant-quality profile in this submarket — average credit score on applications, eviction rate, late-payment / NSF rate, and stable-employment percentage? A property-management company in the area should have these aggregated.
- How much new for-sale + rental construction is in the pipeline within 1–3 miles? Heavy new supply typically softens prices + rents 12–24 months out; constrained supply supports both.
Investment metrics
- 1% rule
- 0.86% ✗
- Cap rate
- 6.89%
- Cash-on-cash
- 2.12%
- DSCR
- 1.09
- GRM
- 9.7
CMA / ARV
- ARV (on-the-fly)
- $539,608
- Comps found
- 2
Show comp detail 2 sales within ~0.75 mi
| Address | Dist | Beds/Ba | Sqft | Sold | Price | $/sf | Match |
|---|---|---|---|---|---|---|---|
| 1349 Mt Major Hwy | 0.00mi | 3/1.5 | 1,760 (-4%) | 0mo | $460,000 | $261 | 94 |
| 202 Cherry Valley Rd | 0.46mi | 3/2.5 | 1,872 (+3%) | 8mo | $554,900 | $296 | 64 |
Match score weights: distance 35% · size 25% · config 20% · recency 20%. Top-matched comps best support the ARV.
Projected returns pro-forma
10.0% appreciation · 3.0% rent growth · sell at horizon
- IRR
- 25.8%
- Equity multiple
- 3.06×
- Total profit
- $229,765
- Equity at exit
- $359,451
- IRR
- 22.7%
- Equity multiple
- 6.97×
- Total profit
- $666,538
- Equity at exit
- $775,169
Cash invested: $111,720 (down + closing). Projections, not guarantees.
Landlord ↔ Tenant lean methodology
- Overall (STATE)
- 56 Moderately Landlord-Leaning
- State New Hampshire
- 56 Moderately Landlord-Leaning · D+1
- County
- — inherits STATE
- City
- — inherits STATE
ZIP-level market 03810
- Home prices YoY
- 33.9%
- Active inventory
- 34
- Price-to-rent
- 9.7×
Monthly cashflow live
- Estimated rent
- $3,423 medium interval (Pro) →
- Mortgage (P&I)
- −$2,092
- Tax from tax record
- −$249 /mo · $2,983/yr
- Insurance
- −$166
- HOA
- −$0
- Vacancy / Maint / Mgmt
- −$719
- Net cashflow
- $197
Break-even live
UW: 25.0% down · 7.5% · 30yr · 1.5% tax · 5.0% vac · 8.0% maint · 8.0% mgmt
Financing live
Cash to close
- Down payment
- $99,750
- Closing costs
- $11,970
- Reserves months
- —
- Total cash needed
- —
Loan-product check · same deal, 3 products live
Conventional
25% down · 7.5% · 30yr
- Down + closing
- —
- Monthly P&I
- —
- Monthly cashflow
- —
- DSCR
- —
- Eligible?
- —
Personal DTI + credit; lowest rate.
DSCR
20% down · 8.5% · 30yr
- Down + closing
- —
- Monthly P&I
- —
- Monthly cashflow
- —
- DSCR
- —
- Eligible?
- —
No personal income docs; deal must DSCR.
Hard money
10% down · 12.0% · 12mo
- Down + closing
- —
- Monthly P&I
- —
- Monthly cashflow
- —
- DSCR
- —
- Eligible?
- —
Short-term bridge; refi at stabilization.
Listing history 3 events
-
2026-05-05status Pending
-
2026-04-29$399,000 Active
-
2012-08-06soldstatus $125,000
ⓘ Source: listings_history table (triggers on properties + properties_extension) + one-shot
backfill from property_details.listing_events for pre-trigger history.
Tax reassessment forecast NH · Partial reset (capped growth)
- Current annual tax
- $2,983 · $249/mo
- Projected year-2 tax
- $5,841 · $487/mo
- Expected delta
- +$2,858/yr (+$238/mo · 95.8%)
ⓘ Screening estimate from a state-policy table — verify with the county assessor before closing.
Climate risk First Street
- Flood 1/10 Low FEMA zone X · 0% chance over 30 yrs
- Wildfire 3/10 Moderate
- Heat 3/10 Moderate 7 d/yr ≥91°F today · 16 d/yr by 30 yrs out
- Wind 4/10 Moderate 9% chance of damaging wind over 30 yrs
- Air quality 2/10 Low 1 unhealthy d/yr today · 1 by 30 yrs out
Nearby sold comps map
Loading sold comps map…
Walkable amenities ~0.75 mi
Loading nearby amenities…
Taxation est. · year 1
- Rental income
- $41,080
- − Mortgage interest
- −$22,350
- − Property taxes
- −$2,983
- − Insurance
- −$1,995
- − Repairs & maintenance
- −$3,286
- − Management
- −$3,286
- − Depreciation
- −$11,607
- Taxable loss
- −$4,428
- Est. tax savings @ 24.0%
- +$1,063
- After-tax cash flow
- $3,429/yr
For passive investors: Depreciation is non-cash, so a rental often shows a tax loss while cash-flowing — sheltering income. Rental losses are passive: they offset passive income freely, and up to $25,000/yr can offset ordinary (W-2) income if you actively participate and your MAGI is under $100k (phasing out to $0 by $150k); unused losses carry forward. On sale, claimed depreciation is recaptured at up to 25%, and gains may owe capital-gains tax (a 1031 exchange can defer both). Figures are a year-1 estimate at your 24.0% rate — not tax advice; consult a CPA.
Schools (NCES district)
- District
- Alton School District
- NCES district ID
- 3301440
- Math proficiency
- 34% ▼ -8.00%
- Reading proficiency
- 42% ▼ -3.00%
- Median HH income
- $66,442
- Composite
- 36.9/100
- National rank
- #9132
- State rank
- #139 of 171 in NH
Livability — Wolfeboro
- Score
- 69/100
- State rank
- #51
- US rank
- #8820
Category grades
Schools grade is shown separately in the Schools card above.
Census & demographics
- Population (ZIP)
- 2,269
Population outlook (Belknap County) Hauer SSP2
- Today (2025)
- 60,702 people
- By 2030
- 60,353 · -0.6%
- By 2040
- 58,264 · -4.0%
- By 2050
- 54,533 · -10.2%
- By 2075
- 45,622 · -24.8%
- By 2100
- 33,772 · -44.4%
Race, ethnicity, and origin ACS 2023
- Neighborhood character
- Predominantly White (95%)
- Race & ethnicity
- White 95% Two or more races 4%
- Common ancestry
- Serbian 9% Romanian 9% Lithuanian 6%
- Foreign-born
- 1% · Canada
- Languages at home
- 99% English-only · French/Haitian/Cajun 1%
Political lean MEDSL · Belknap
- 2024 margin
- R (+13.1) · D 43.1% · R 56.1%
- 2008→2024 swing
- -14.2pp toward R · 2008: 1.2pp · 2024: -13.1pp
- All cycles
- 2024: R+13.1 2020: R+10.4 2016: R+16.8 2012: R+5.0 2008: D+1.2
Not yet ingested
- Civics
- —
Market trends
- HPI YoY
- ▲ 112.98%
- Current HPI
- 446.0509
- Rent YoY
- —
- Metro
- —
- State GDP YoY
- —
- F500 in state
- 0
Price history
+219.2% since first listed3 events — show timeline
- 2026-05-05 Pending — PrimeMLS
- 2026-04-29 Listed $399,000 PrimeMLS
- 2012-08-06 Sold (Public Records) $125,000 Public Records
Property tax history
+3.4%/yrLatest (2024): $2,983 · -1.5% YoY. Source: county tax records.
Cash-flow waterfall
monthlySold comps — $/sqft
last 12 mo · ≤1 miLoading sold comps…