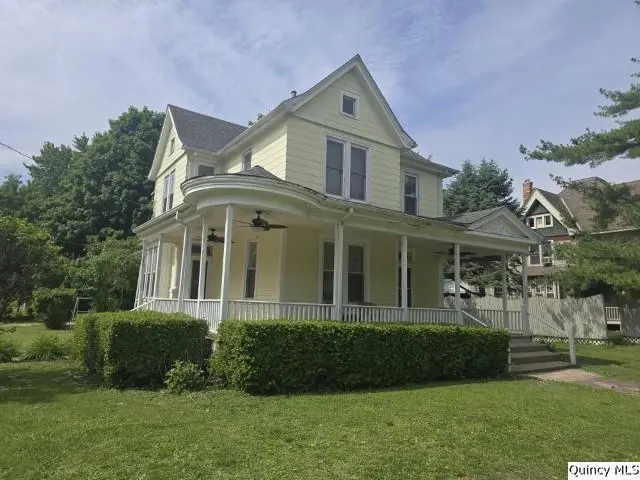
210 Main · Ferris, IL
Flood risk 1/10 · Minimal
- FEMA flood zone
- X (unshaded)
- Chance of flooding over 30 yrs
- 0.0%
- Est. flood insurance / yr
- $473 – $860
Fire risk 1/10 · Minimal
- Est. fire insurance / yr
- $804 – $1,492
Heat risk 3/10 · Minor
- Hot days now (above 107°F)
- 7 days/yr
- Hot days in 30 yrs
- 16 days/yr
Wind risk 2/10 · Minimal
- Chance of severe wind over 30 yrs
- —
Air-quality risk 2/10 · Minimal
- Unhealthy air days now
- 0 days/yr
- Unhealthy air days in 30 yrs
- 1 days/yr
Risk factors via First Street. Map © Google.
Why this score? — see what drove the C+ grade
The composite is a weighted blend of 9 inputs, each scored 0–100. Each bar is that input's sub-score; the figure is the points it added to the 100-point composite (weight × sub-score).
- Cash flow +23.3/30.0
- DSCR +7.5/10.0
- ARV discount +7.5/15.0
- 1% rule +7.2/10.0
- Appreciation +5.0/10.0
- Livability +3.1/5.0
- Rent growth +2.5/5.0
- Schools +2.5/10.0
- Condition / age +2.5/5.0
$110,000
🖨 Deal sheet (PDF) 📄 Offer letter ✓ Due diligence
Listing remarks
Welcome to this inviting 5-bedroom, 2-bath home filled with timeless charm and everyday comfort. Relax on the large open front porch, perfect for morning coffee or evening gatherings. Inside, you'll appreciate the beautiful natural woodwork and stunning leaded glass window that add warmth and character throughout the home. With five spacious bedrooms, there's plenty of room for family, guests, or a home office setup. The generous yard offers space for outdoor entertaining, gardening, or play, while the attached 1-car garage provides added convenience and storage. This home offers NG radiant heat, air conditioning, wood/masonite/slate exterior, all appliances, & much more! A wonderful
Key facts
- Natural woodwork
- Air conditioning
- Generous yard
Tags
Property features AI
Finance
- Other: Possession at closing
Exterior
- Parking: Attached 1-car garage; 1 parking space total
- Security: No specific security features listed
- Utilities: Public water
- Home design: Detached single-family home; Two stories
- Construction: Masonite and wood siding exterior; Asphalt roof; Property has crawl space foundation
- Exterior features: Patio; Porch; Mature trees on lot; Lot dimensions approximately 86 x 217
Interior
- Kitchen: Range; Microwave; Dishwasher; Garbage disposal; Refrigerator
- Bedrooms: Five bedrooms total; Master bedroom on second floor; Additional bedrooms on main and second floors
- Flooring: Hardwood in several main living areas; Vinyl in foyer and kitchen; Carpet in bedrooms and family room
- Bathrooms: Two full bathrooms
- Heating & cooling: Natural gas heating with baseboard and radiant components; Other cooling
- Interior features: Foyer; Dining room; Family room; Living room; Partial, unfinished crawl space basement with sump pump; Attic exhaust fan; Ceiling fans; Electric water heater; Fiber internet
- Laundry & utility: Washer and dryer included; Laundry located on main level
Neighborhood map
What this means for you Summary
Snapshot
- This is a 5-bed/2.0-bath single-family listed at $110k.
Deal economics
- At list price, monthly cash flow is $201 ($2k/yr) — positive.
- The deal already cash-flows at list — no discount required.
- Meets the 1% rule at list price ($1k rent vs $110k).
- Recommended offer: $108k (1.5% below list) — sets the bar for market timing.
Location & tenants
- Location reads 62/100 on livability (#831 in IL) — a middle-class / working-renter tenant base. Strengths: cost of living A+, housing A+; Watch: health & safety C-, crime D-, amenities F.
- Illini West H S District 307 (town): math 25% / reading 25% proficiency, ranked #611 of 919 in IL (top 66%) — low school quality limits family demand, transient renter base, plan for 1-2y turnover.
- Zoned schools: Illini West High School (math 17% / reading 27%, grade F, #319 of 693 statewide, top 50%, 342 students, 0% FRL).
- Market conditions: 5 active listings in the ZIP.
Forward outlook
- In year one you build about $4k of equity ($761 loan paydown + $3k appreciation (3.0% local appreciation)).
- Hancock County population projected at -30% by 2050 — secular population decline; favor cash flow + early exit over multi-decade hold.
- At projected returns (3.0% appreciation + 3.0% rent growth), your $31k cash investment doubles in ~5 years — after that, you're playing with house money.
- By year 8, paydown + projected appreciation supports a ~$30k cash-out refi (75% LTV) — recoverable capital for the next deal without selling this one.
Negotiation context
- It's been on market 29 days — a 2% lower offer ($108k) is reasonable based on typical stale-listing flexibility.
Risks & watch-outs
- Watch-outs: property tax is 2.6% of price; built in 1910 — expect roof / HVAC / electrical / plumbing capex.
Questions for the listing agent
- Built in 1910 — when were the roof, HVAC, electrical panel, plumbing, and water heater last replaced?
- Property tax is high relative to price — has the assessment been appealed recently, and will the sale trigger a re-assessment?
- Is there a deadline driving the sale (1031 exchange, divorce, estate, relocation)? That informs how much negotiation room exists.
- Schools are F-rated, which usually means shorter tenancies and higher turnover. Who's the typical renter profile here, and what's been the actual vacancy rate?
- Crime grade is D in this area — have there been break-ins, vandalism, or insurance claims at this property in the last 3 years? What carrier currently insures it and at what premium?
- What's the average days-on-market for RENTAL listings here right now (not sales)? A rising rental-DOM trend means longer vacancies and softer asking-rent achievability than the comps imply.
- What's the recent tenant-quality profile in this submarket — average credit score on applications, eviction rate, late-payment / NSF rate, and stable-employment percentage? A property-management company in the area should have these aggregated.
- How much new for-sale + rental construction is in the pipeline within 1–3 miles? Heavy new supply typically softens prices + rents 12–24 months out; constrained supply supports both.
Investment metrics
- 1% rule
- 1.22% ✓
- Cap rate
- 8.49%
- Cash-on-cash
- 7.84%
- DSCR
- 1.35
- GRM
- 6.8
CMA / ARV
No comps found within radius.
Projected returns pro-forma
3.0% appreciation · 3.0% rent growth · sell at horizon
- IRR
- 14.9%
- Equity multiple
- 1.85×
- Total profit
- $26,147
- Equity at exit
- $49,461
- IRR
- 16.6%
- Equity multiple
- 3.44×
- Total profit
- $75,247
- Equity at exit
- $76,225
Cash invested: $30,800 (down + closing). Projections, not guarantees.
Landlord ↔ Tenant lean methodology
- Overall (STATE)
- 43 Moderately Tenant-Leaning
- State Illinois
- 43 Moderately Tenant-Leaning · D+7
- County
- — inherits STATE
- City
- — inherits STATE
ZIP-level market 62321-1258
- Active inventory
- 5
- Price-to-rent
- 6.8×
Monthly cashflow live
- Estimated rent
- $1,340 medium interval (Pro) →
- Mortgage (P&I)
- −$577
- Tax from tax record
- −$235 /mo · $2,821/yr
- Insurance
- −$46
- HOA
- −$0
- Vacancy / Maint / Mgmt
- −$282
- Net cashflow
- $201
Break-even live
Sensitivity live
| Price | -10% $263 | -5% $232 | +0% $201 | +5% $170 | +10% $139 |
|---|---|---|---|---|---|
| Rent | -10% $95 | -5% $148 | +0% $201 | +5% $254 | +10% $307 |
| Rate | -1.0pp $257 | -0.5pp $229 | base $201 | +0.5pp $173 | +1.0pp $144 |
UW: 25.0% down · 7.5% · 30yr · 1.5% tax · 5.0% vac · 8.0% maint · 8.0% mgmt
Financing live
Cash to close
- Down payment
- $27,500
- Closing costs
- $3,300
- Reserves months
- —
- Total cash needed
- —
Loan-product check · same deal, 3 products live
Conventional
25% down · 7.5% · 30yr
- Down + closing
- —
- Monthly P&I
- —
- Monthly cashflow
- —
- DSCR
- —
- Eligible?
- —
Personal DTI + credit; lowest rate.
DSCR
20% down · 8.5% · 30yr
- Down + closing
- —
- Monthly P&I
- —
- Monthly cashflow
- —
- DSCR
- —
- Eligible?
- —
No personal income docs; deal must DSCR.
Hard money
10% down · 12.0% · 12mo
- Down + closing
- —
- Monthly P&I
- —
- Monthly cashflow
- —
- DSCR
- —
- Eligible?
- —
Short-term bridge; refi at stabilization.
Listing history 17 events
-
2026-06-19days on market $110,000 Active 29 DOM
-
2026-06-18days on market $110,000 Active 28 DOM
-
2026-06-17days on market $110,000 Active 27 DOM
-
2026-06-16days on market $110,000 Active 26 DOM
-
2026-06-15days on market $110,000 Active 25 DOM
-
2026-06-14days on market $110,000 Active 23 DOM
-
2026-06-12days on market $110,000 Active 22 DOM
-
2026-06-09days on market $110,000 Active 19 DOM
-
2026-06-08days on market $110,000 Active 18 DOM
-
2026-06-07days on market $110,000 Active 17 DOM
-
2026-06-07days on market $110,000 Active 16 DOM
-
2026-06-03days on market $110,000 Active 13 DOM
-
2026-06-02days on market $110,000 Active 12 DOM
-
2026-06-01days on market $110,000 Active 11 DOM
-
2026-05-31days on market $110,000 Active 10 DOM
-
2026-05-30days on market $110,000 Active 9 DOM
-
2026-05-21$110,000 Active
ⓘ Source: listings_history table (triggers on properties + properties_extension) + one-shot
backfill from property_details.listing_events for pre-trigger history.
Tax reassessment forecast IL · Partial reset (capped growth)
- Current annual tax
- $2,821 · $235/mo
- Projected year-2 tax
- $2,821 · $235/mo
- Expected delta
- $0/yr ($0/mo · 0.0%)
ⓘ Screening estimate from a state-policy table — verify with the county assessor before closing.
Climate risk First Street
- Flood 1/10 Low FEMA zone X (unshaded) · 0% chance over 30 yrs
- Wildfire 1/10 Low
- Heat 3/10 Moderate 7 d/yr ≥107°F today · 16 d/yr by 30 yrs out
- Wind 2/10 Low
- Air quality 2/10 Low 0 unhealthy d/yr today · 1 by 30 yrs out
Nearby sold comps map
Loading sold comps map…
Walkable amenities ~0.75 mi
Loading nearby amenities…
Taxation est. · year 1
- Rental income
- $16,086
- − Mortgage interest
- −$6,162
- − Property taxes
- −$2,821
- − Insurance
- −$550
- − Repairs & maintenance
- −$1,287
- − Management
- −$1,287
- − Depreciation
- −$3,200
- Taxable income
- $779
- Est. tax owed @ 24.0%
- −$187
- After-tax cash flow
- $2,228/yr
For passive investors: Depreciation is non-cash, so a rental often shows a tax loss while cash-flowing — sheltering income. Rental losses are passive: they offset passive income freely, and up to $25,000/yr can offset ordinary (W-2) income if you actively participate and your MAGI is under $100k (phasing out to $0 by $150k); unused losses carry forward. On sale, claimed depreciation is recaptured at up to 25%, and gains may owe capital-gains tax (a 1031 exchange can defer both). Figures are a year-1 estimate at your 24.0% rate — not tax advice; consult a CPA.
Schools (NCES district)
- District
- Illini West H S District 307
- NCES district ID
- 1701384
- Math proficiency
- 25% ▲ 5.00%
- Reading proficiency
- 25% ▲ 5.00%
- Median HH income
- $47,745
- Composite
- 24.88/100
- National rank
- #12997
- State rank
- #611 of 919 in IL
Livability — Ferris
- Score
- 62/100
- State rank
- #831
- US rank
- #16413
Category grades
Schools grade is shown separately in the Schools card above.
Census & demographics
- Census place
- Ferris, IL
Population outlook (Hancock County) Hauer SSP2
- Today (2025)
- 17,042 people
- By 2030
- 16,056 · -5.8%
- By 2040
- 13,912 · -18.4%
- By 2050
- 11,879 · -30.3%
- By 2075
- 8,302 · -51.3%
- By 2100
- 5,846 · -65.7%
Not yet ingested
- Political lean
- —
- Race & ethnicity
- —
- Common origin
- —
- Civics
- —
Market trends
- HPI YoY
- —
- Current HPI
- —
- Rent YoY
- —
- Metro
- —
- State GDP YoY
- ▲ 1.59%
- F500 in state
- 60
Industry mix (Fortune 500 HQ in IL)
| Industry | F500 HQs | Revenue |
|---|---|---|
| Insurance | 4 | $201B |
|
||
| Consumer Goods | 4 | $87B |
|
||
| Industrial Machinery | 3 | $64B |
|
||
| Healthcare | 2 | $55B |
|
||
| Retail / Pharmacy | 1 | $148B |
|
||
| Agriculture / Food | 1 | $86B |
|
||
Price history
1 event — show timeline
- 2026-05-21 Listed $110,000 MRED as Distributed by MLS Grid
Property tax history
+15.6%/yrLatest (2024): $2,821 · +8.6% YoY. Source: county tax records.
Cash-flow waterfall
monthlySold comps — $/sqft
last 12 mo · ≤1 miLoading sold comps…