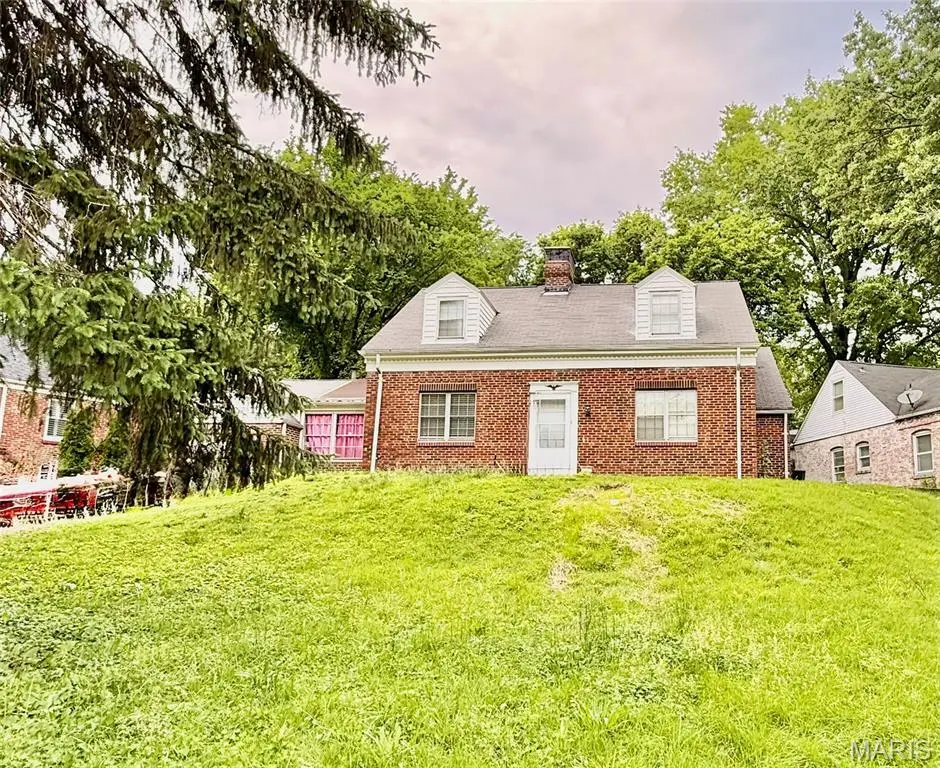
20 Green Acres Rd · Bellefontaine Neighbors, MO
Flood risk 1/10 · Minimal
- FEMA flood zone
- X (unshaded)
- Chance of flooding over 30 yrs
- 0.0%
- Est. flood insurance / yr
- $473 – $860
Fire risk 1/10 · Minimal
- Est. fire insurance / yr
- $1,054 – $1,958
Heat risk 5/10 · Moderate
- Hot days now (above 107°F)
- 7 days/yr
- Hot days in 30 yrs
- 21 days/yr
Wind risk 2/10 · Minimal
- Chance of severe wind over 30 yrs
- 1.0%
Air-quality risk 4/10 · Minor
- Unhealthy air days now
- 5 days/yr
- Unhealthy air days in 30 yrs
- 6 days/yr
Risk factors via First Street. Map © Google.
Why this score? — see what drove the C grade
The composite is a weighted blend of 9 inputs, each scored 0–100. Each bar is that input's sub-score; the figure is the points it added to the 100-point composite (weight × sub-score).
- Cash flow +21.0/30.0
- ARV discount +12.0/15.0
- DSCR +6.7/10.0
- 1% rule +5.9/10.0
- Rent growth +4.1/5.0
- Livability +2.9/5.0
- Condition / age +2.5/5.0
- Schools +0.4/10.0
- Appreciation +0.0/10.0
$139,900
🖨 Deal sheet 📄 Offer letter ✓ Due diligence
Listing remarks
Spacious 1.5 story home in amazing neighborhood. Classic Cape Cod design maintenance free brick exterior on a wonderfully private lot. Some New paint, and tons of beautifully refinished hardwood floors. New sewer line in was installed in front yard. need 24 notice to view then lockbox.
Key facts
- Private lot
- Cape cod design
- New sewer line
Tags
Property features AI
Finance
- Other: Living area reported as 1,917 (assessor); Lot size approximately 0.219 acres; No home warranty
Exterior
- Parking: 1-car garage
- Utilities: Public water; Public sewer; Electricity connected (single phase); Natural gas connected
- Home design: Single family residence; Residential property; Two levels; Entry level includes main and upper levels
- Construction: Brick and wood siding construction; Architectural shingle roof; Concrete perimeter foundation; Built with traditional residential construction
- Exterior features: Back yard; Front yard; City lot; Gentle sloping lot
Interior
- Kitchen: Dishwasher; Free-standing electric oven; Free-standing electric range
- Bedrooms: 3 bedrooms total; 1 main-level bedroom; 2 upper-level bedrooms
- Bathrooms: 1 full bathroom; 1 half bathroom; Main level full bathroom; Upper level half bathroom
- Interior features: Dishwasher; Free-standing electric oven; Free-standing electric range; Forced air heating; Central air conditioning; Full unfinished basement; One fireplace in the family room
Neighborhood map
What this means for you Summary
Snapshot
- This is a 3-bed/1.5-bath single-family listed at $140k.
Deal economics
- At list price, monthly cash flow is $197 ($2k/yr) — positive.
- The deal already cash-flows at list — no discount required.
- Meets the 1% rule at list price ($2k rent vs $140k).
Location & tenants
- Location reads 58/100 on livability (#592 in MO) — a working-class tenant base; expect higher turnover. Strengths: cost of living A+, housing B+; Watch: employment D+, crime F, amenities F.
- Riverview Gardens (suburban): math 2% / reading 9% proficiency, ranked #324 of 324 in MO (top 100%) — low school quality limits family demand, transient renter base, plan for 1-2y turnover; 90% free/reduced lunch — lower-income household profile, screen leases tightly.
- Zoned schools: Lewis And Clark Elem. (math 2% / reading 2%, grade F, #1,099 of 1,115 statewide, top 100%, 145 students, 98% FRL); Riverview Gardens Sr. High (math 2% / reading 18%, grade F, #501 of 521 statewide, top 97%, 1,331 students, 100% FRL).
- Market conditions: Rents rising fast (+6.6%/yr); 201 active listings in the ZIP; 11 comparable units currently listed for rent nearby; rentals at typical pace (median 19d on market — plan ~3-4 weeks tenant-placement turnaround); lower-income renter base — watch delinquency; 920 units permitted in St. Louis County in 2024 (250 in 5+ unit buildings).
- This rent runs 42% of the median local income ($43k/yr) — at the standard rent-burdened threshold; future hikes will face affordability resistance.
Forward outlook
- Local home prices are declining (-3.0%/yr); year-one equity from $967 of loan paydown is wiped out by about $4k of value loss. Plan a longer hold.
- At projected returns (-3.0% appreciation + 6.6% rent growth), your $39k cash investment doubles in ~10 years — after that, you're playing with house money.
Negotiation context
- Only 7 days on market — expect competitive offers; lowballing is unlikely to land.
- Current owner paid $108k; 30% above their basis — modest negotiation headroom, anchor on the comps not their cost.
Risks & watch-outs
- Watch-outs: built in 1946 — expect roof / HVAC / electrical / plumbing capex.
- Climate carrying-cost: extreme-heat days projected 7→21/yr by 2055 (HVAC capex compounding) — expect insurance premiums to compound above CPI over the hold.
Questions for the listing agent
- Built in 1946 — when were the roof, HVAC, electrical panel, plumbing, and water heater last replaced?
- Is there a deadline driving the sale (1031 exchange, divorce, estate, relocation)? That informs how much negotiation room exists.
- Schools are F-rated, which usually means shorter tenancies and higher turnover. Who's the typical renter profile here, and what's been the actual vacancy rate?
- Crime grade is F in this area — have there been break-ins, vandalism, or insurance claims at this property in the last 3 years? What carrier currently insures it and at what premium?
- What's the average days-on-market for RENTAL listings here right now (not sales)? A rising rental-DOM trend means longer vacancies and softer asking-rent achievability than the comps imply.
- What's the recent tenant-quality profile in this submarket — average credit score on applications, eviction rate, late-payment / NSF rate, and stable-employment percentage? A property-management company in the area should have these aggregated.
- How much new for-sale + rental construction is in the pipeline within 1–3 miles? Heavy new supply typically softens prices + rents 12–24 months out; constrained supply supports both.
Investment metrics
- 1% rule
- 1.09% ✓
- Cap rate
- 7.99%
- Cash-on-cash
- 6.05%
- DSCR
- 1.27
- GRM
- 7.6
CMA / ARV
- ARV (on-the-fly)
- $155,277
- Comps found
- 12
Show comp detail 12 sales within ~0.75 mi
| Address | Dist | Beds/Ba | Sqft | Sold | Price | $/sf | Match |
|---|---|---|---|---|---|---|---|
| 11 Green Acres Rd | 0.10mi | 3/2.0 | 1,810 (-6%) | 1mo | $156,000 | $86 | 83 |
| 9731 Bellefontaine | 0.20mi | 3/2.0 | 1,923 (+0%) | 11mo | $164,900 | $86 | 79 |
| 1150 Bosworth Dr | 0.29mi | 3/2.0 | 2,012 (+5%) | 3mo | $155,000 | $77 | 73 |
| 160 Green Acres Rd | 0.11mi | 3/2.0 | 1,760 (-8%) | 18mo | $205,000 | $116 | 64 |
| 9620 Duluth Dr | 0.39mi | 3/2.0 | 1,855 (-3%) | 14mo | $144,900 | $78 | 63 |
| 10116 Bellefontaine Rd | 0.55mi | 3/2.0 | 1,865 (-3%) | 6mo | $160,000 | $86 | 63 |
| 9845 Lewis And Clark Blvd | 0.64mi | 3/2.0 | 1,942 (+1%) | 10mo | $129,900 | $67 | 58 |
| 17 Biritz Dr | 0.33mi | 3/3.0 | 1,983 (+3%) | 19mo | $192,000 | $97 | 57 |
| 7 Biritz Dr | 0.38mi | 3/2.5 | 2,088 (+9%) | 12mo | $169,900 | $81 | 53 |
| 1400 Corinth Dr | 0.59mi | 3/1.0 | 2,024 (+6%) | 10mo | $120,000 | $59 | 53 |
| 1019 Avant Dr | 0.73mi | 3/1.0 | 1,872 (-2%) | 10mo | $90,000 | $48 | 52 |
| 9925 Hayward Dr | 0.55mi | 3/2.0 | 2,014 (+5%) | 19mo | $134,999 | $67 | 48 |
Match score weights: distance 35% · size 25% · config 20% · recency 20%. Top-matched comps best support the ARV.
Projected returns pro-forma
-3.0% appreciation · 6.59% rent growth · sell at horizon
- IRR
- -2.8%
- Equity multiple
- 0.89×
- Total profit
- $-4,324
- Equity at exit
- $20,860
- IRR
- 10.6%
- Equity multiple
- 1.97×
- Total profit
- $37,923
- Equity at exit
- $12,096
Cash invested: $39,172 (down + closing). Projections, not guarantees.
Landlord ↔ Tenant lean methodology
- Overall (STATE)
- 81 Strongly Landlord-Friendly
- State Missouri
- 81 Strongly Landlord-Friendly · R+10
- County
- — inherits STATE
- City
- — inherits STATE
ZIP-level market 63137
- Rents YoY
- 6.6%
- Active inventory
- 201
- Price-to-rent
- 7.6×
Monthly cashflow live
- Estimated rent
- $1,530 high interval (Pro) →
- Mortgage (P&I)
- −$734
- Tax from tax record
- −$219 /mo · $2,631/yr
- Insurance
- −$58
- HOA
- −$0
- Vacancy / Maint / Mgmt
- −$321
- Net cashflow
- $197
Break-even live
UW: 25.0% down · 7.5% · 30yr · 1.5% tax · 5.0% vac · 8.0% maint · 8.0% mgmt
Financing live
Cash to close
- Down payment
- $34,975
- Closing costs
- $4,197
- Reserves months
- —
- Total cash needed
- —
Loan-product check · same deal, 3 products live
Conventional
25% down · 7.5% · 30yr
- Down + closing
- —
- Monthly P&I
- —
- Monthly cashflow
- —
- DSCR
- —
- Eligible?
- —
Personal DTI + credit; lowest rate.
DSCR
20% down · 8.5% · 30yr
- Down + closing
- —
- Monthly P&I
- —
- Monthly cashflow
- —
- DSCR
- —
- Eligible?
- —
No personal income docs; deal must DSCR.
Hard money
10% down · 12.0% · 12mo
- Down + closing
- —
- Monthly P&I
- —
- Monthly cashflow
- —
- DSCR
- —
- Eligible?
- —
Short-term bridge; refi at stabilization.
Rent comps 11 comps
| Address | Beds | Baths | Sqft | Rent | $/sqft | DOM | Units | Dist |
|---|---|---|---|---|---|---|---|---|
| 9908 Norbridge Ln Saint Louis, MO | 2.0 | 2.0 | 1240 | $1,650 | $1.33 | 19d | 1 | 0.50mi |
| 9517 West Ave Unit 1F St. Louis, MO | 3.0 | 1.0 | 1300 | $1,300 | $1.00 | 43d | 1 | 0.76mi |
| 10331 Ewell Dr Saint Louis, MO | 3.0 | 1.0 | 1658 | $1,540 | $0.93 | 3d | 1 | 0.83mi |
| 10201 McCartney Ln Saint Louis, MO | 3.0 | 2.0 | 1504 | $1,565 | $1.04 | 16d | 1 | 0.87mi |
| 808 Bella Ln Saint Louis, MO | 4.0 | 2.0 | 1300 | $1,650 | $1.27 | 17d | 1 | 0.98mi |
| 371 Adrian Dr Saint Louis, MO | 2.0 | 1.0 | 1337 | $1,200 | $0.90 | 43d | 1 | 1.17mi |
| 10441 Prince Dr Saint Louis, MO | 4.0 | 1.5 | 1380 | $1,380 | $1.00 | 43d | 1 | 1.29mi |
| 10409 Renfrew Dr Saint Louis, MO | 3.0 | 1.0 | 1644 | $1,250 | $0.76 | 23d | 1 | 1.35mi |
| 368 Cameron Rd Saint Louis, MO | 4.0 | 1.0 | 1628 | $1,580 | $0.97 | 43d | 1 | 1.44mi |
| 10515 Renfrew Dr Saint Louis, MO | 3.0 | 1.0 | 1670 | $1,400 | $0.84 | 4d | 1 | 1.44mi |
| 10515 Renfrew Dr Saint Louis, MO | 3.0 | 1.0 | 1670 | $1,400 | $0.84 | 7d | 1 | 1.44mi |
Listing history 7 events
-
2026-06-18days on market $139,900 Active 7 DOM
-
2026-06-17days on market $139,900 Active 6 DOM
-
2026-06-16days on market $139,900 Active 5 DOM
-
2026-06-15days on market $139,900 Active 4 DOM
-
2026-06-13days on market $139,900 Active 2 DOM
-
2026-06-13remarks 286-char remark
-
2026-06-13$139,900 Active 1 DOM
ⓘ Source: listings_history table (triggers on properties + properties_extension) + one-shot
backfill from property_details.listing_events for pre-trigger history.
Tax reassessment forecast MO · Resets to sale price
- Current annual tax
- $2,631 · $219/mo
- Projected year-2 tax
- $2,631 · $219/mo
- Expected delta
- $0/yr ($0/mo · 0.0%)
ⓘ Screening estimate from a state-policy table — verify with the county assessor before closing.
Climate risk First Street
- Flood 1/10 Low FEMA zone X (unshaded) · 0% chance over 30 yrs
- Wildfire 1/10 Low
- Heat 5/10 Major 7 d/yr ≥107°F today · 21 d/yr by 30 yrs out
- Wind 2/10 Low 100% chance of damaging wind over 30 yrs
- Air quality 4/10 Moderate 5 unhealthy d/yr today · 6 by 30 yrs out
Nearby sold comps map
Loading sold comps map…
Walkable amenities ~0.75 mi
Loading nearby amenities…
Taxation est. · year 1
- Rental income
- $18,359
- − Mortgage interest
- −$7,837
- − Property taxes
- −$2,631
- − Insurance
- −$700
- − Repairs & maintenance
- −$1,469
- − Management
- −$1,469
- − Depreciation
- −$4,070
- Taxable income
- $184
- Est. tax owed @ 24.0%
- −$44
- After-tax cash flow
- $2,324/yr
For passive investors: Depreciation is non-cash, so a rental often shows a tax loss while cash-flowing — sheltering income. Rental losses are passive: they offset passive income freely, and up to $25,000/yr can offset ordinary (W-2) income if you actively participate and your MAGI is under $100k (phasing out to $0 by $150k); unused losses carry forward. On sale, claimed depreciation is recaptured at up to 25%, and gains may owe capital-gains tax (a 1031 exchange can defer both). Figures are a year-1 estimate at your 24.0% rate — not tax advice; consult a CPA.
Schools (NCES district)
- District
- Riverview Gardens
- NCES district ID
- 2926670
- Math proficiency
- 2% ▼ -6.00%
- Reading proficiency
- 9% ▼ -6.00%
- Median HH income
- $32,759
- Composite
- 4.22/100
- National rank
- #10058
- State rank
- #324 of 324 in MO
Livability — Bellefontaine Neighbors
- Score
- 58/100
- State rank
- #592
- US rank
- #20944
Category grades
Schools grade is shown separately in the Schools card above.
Census & demographics
- Census place
- Bellefontaine Neighbors, MO
- County
- Saint Louis County · 888,823 people
- City population
- 19,684
- Metro
- St. Louis, MO-IL
- Population (ZIP)
- 19,684
- Household income
- $43,422
- Rent vs Own
- Severe rent burden
- 1863.0
Population outlook (St. Louis County) Hauer SSP2
- Today (2025)
- 1,025,227 people
- By 2030
- 1,028,023 · +0.3%
- By 2040
- 1,020,940 · -0.4%
- By 2050
- 1,007,280 · -1.8%
- By 2075
- 987,277 · -3.7%
- By 2100
- 921,984 · -10.1%
Race, ethnicity, and origin ACS 2023
- Neighborhood character
- Predominantly Black (82%)
- Race & ethnicity
- Black 82% White 13% Two or more races 3%
- Common ancestry
- Romanian 1% Lithuanian 1% Italian 1%
- Foreign-born
- 1%
Political lean MEDSL · St. Louis
- 2024 margin
- Strong D (+23.4) · D 60.8% · R 37.4% · Other 1.7%
- 2008→2024 swing
- +3.5pp toward D · 2008: 19.9pp · 2024: 23.4pp
- All cycles
- 2024: D+23.4 2020: D+24.0 2016: D+16.2 2012: D+13.7 2008: D+19.9
Not yet ingested
- Civics
- —
Market trends
- HPI YoY
- ▼ -96.70%
- Current HPI
- 130.6765
- Rent YoY
- ▲ 6.59%
- Metro
- St. Louis, MO-IL
- State GDP YoY
- ▲ 1.84%
- F500 in state
- 20
Industry mix (Fortune 500 HQ in MO)
| Industry | F500 HQs | Revenue |
|---|---|---|
| Healthcare | 1 | $163B |
|
||
| Insurance | 1 | $21B |
|
||
| Industrial Technology | 1 | $17B |
|
||
| Retail | 1 | $16B |
|
||
| Industrial Distribution | 1 | $10B |
|
||
| Utilities | 1 | $9B |
|
||
Price history
+677.2% since first listed3 events — show timeline
- 2026-06-11 Listed $139,900 MARIS as Distributed by MLS Grid
- 2013-08-14 Sold (Public Records) $108,000 Public Records
- 2012-09-28 Sold (Public Records) $18,000 Public Records
Property tax history
+5.6%/yrLatest (2022): $2,631 · +0.9% YoY. Source: county tax records.
Cash-flow waterfall
monthlySold comps — $/sqft
last 12 mo · ≤1 miLoading sold comps…